What Are Dashboard Apps?
Dashboards are data discovery, visualization, and reporting tools that help create a more rational, data-driven, and profitable decision-making process. The are called dashboards because their design closely resembles the instrument cluster used to monitor functions on a car dashboard. Business dashboard apps are an information management tool that organize and present important business data in as an easy-to-read, snapshot progress report that relies on visuals to simplify data inputs. Often, the dashboard is linked to an underlying database and displayed on a web page so the report can be continuously updated. Dashboards display real-time data and information such as charts, graphs, and gauges. Business dashboards also often provide a quick report of Key Performance Indicators (KPIs) relevant to a business process or an organizational objective.
A Brief History of Dashboard Apps
Forerunners of current business dashboards were first developed in the 1980s, when Executive Information Systems (EISs) used this tool to support senior executives in the decision-making process. However, data refreshing and handling issues weren’t solved until the late 1990s. Dashboards were put on the map as KPIs came to prominence in business management, and as the balanced scorecard (developed by Robert S. Kaplan and David P. Norton) became widely used for results-based management. Today, while user-friendly digital dashboard apps are commercially available as free or for purchase, many organizations either build their own apps or modify existing solutions to meet their particular needs. Many companies use Business Performance Management (BPM) to reach goals, and the use of dashboards apps is an integral part of the approach.
The ‘Hybridization’ of Scorecards and Dashboards
Scorecards are top-down performance management tools developed as a visual representation of the balanced scorecard approach. They use the most important KPIs to monitor progress to set strategic goals throughout the organization. Updated regularly, scorecards emphasize individual accountability for achieving those goals. Dashboards provide high-level data about what’s happening in the organization, help users visualize the performance in real-time, and can also drill through top-level information into supporting data. Today’s dashboards tend to be hybrids of the two that combine both into understandable, interactive reports. Like business itself, dashboard design is continually evolving.
How are dashboards designed for maximum effectiveness? Throughout this article, two dashboard design experts provide insight, best practices, and individual case studies in the healthcare and small business categories to illustrate the complexities involved in the process.
Benefits: The Challenges the Best Dashboards Solve
“In any business, dashboards are information management tools used to track and manage your KPIs, metrics, and other key data sets relevant to the business,” says Cuesta. “A dashboard is meant to provide a high-level view of complex data to assess the current performance of a business, which can be difficult to spot in the day-to-day work of running the business.”
Digital dashboards allow managers to monitor the contribution of various departments in their organization. To gauge exactly how well an organization is performing overall, digital dashboards allow you to capture and report specific data points from each department within the organization, thus providing a snapshot of performance.
“The main problem that dashboards solve for business users is the issue of scattered data. Businesses now are using more cloud software to run their business every day. That means that there’s more and more data available for them to use,” explains Hewitson. “However, data scattered across several platforms makes it difficult to get the full picture of how a business is doing. Having it all in one dashboard makes it easier to see exactly what’s happening and as a result, users will make stronger, more data-driven decisions.”
The Multiple Benefits of Well-Designed Dashboards
As our experts point out, dashboards are data measurement monitoring devices that eliminate uncertainty about where your organization has been, where it is presently, and where it could be if you use business data wisely to drive profitable decisions and ongoing improvements.
Some benefits of business dashboards include:
- Real-time Data Access: In a hypercompetitive world, you must be nimble to beat the competition. Being able to course-correct quickly, understand and respond to customers, and optimize in the moment can be a game-changer for any type of business.
- Comprehend Data: A visual presentation of performance metrics/KPIs makes it easy to quickly identify data outliers and correlations, and to pinpoint operational threats.
- Identify Trends: Predict customer, audience, and internal behaviors based on historical and current data.
- Assess What You’re Doing Right and What Needs Correcting: With results, trends, and team and individual accountability front and center, you can see what’s working and what needs to change to meet goals and keep focused on continual improvement. You’ll be able to clearly see where your company is delivering value and where it isn’t.
- Generate Reports: The ability to generate detailed reports based on your own criteria makes it easier to identify issues and correct them, or take advantage of new opportunities.
- Informed Decision Making: The ability to make more informed decisions (including those that will control costs) based on collected business intelligence and historical data.
- Align Strategies to Goals: Using KPIs and other custom metrics as a guide clarifies what actions you need to take to reach goals.
- Save Time: Instead of running multiple reports or looking at multiple data sources, you gain instant access to information.
- Visibility of All Systems: Transparency makes it easy to understand where your organization is going - either as a whole or in specific areas - and is clearly visible to all team members with access to the dashboard.
- Customize to Fit Your Organization: Whether you buy an off-the-shelf app or build your own dashboard, you should be able to modify it based on your organization’s needs for greater efficiency, reporting, collaboration, and transparency.
- Drill Down Into What’s Driving Your Business: Learn more about any element represented on the dashboard by clicking on it to navigate to the underlying database and view more detail. Some dashboard software limit the number of drill downs you can perform.
All of these benefits accrue from well-designed dashboards. Next, we’ll look at what elements make for high-functioning dashboards.
Assessing Dashboard Quality — Dashboard Design Considerations
Whether you build your own or use a software app designed outside of your organization, there are some key elements to consider when it comes to dashboard design.
“It’s all about the data, so a good dashboard design is created for maximum data visibility,” says Hewitson. “The UI should be clean and clear without any distractions. At neatly.io, we consider how the data itself is visualised. Is the correct chart being used to deliver this information? A great reference that we’ve recently used to reinforce design is ChartMogul’s Data Literacy CheatSheet. Depending on the audience, there may be differences in how the data is presented. Those requiring complex, detailed information have different needs from those who struggle to understand data and just want to see the important details instantly.”
Cuesta has some other pointers: “The best dashboard design will give you the high-level overview of what is important to your business. The dashboard must carefully balance providing enough data to be actionable and provide insight, but not so much that users become overwhelmed and cannot figure out which metrics are the most important for their specific goals. In this area, not all dashboards are created equal.
“Presenting the right balance of information, in the right way, is the hardest part of any dashboard design,” adds Cuesta. “Even across a single vertical such as healthcare, the same information can be presented in a myriad of ways, sometimes leading to different conclusions depending on the math behind the metrics or how the data is presented in context with other data points.”
Cuesta say that an effective dashboard design will:
- Highlight the key metrics relevant to the business, with appropriate context to spot trends and drill down to explore.
- Not over-emphasize data visualization, which can get in the way of the actionable numbers and take up a lot of visual space.
- Be designed specifically for businesses of differing sizes and in different verticals.
Case Study: Healthcare Dashboards Highlight Monthly Goals
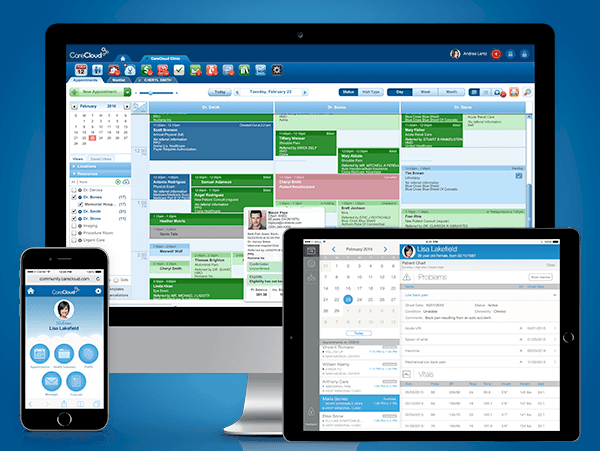
Cuesta shares how his company develops healthcare dashboards that are in use by providers in 48 states. Cloud-based, CareCloud is a healthcare practice management system that offers a full suite of apps for billing and administration to help practices become more efficient and generate greater revenue. Cuesta explains what healthcare dashboards can offer:
Historically, within healthcare, billing and revenue have been the key KPIs of most dashboards. While important, patient experience plays a growing role in the success of medical practices, particularly in an era where billing is now tied to quality metrics/value delivered to the patients. In a healthcare dashboard, patient experience KPIs could focus on average wait time per appointment type, clinical outcomes and even integrated patient feedback given through surveys, emails or online review sites.
In practice, we have seen the ability for this performance scorecard help practices accelerate their growth, but the KPIs also help redirect effort to meet performance goals. In healthcare, the KPIs are often complex, with many ways to calculate and interpret them. The CareCloud Command Center was built with transparency over calculation and data sources, so you can drill down into any metric and truly understand what the KPI is measuring.
In one specific instance, a physician was worried that a series of cancellations in the week was an indicator of a patient experience issue at the clinic. Looking at the dashboard, the practice administrator was able to quickly demonstrate how the trends for the month were actually ahead of monthly performance goals, using data to refute a feeling that could have misdirected efforts within the practice.
Medical practice administrators and leaders juggle hundreds of different priorities at any given moment, from patients to billing or a growing backlog of administrative issues. Stepping outside of these tasks, a practice performance dashboard can give you the perspective to assess the key KPIs to ensure you’re prioritizing the right things in your practice. An effective dashboard design will present information at a high-level with the opportunity to drill down into the data both over time and by metric to understand trends.
Case Study: Developing Small Business Dashboards
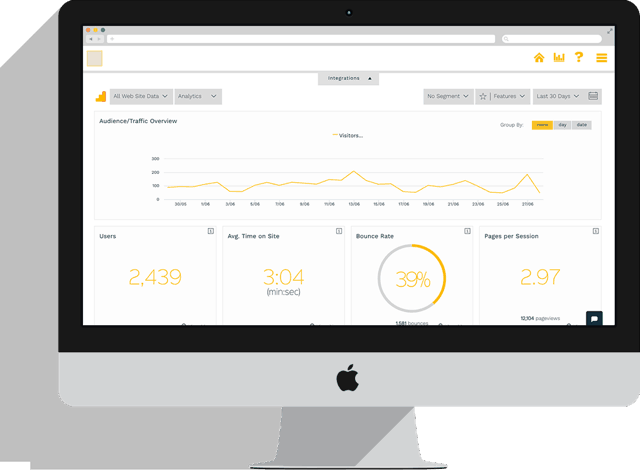
Hewitson shares how she and her partner developed neatly.io for small business owners who want to view all of their data on a single dashboard and identify insights. They generally operate an online presence and/or utilise SaaS platforms. Hewitson explains the to key to creating a business dashboard:
When we were designing neatly, our lead designer told us that the lack of design is the most important element of data visualisation design. Coupled with an audience of those who just want plain and simple information, we really simplified down the data on our dashboards.
Because we’ve stuck to this principle, we’ve been told that our dashboards actually make the data easier to understand. We’ve had clients who’ve struggled to navigate and understand Google Analytics, yet when they use our dashboards they find it much easier to understand what’s happening. The link between all of these elements is taking into account the purpose - what information needs to be displayed, and how to display it effectively.
Dashboard Classifications
Dashboards can be classified as strategic, analytical, or operational. Dashboards can also be a combination of these types:
- Strategic/Executive: A high-level view for executives and managers that provides access to data they need to determine organizational health and identify potential opportunities for improvement and expansion. While these dashboards don’t provide highly detailed information, their simplicity and aggregated metrics showcase the KPIs that the executive team tracks on a periodic (daily, weekly, or monthly basis) to drive decision-making.
- Analytical: These dashboards are all about understanding trends and their causes, and help users make comparisons across multiple variables and timeframes. They are more detailed than either strategic or operational dashboards, and hold operational and strategic data within them. Analytical dashboards facilitate data interactions and offer drill-down functionality to enable data exploration and to cull insights from as many sources as possible.
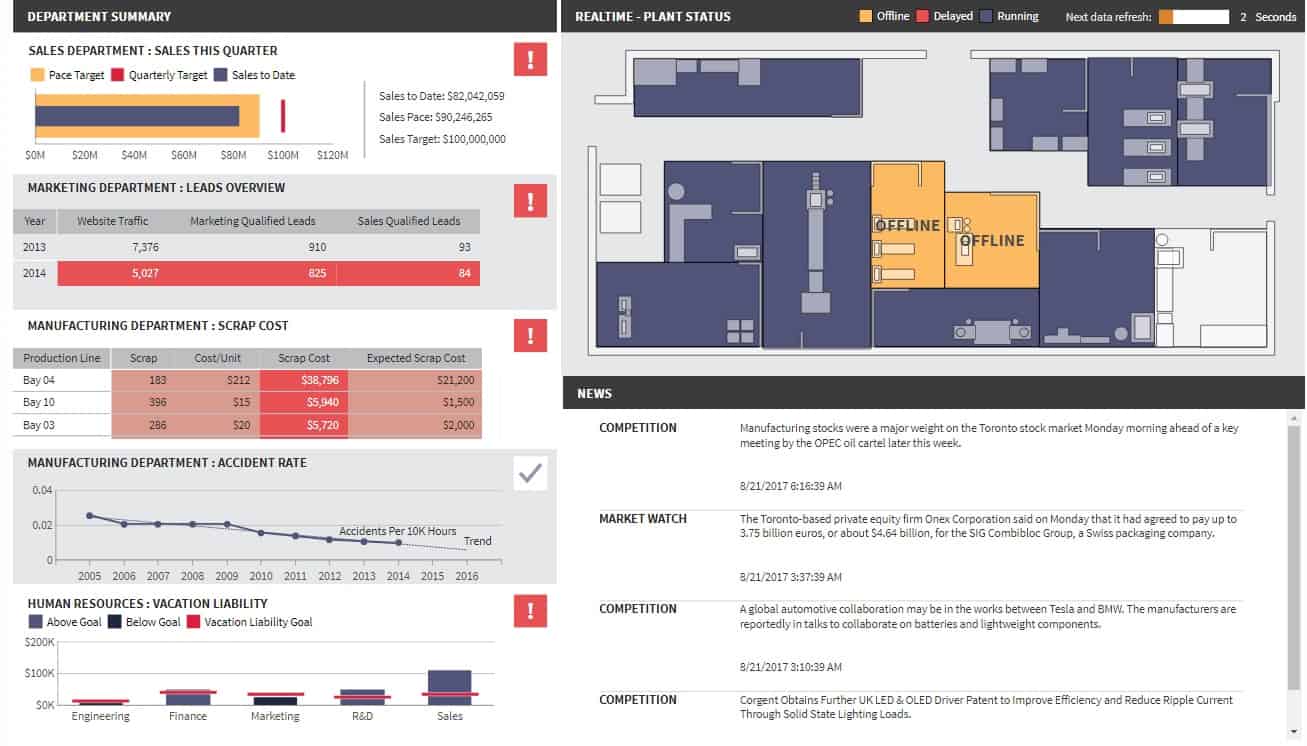
- Operational: Operational dashboards help departments stay ahead of problems and proactively solve them. The dashboards provide real-time alerts to any deviations from the norm, and are used to monitor and analyze a company’s activities in a specific business area - this often leads to more direct action. Generally, departmental employees use operational dashboards. For example, a manufacturing company may use an operational dashboard to track how many products have been produced along with those returned, and track the number of defects detected during or after manufacturing. Problems would be highlighted in real time so the situation can be corrected.
Downloadable Dashboard Templates
These easy-to-use and customizable templates are free to download, and can help make sense of your business both in-the-moment and in the future.
Executive Dashboards
CIO/Financial Dashboard Template
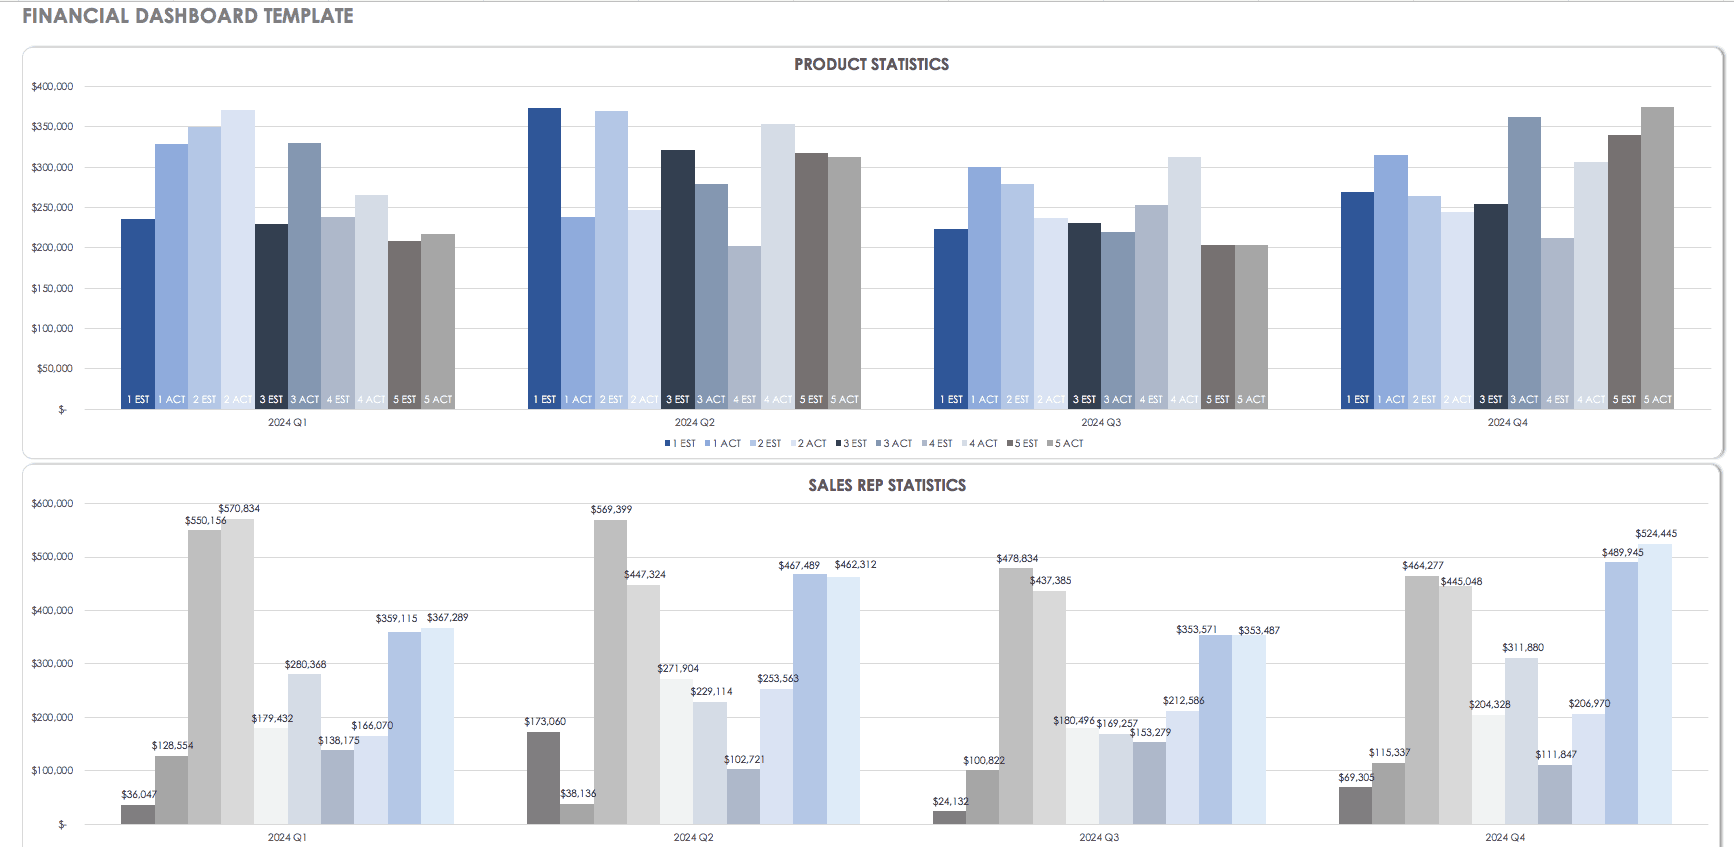
CIO dashboards provide a snapshot of your overall financial picture and provide drill down capabilities for understanding the underlying drivers of your financial status. This multi-functional dashboard is used to track sales, analyze business growth, and compare past performance to the present and predict future revenues. You can use all of the data to form strategic decisions that will positively impact revenues.
Download Financial Dashboard Template
CEO/Executive Dashboard Template
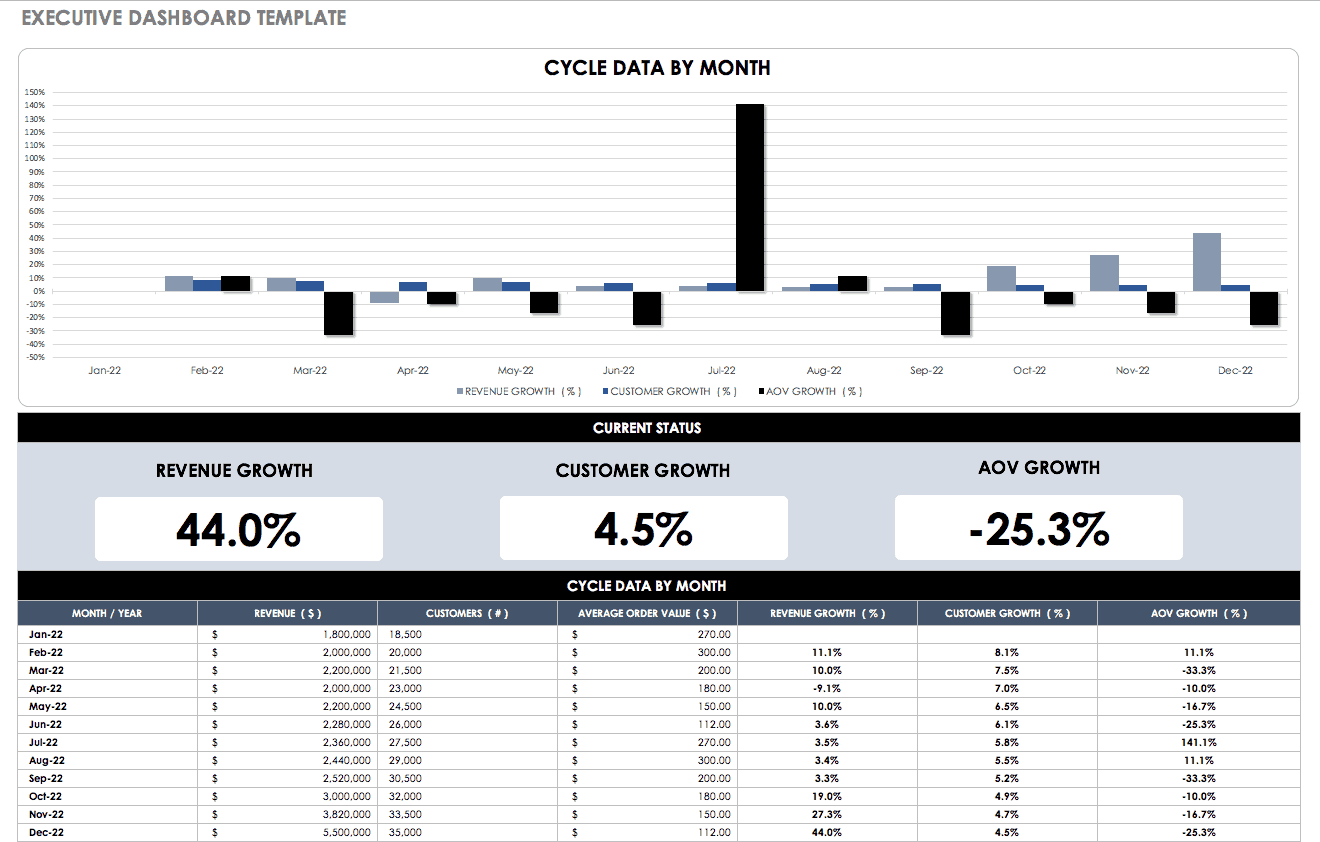
For the big picture view a busy CEO needs, an executive dashboard consolidates KPIs into an at-a-glance graphical report. This template is just one type of executive dashboard. To learn more about different types of executive dashboards and their benefits, read Everything You Need to Know About Executive Dashboards.
Download Executive Dashboard Template
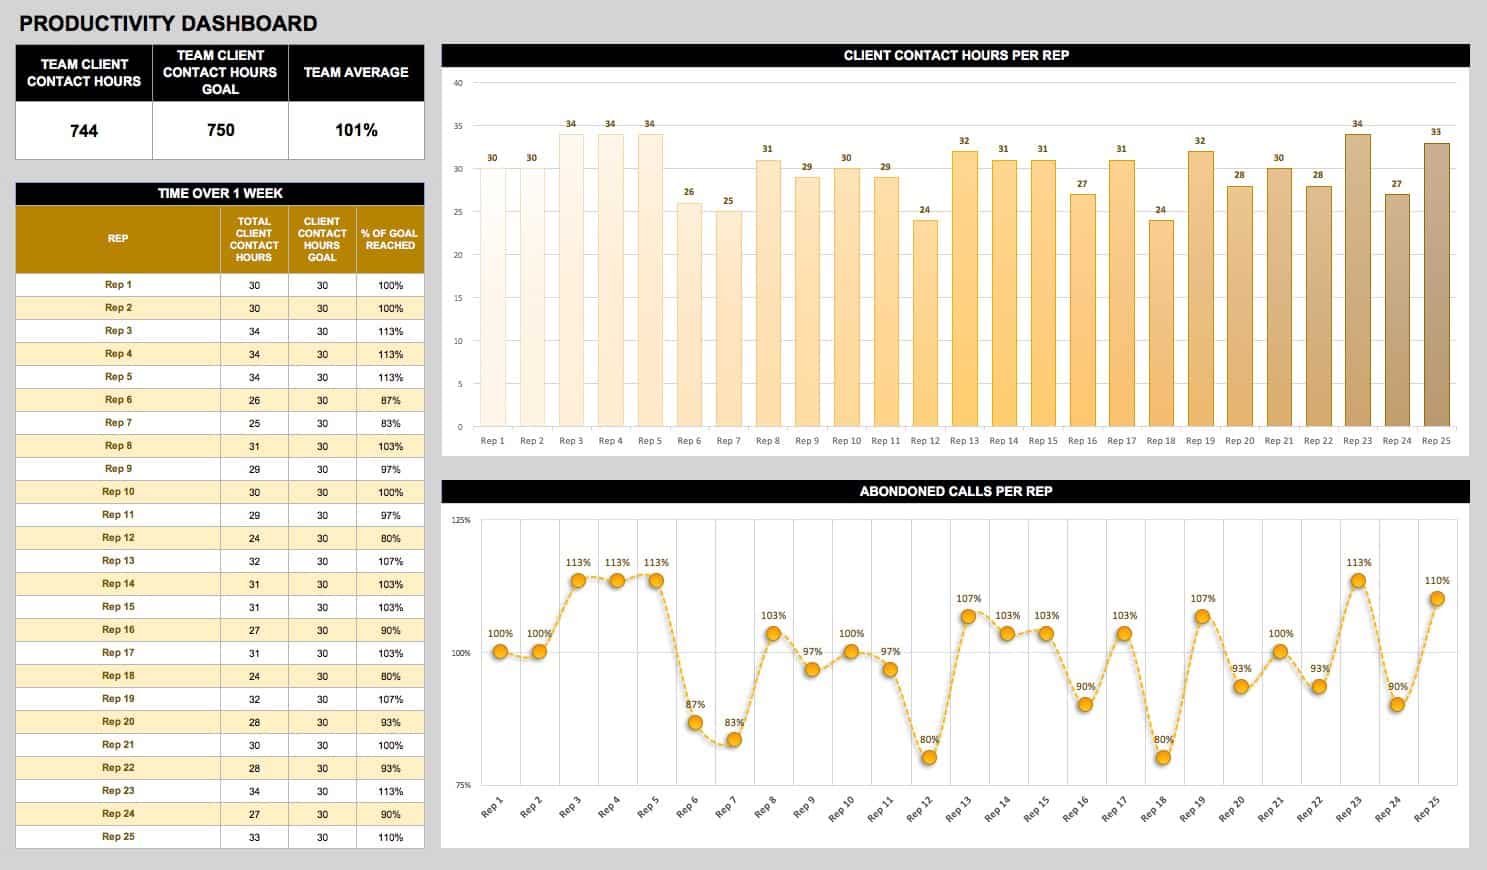
Operations/Productivity Dashboard Template
Control and evaluate productivity and quality for individual employees, teams, departments, or your entire company with an easy-to-use dashboard template. Gain insight into company culture as well as business objectives by checking employee satisfaction metrics against performance.
Download the Operations/Productivity Dashboard
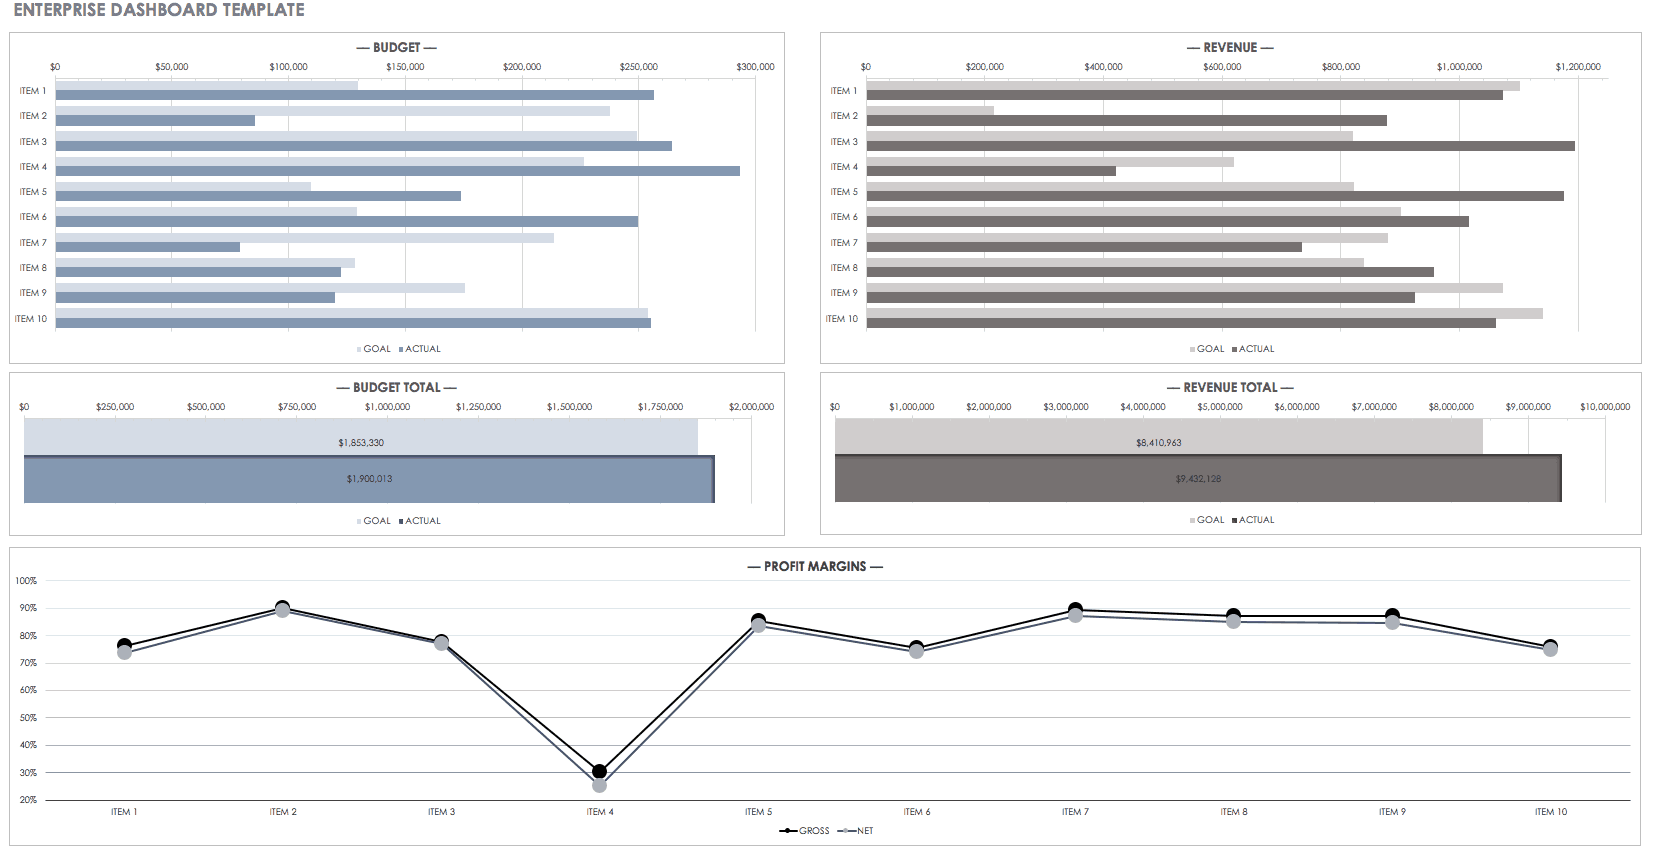
Enterprise Dashboard Template
Use the template as is, or customize it to suit your specific needs to track your organization’s key performance metrics with a dashboard that displays information in both graph and table formats. Easily share and understand your organization’s status with this well-designed dashboard.
Download the Enterprise Dashboard Template
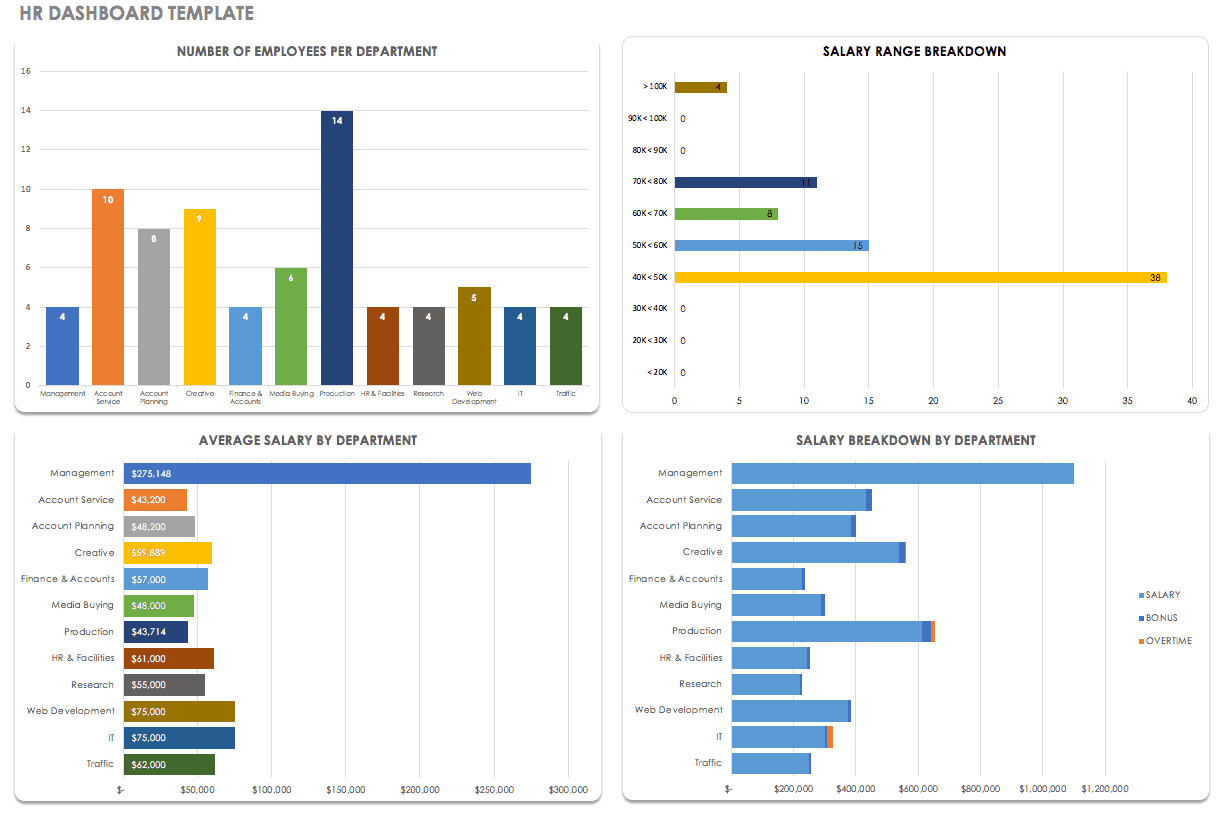
Human Resources and Recruiting Dashboard Template
Use this efficient dashboard to visualize human resources and recruiting data. This template is completely customizable, so you can modify it to include the metrics that make the most sense for your business to track benefits, employee satisfaction, or salaries.
Download HR Dashboard Template
Sales
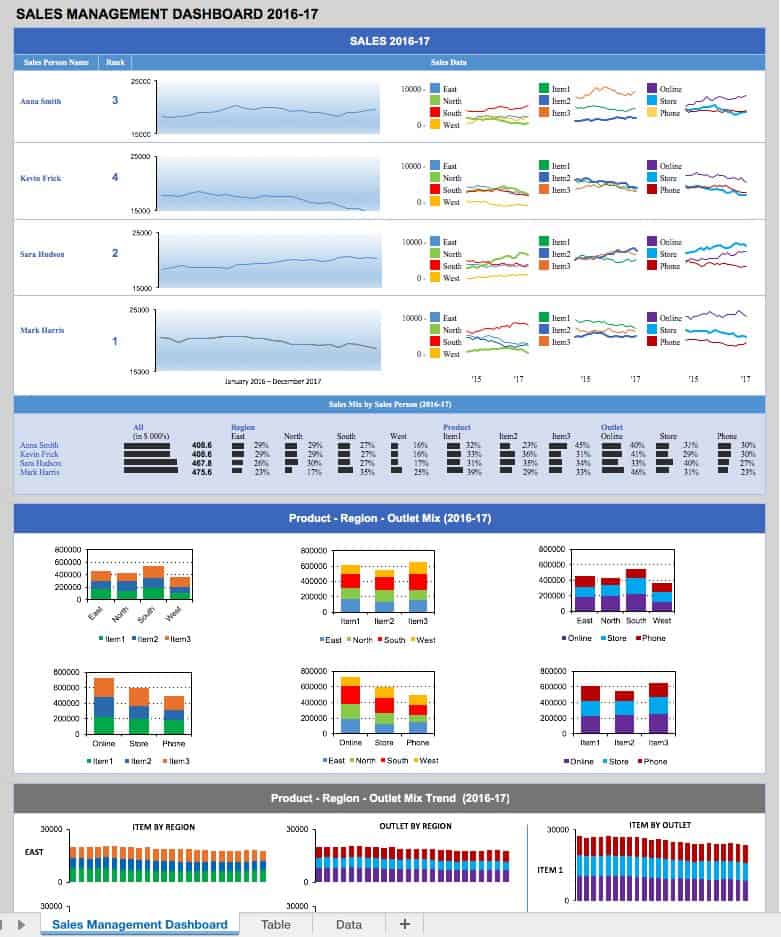
Sales Management Dashboard Template
Use this sales management dashboard template to track performance by region, product, salesperson, and more. With this data on hand, you can derive insights into roadblocks that may be slowing sales and drive employee accountability and progress.
Download Sales Management Dashboard Template
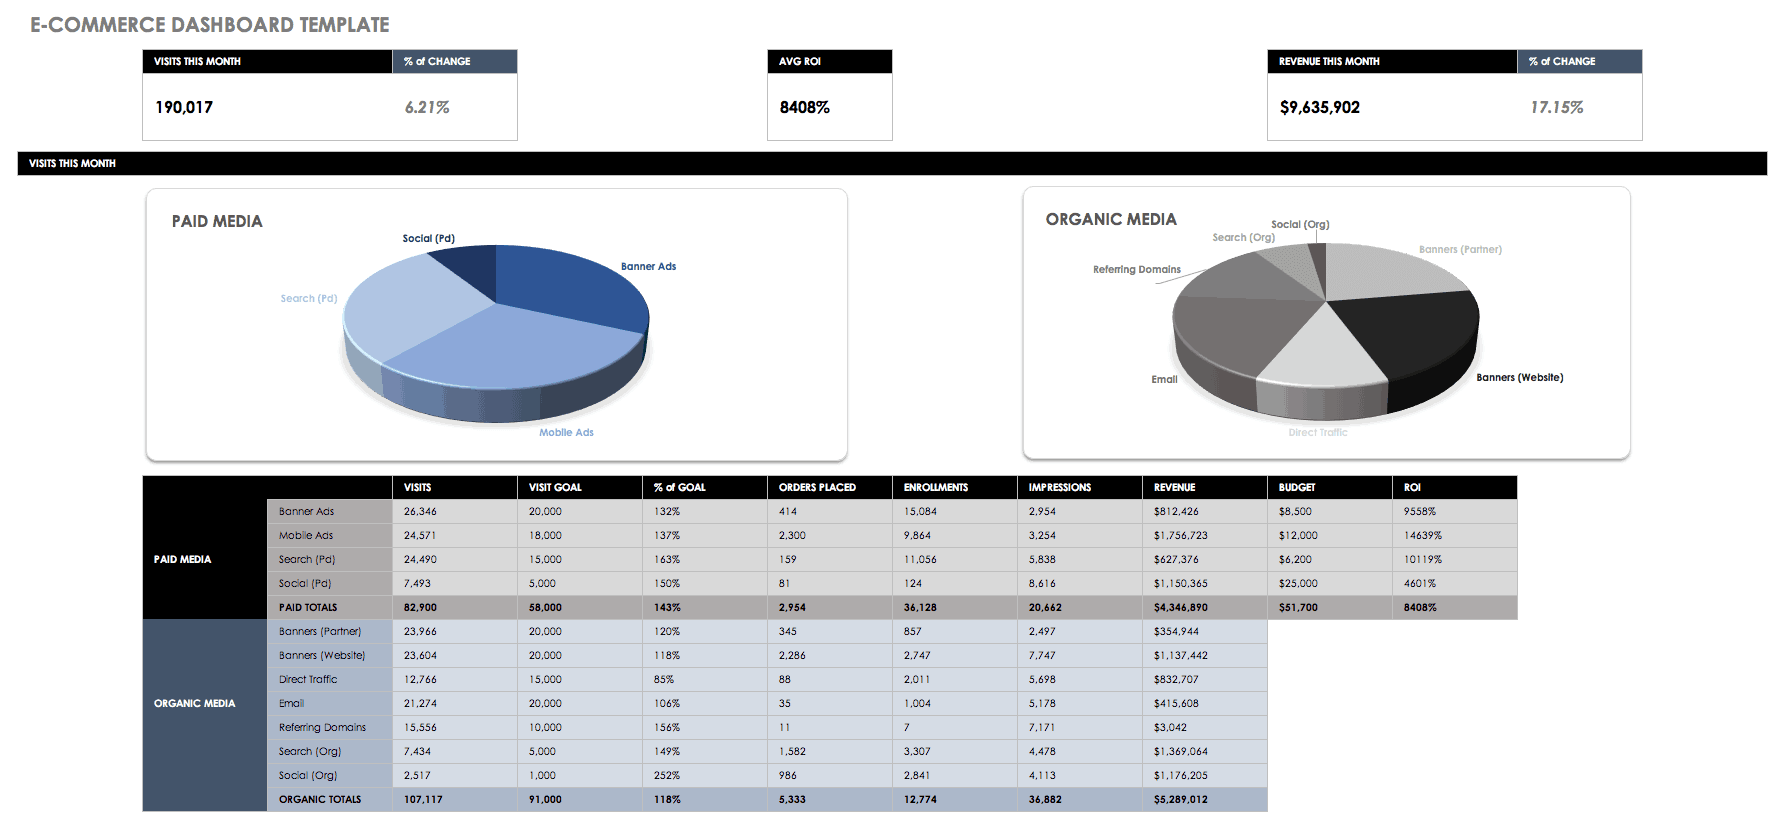
E-commerce Dashboard Template
Track e-commerce metrics like revenue, profit margins, user visits, conversions, and more with this sales dashboard template. Take a look into previous time periods and check your current e-commerce performance to past efforts to create an effective action plan for the future.
Download E-commerce Dashboard Template
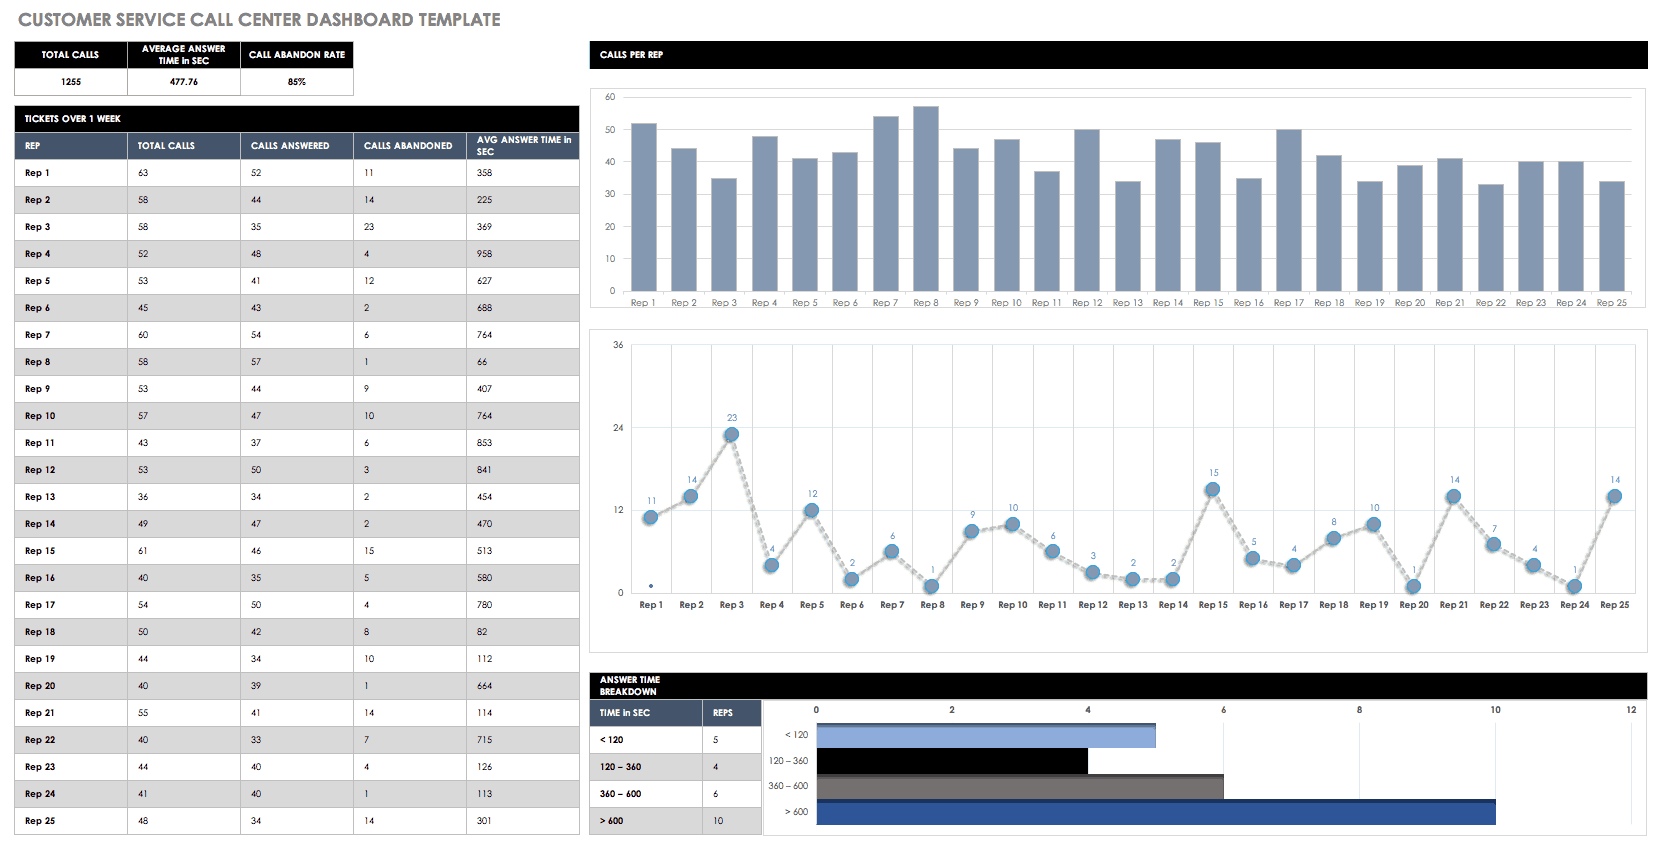
Customer Service Call Center Performance Dashboard Template
A dashboard enables the consolidation of important data at multiple levels, from individual agents to overall call center performance. Conduct an analysis of call center metrics every week, including customer satisfaction, agent performance, calls per minute, and more. Improve customer service and inform weekly goals using these key metrics.
Download Call Center Performance Dashboard Template
Marketing
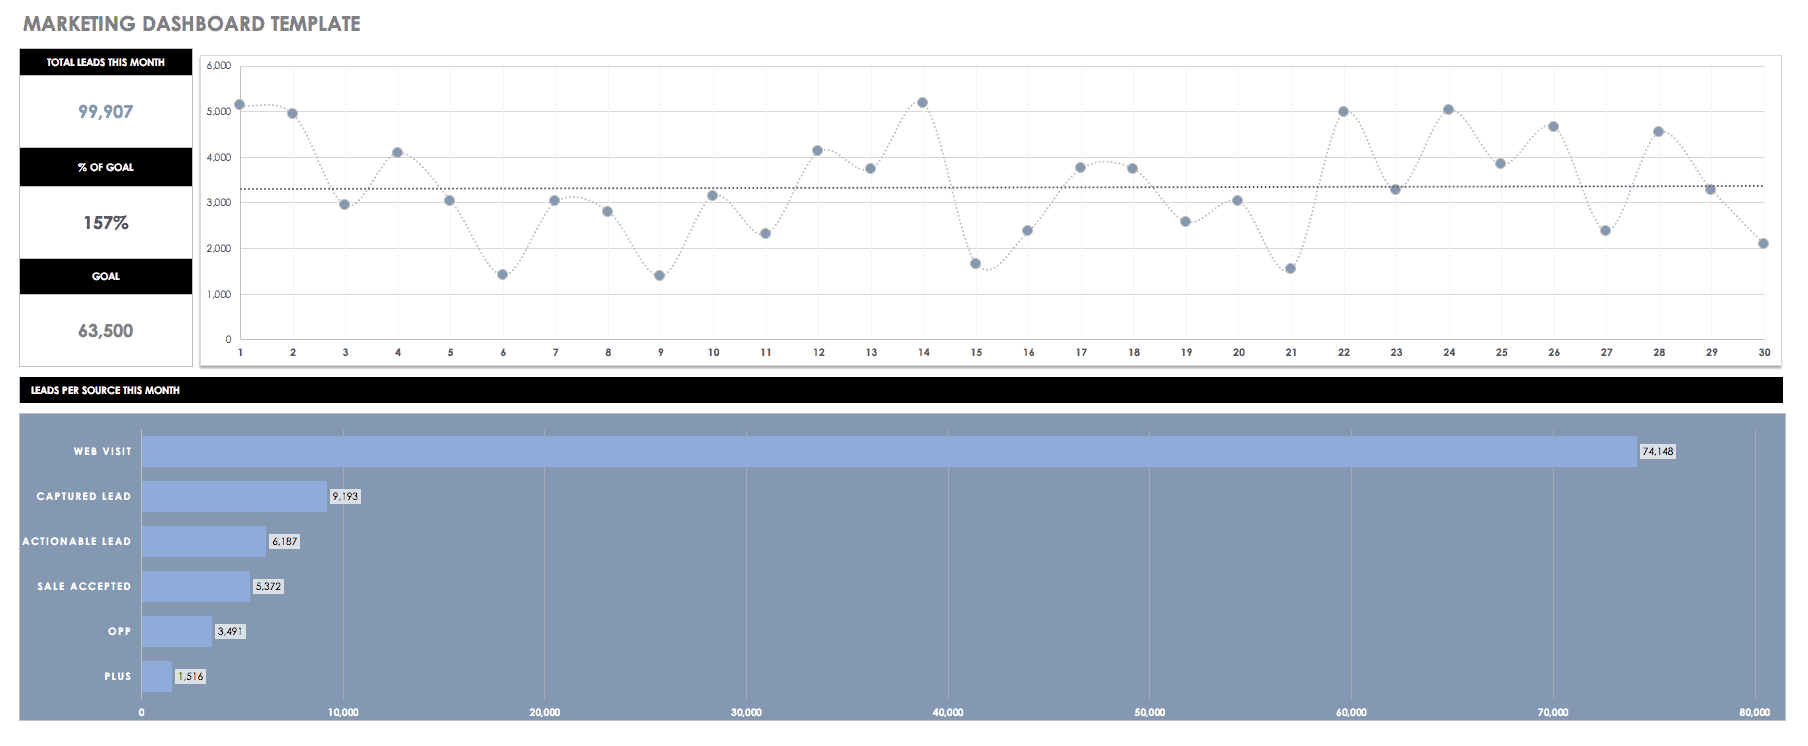
Marketing Campaign Dashboard Template
Track key metrics such as total leads for the month, leads per source, and traffic per source by the year with this simple template. You’ll have the metrics you need at a glance to assess campaign success and to drive present and future marketing decisions and goals.
Download Marketing Dashboard Template
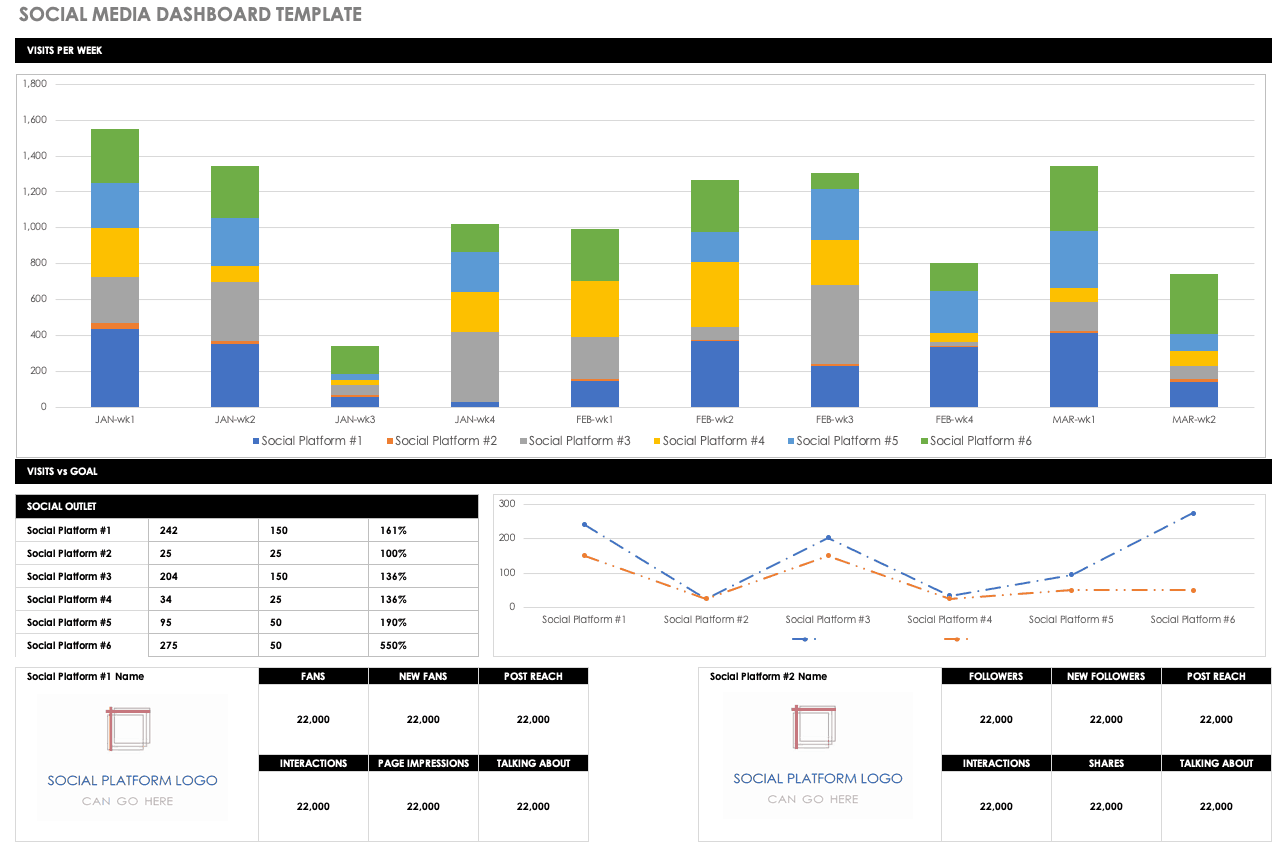
Social Media Dashboard Template
Check the status of your efforts on multiple social media channels such as Google, LinkedIn, Pinterest, and YouTube with a single report. This dashboard template can help you decide where to focus your social media efforts based on audience engagement. Make strategic decisions about where to focus your social media marketing efforts in fast-moving environments using real-time information.
Download Social Media Dashboard Template
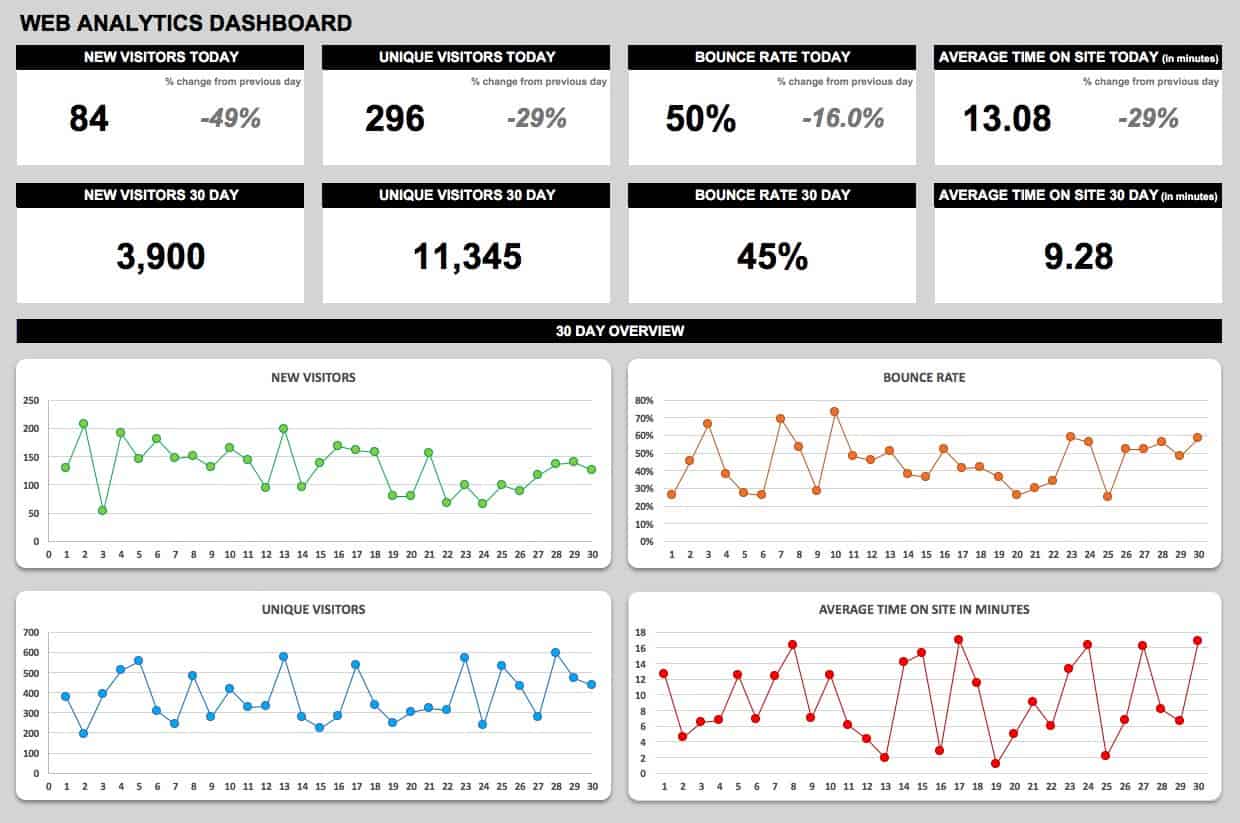
Web Analytics Dashboard Template
Take the guesswork out of website decision making. Track analytics such as new visitors, average time on site, and bounce rate with a dashboard template that makes it easy to understand the effectiveness of your site. You can modify metrics to align website performance to your business goals.
Key Elements of Successful Dashboard App Design
No matter what kind of dashboard app you need, they all have some common elements that make them effective business tools. Perhaps most importantly, the app should be quick to learn and understand. Consider these other common features as well:
- Simplicity: If the dashboard isn’t easy to use, no one will use it. Make sure that - whether you are creating your own dashboard from a template or using a purchased app - you test it prior to implementing it into your organization. Ease of use includes drag-and-drop capability, and fast chart and graph creation. Dashboards should also automate manual processes, like quotes and invoices.
- KPI Visibility: Since dashboards are typically used to highlight KPIs, those metrics should be front and center.
- Compelling Graphics: As Hewitson advises, the visuals don’t need to be fancy or complicated. The objective is that the dashboard portrays your KPI and business situation and story in a way that instantly communicates status.
- Timeframe Comparison: One of the most important functions of dashboards is the ability to look at past and present performance so you can make intelligent strategic decisions based on data. It should be easy to check data in the timeframes that make the most sense to you, so choose an option that lets you check short, medium, and long-term data trends.
- Customizable: Scalability, flexibility, and the ability to modify your dashboard as conditions and your needs dictate are important attributes of the best dashboard apps.
- Data Integration Capability: Whether you derive data from the cloud or through on-premise applications, dashboards are created with Application Programming Interfaces (APIs) so you can pull data from existing business systems. Using minimal coding, you should be able to easily draw from multiple data sources to compile all the information you need into your dashboard.
- Alerts and Notification: With real-time monitoring, you should have the ability to automatically create emails or other alerts and notifications based on rules you set up to meet critical business needs.
- Native Mobile Apps: The ability to use your dashboard on the go is a must, and best-in-class dashboards let you stay signed in no matter where you are.
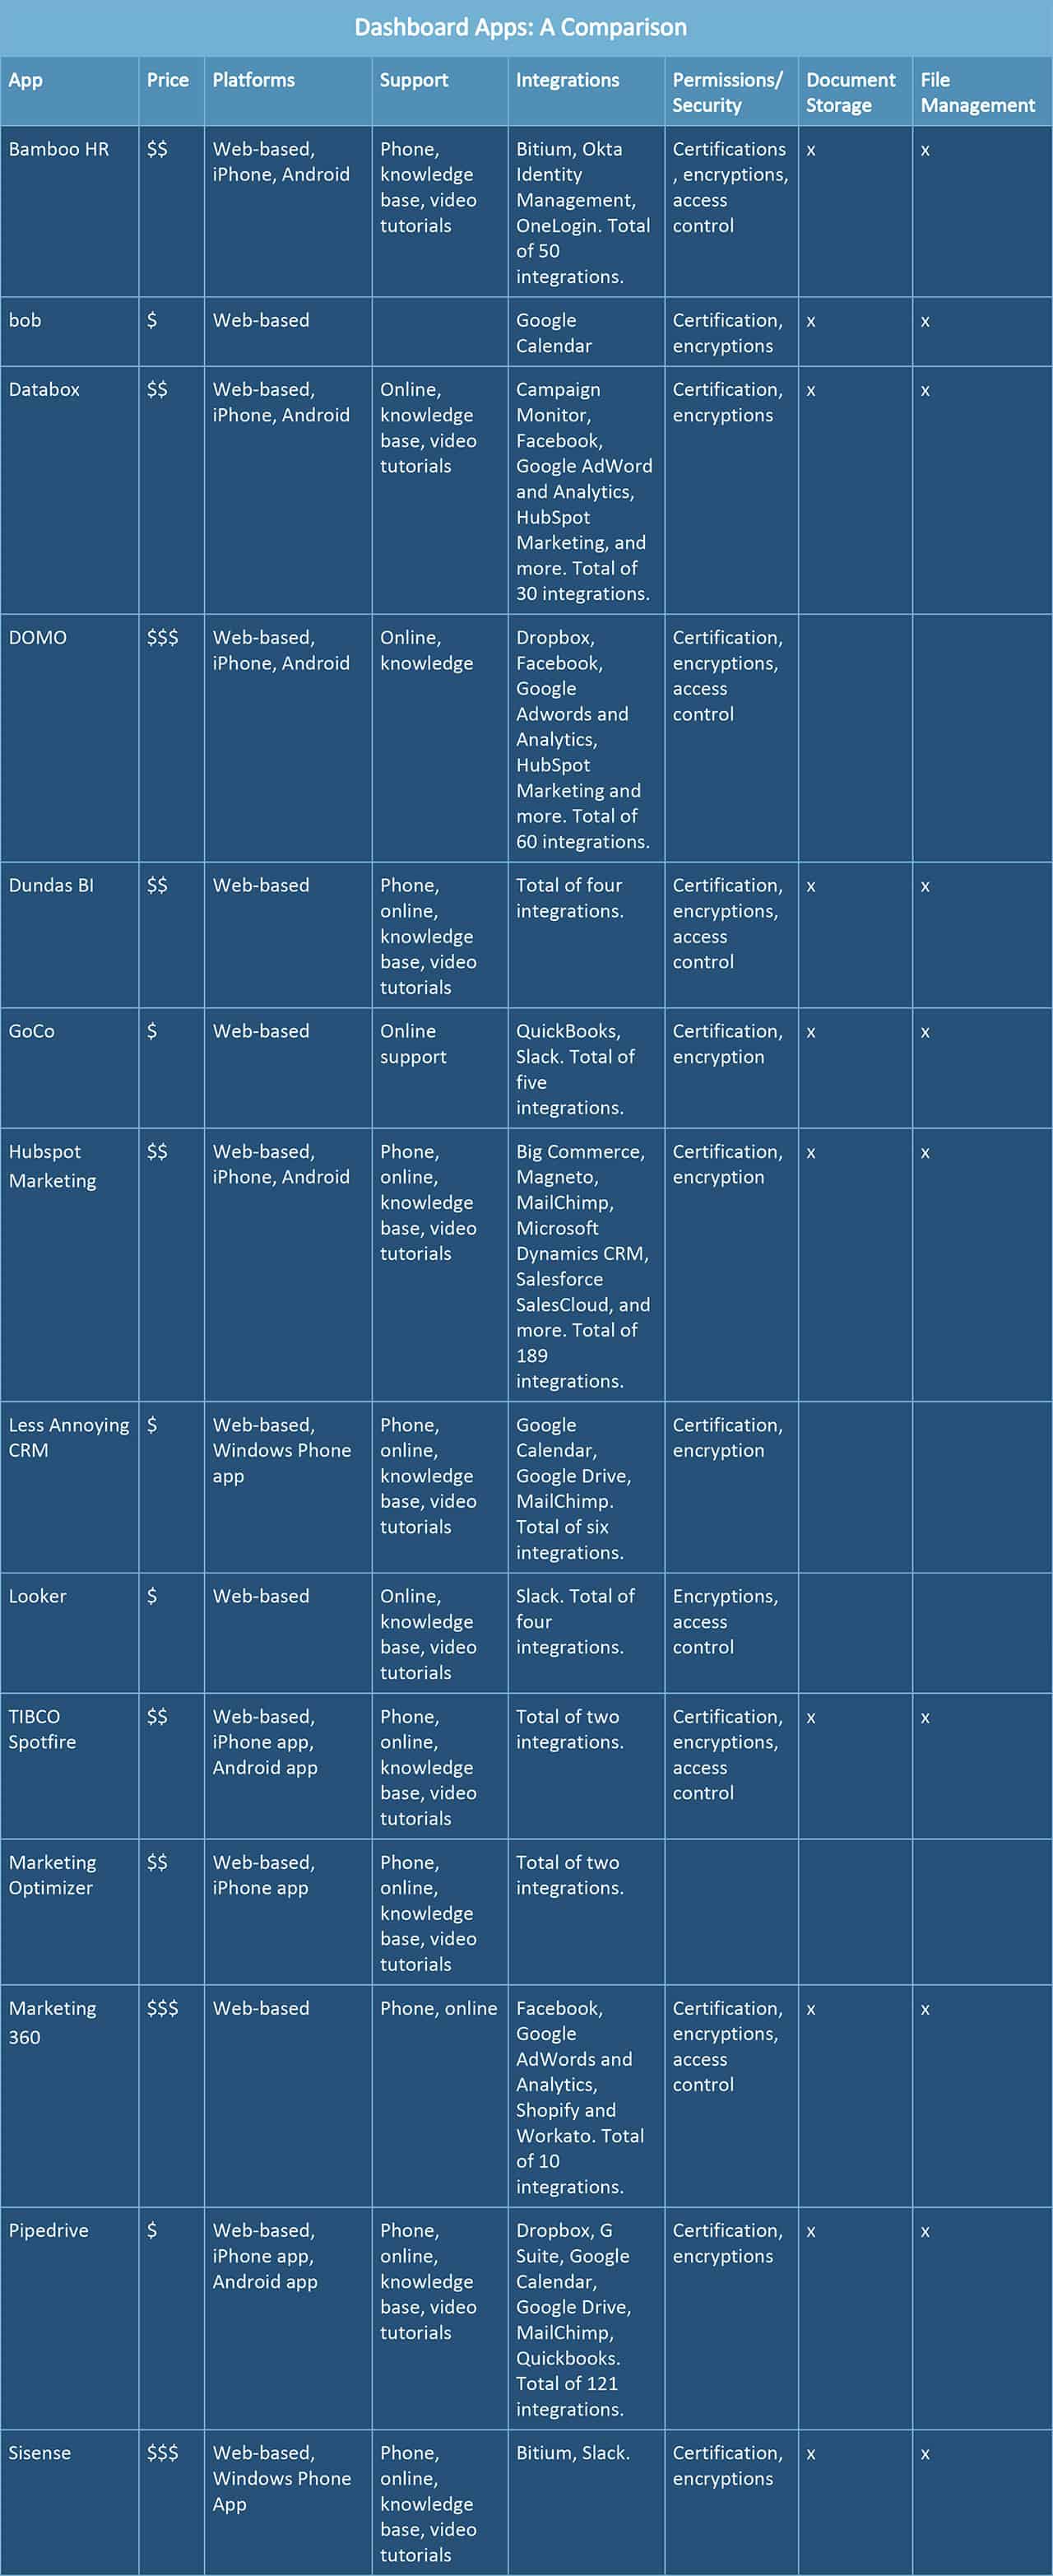
Comparison of Dashboard Apps By Category
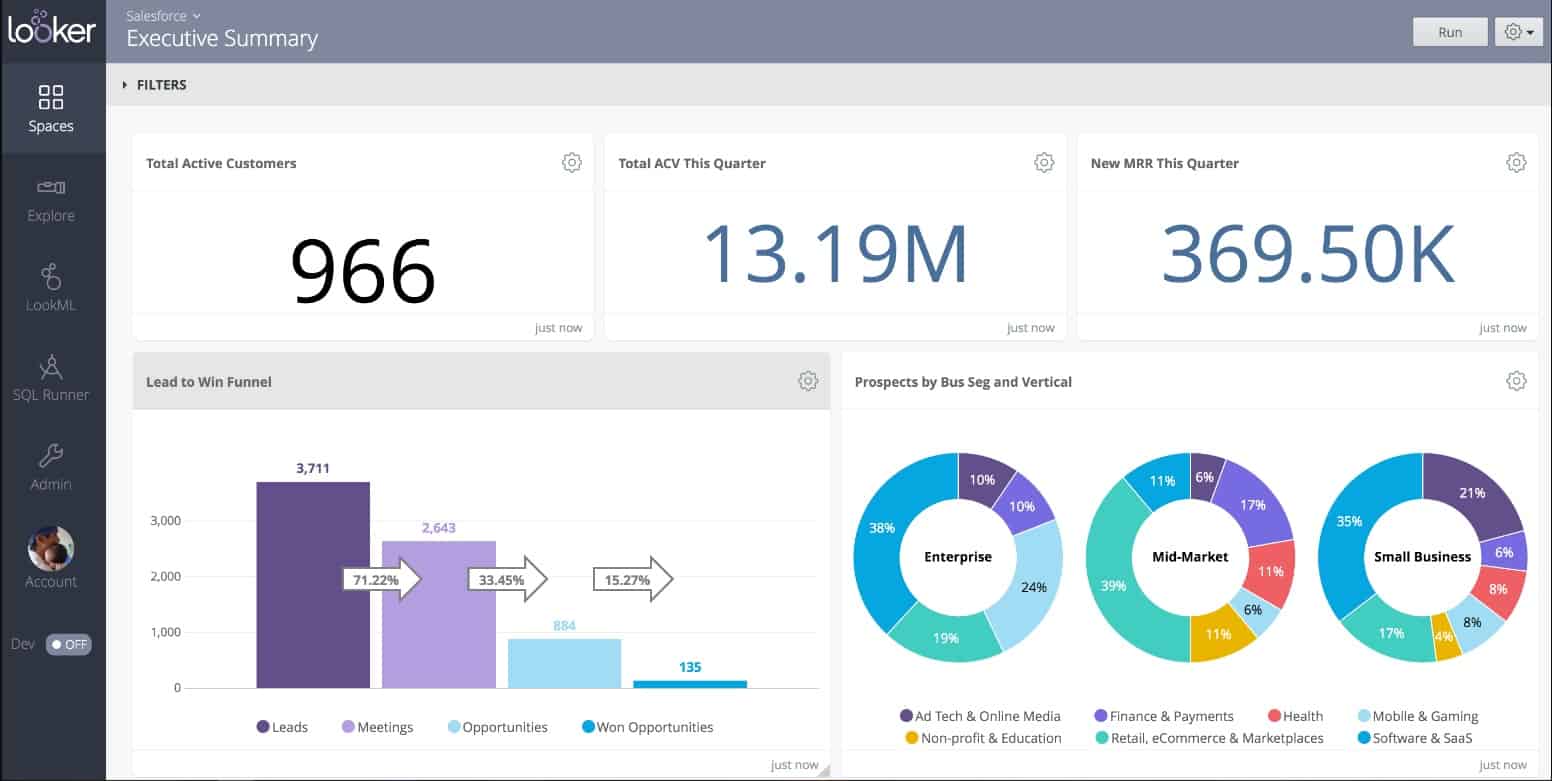
- Dundas BI: Designed for medium to enterprise-sized organizations, this data analytics and business intelligence platform provides in-the-moment data across organizations. Interactive reports and dashboards provide fast insights, and it’s built to seamlessly integrate into existing apps and systems.
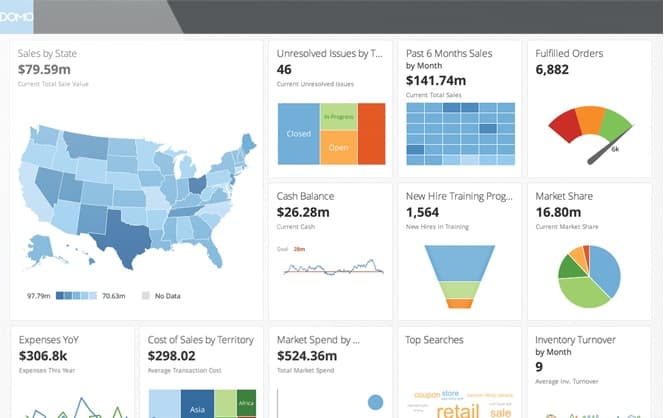
- DOMO: Best for medium to enterprise-sized organizations, this app is a customizable platform for statistical analysis and visualization. Domo helps business decision makers with business intelligence dashboards to make faster and better-informed decisions.
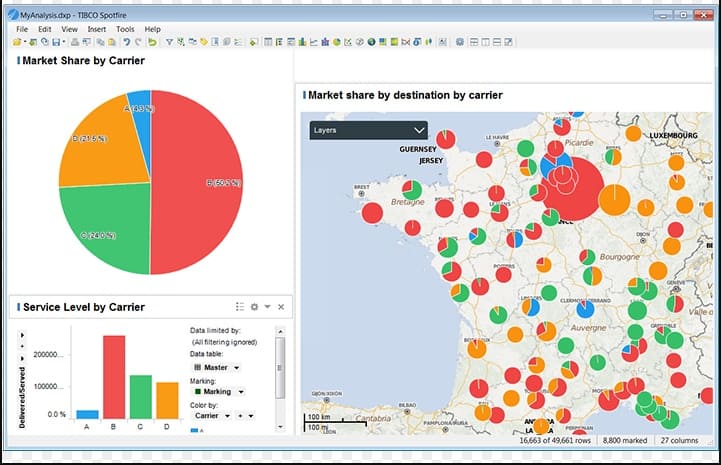
- TIBCO Spotfire: Built for medium to enterprise-sized organizations, Spotfire performs data analysis without IT support and enables building dashboards for real-time and predictive functions.
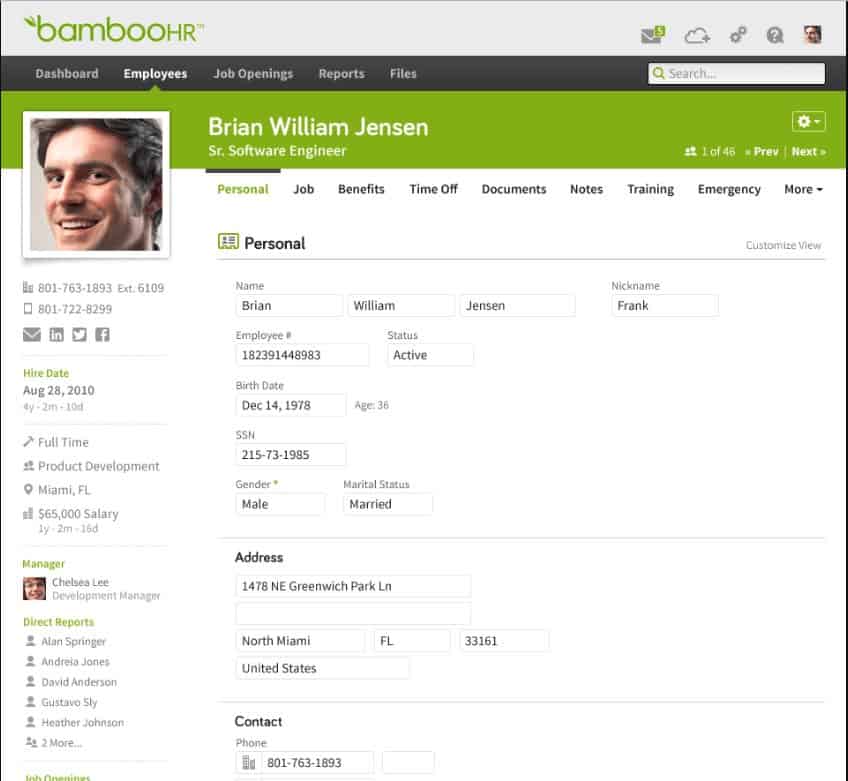
- BambooHR: Small and medium-sized businesses can use the cloud-based BambooHR to track onboarding tools, e-signatures, applicant tracking, time-off tracking, and performance management.
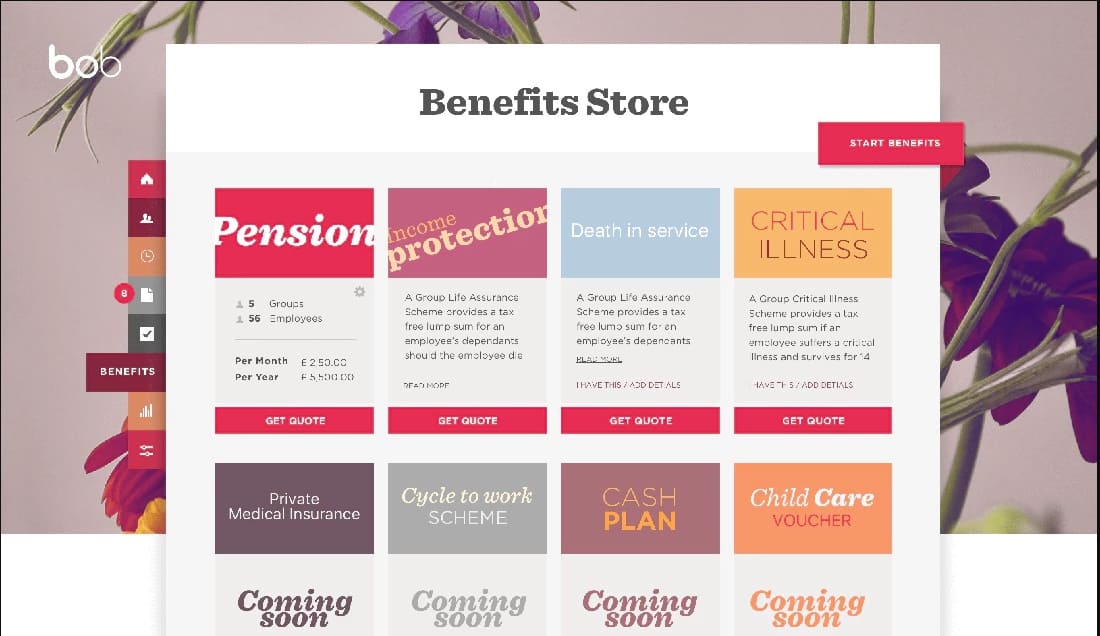
- bob: Designed for small to mid-sized non-and-for-profit organizations, bob is a cloud-based HR management and benefits administration platform. The app meets many HR needs such as document management, automatic pension enrollment, time off management, reporting, and onboarding employee engagement.
- GoCo: This all-in-one HR platform for small to mid-sized businesses (20-100 employees) also offers support and advice from payroll and benefit experts.
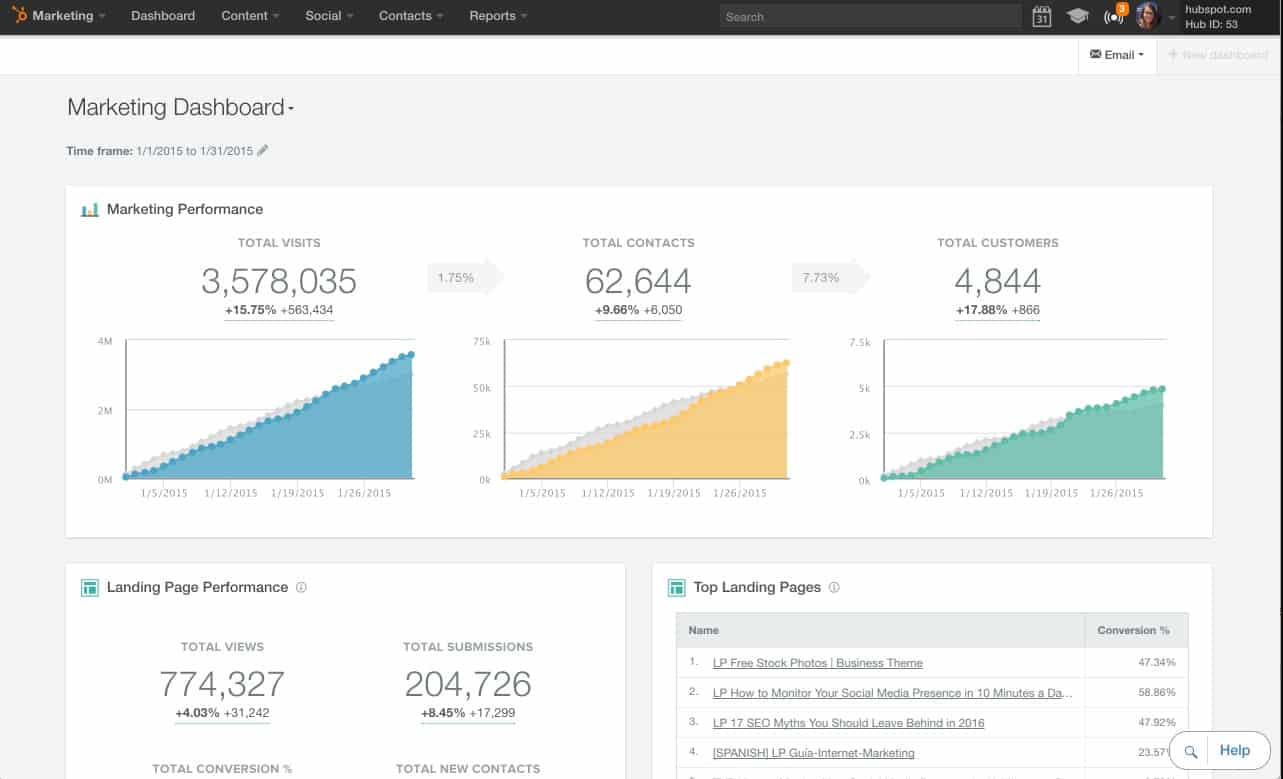
- HubSpot Marketing: Ideal for small businesses to enterprise organizations, this app is designed to increase traffic and convert leads using inbound marketing. Lead management tools are integrated with CRM for lead generation and behavior tracking.
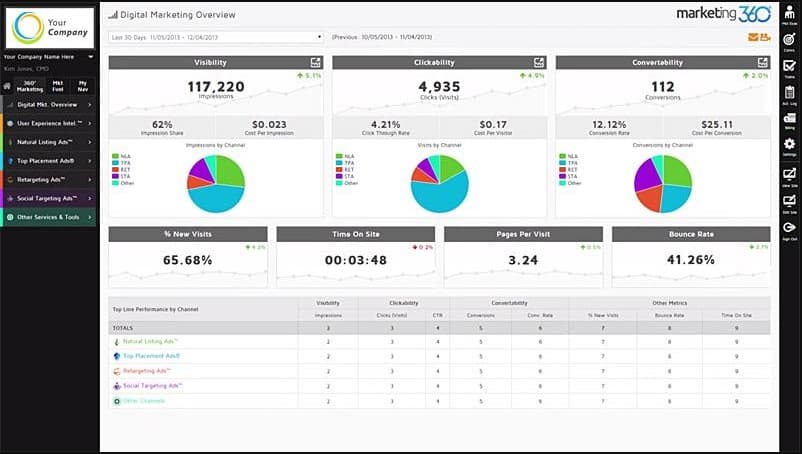
- Marketing 360: Built for small to mid-sized businesses, Marketing 360 is an end-to-end solution that offers integrated software and professional marketing services. The platform includes website design and a CRM module.
- Marketing Optimizer: Available for everyone from freelancers to enterprise organizations, Marketing Optimizer is an inbound marketing tool that focuses on improving sales performance and lead generation. It integrates with landing page optimization software, all popular website testing, and web analytics.
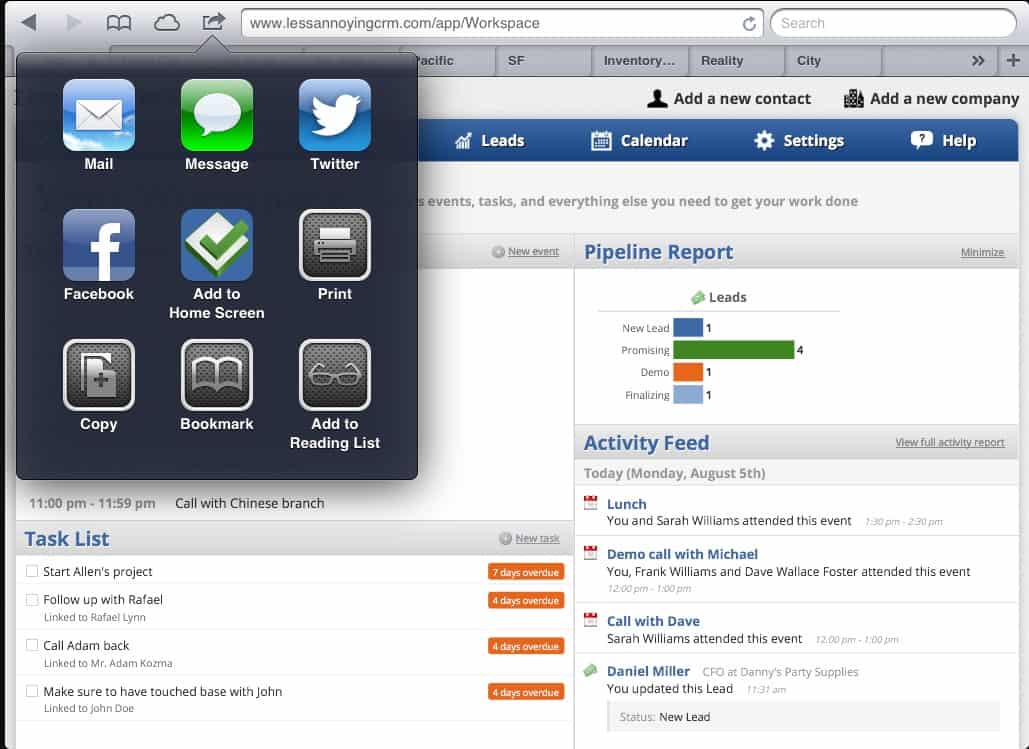
- Less Annoying CRM: For small businesses, this is an easy-to-use app to manage basic sales tasks with free assistance via email and phone. The app can be easily tailored, so you can accommodate existing workflows.
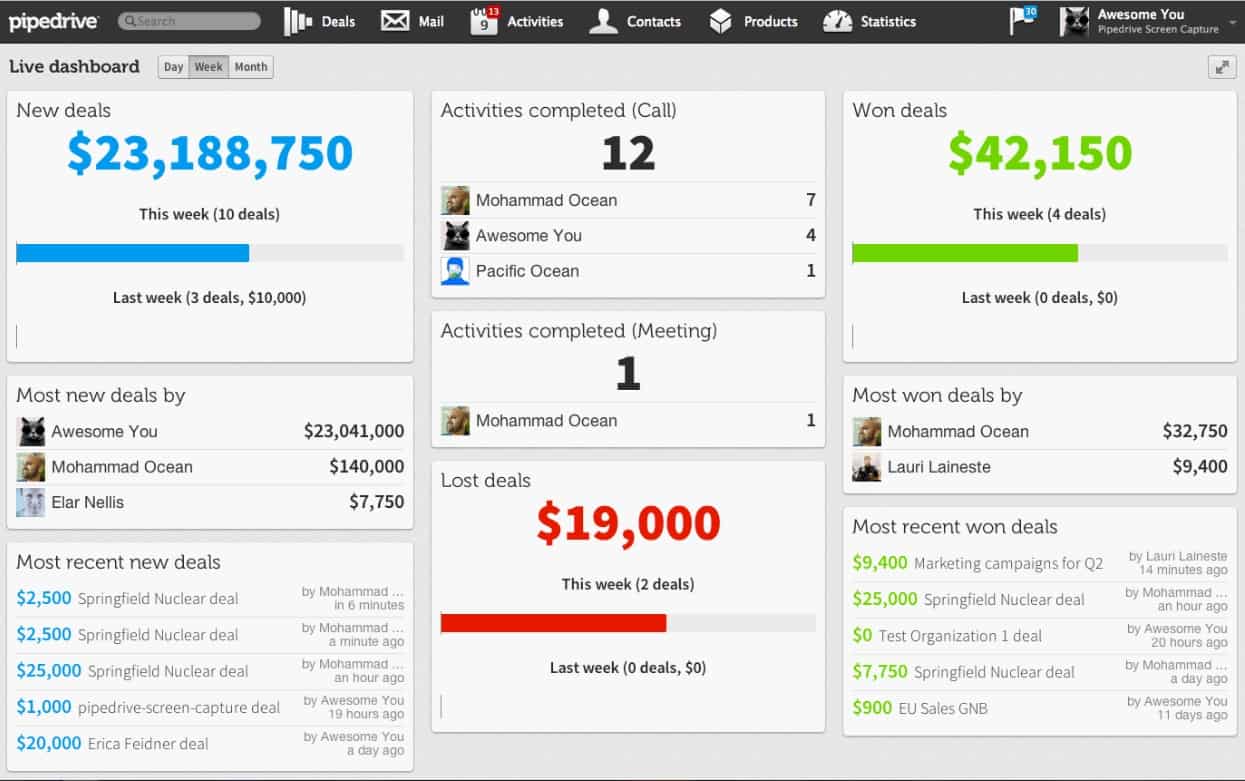
- Pipedrive: Freelancers to mid-sized businesses can use the Pipedrive tool step-by-step guidance on deal-closing activities. The app is simple to start and adaptable to any sales process.
- Looker: Built for small businesses to enterprise organizations, Looker operates completely in-database. The app’s open, lightweight architecture means that developers can easily build, deploy, and iterate upon dashboards.
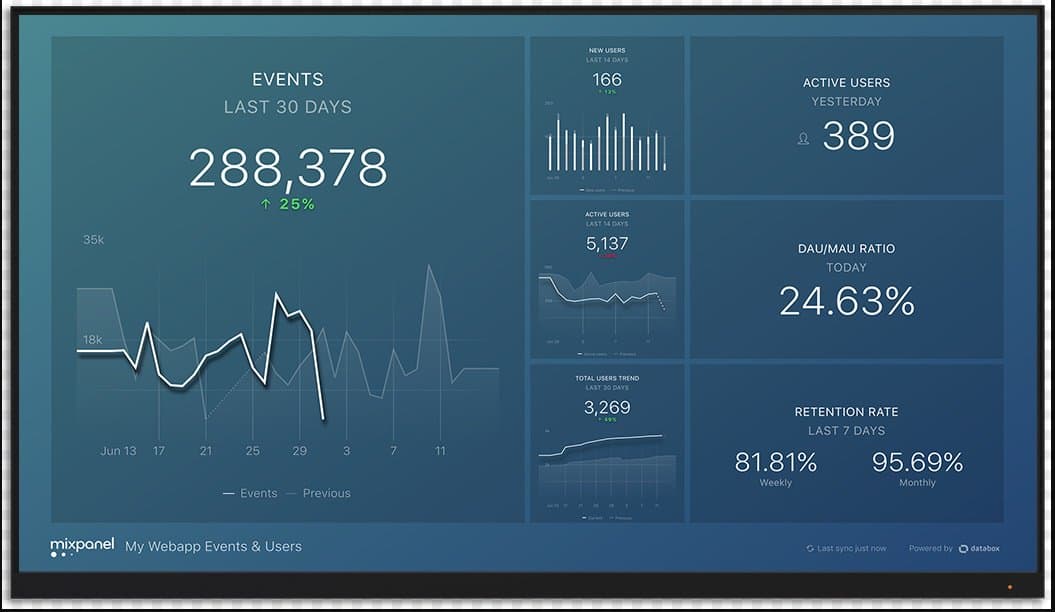
- Databox: A mobile-first KPI dashboard for small to enterprise-sized organizations. Databox gathers metrics in one place and delivers KPI data across multiple devices with one-click integration with multiple databases and apps.
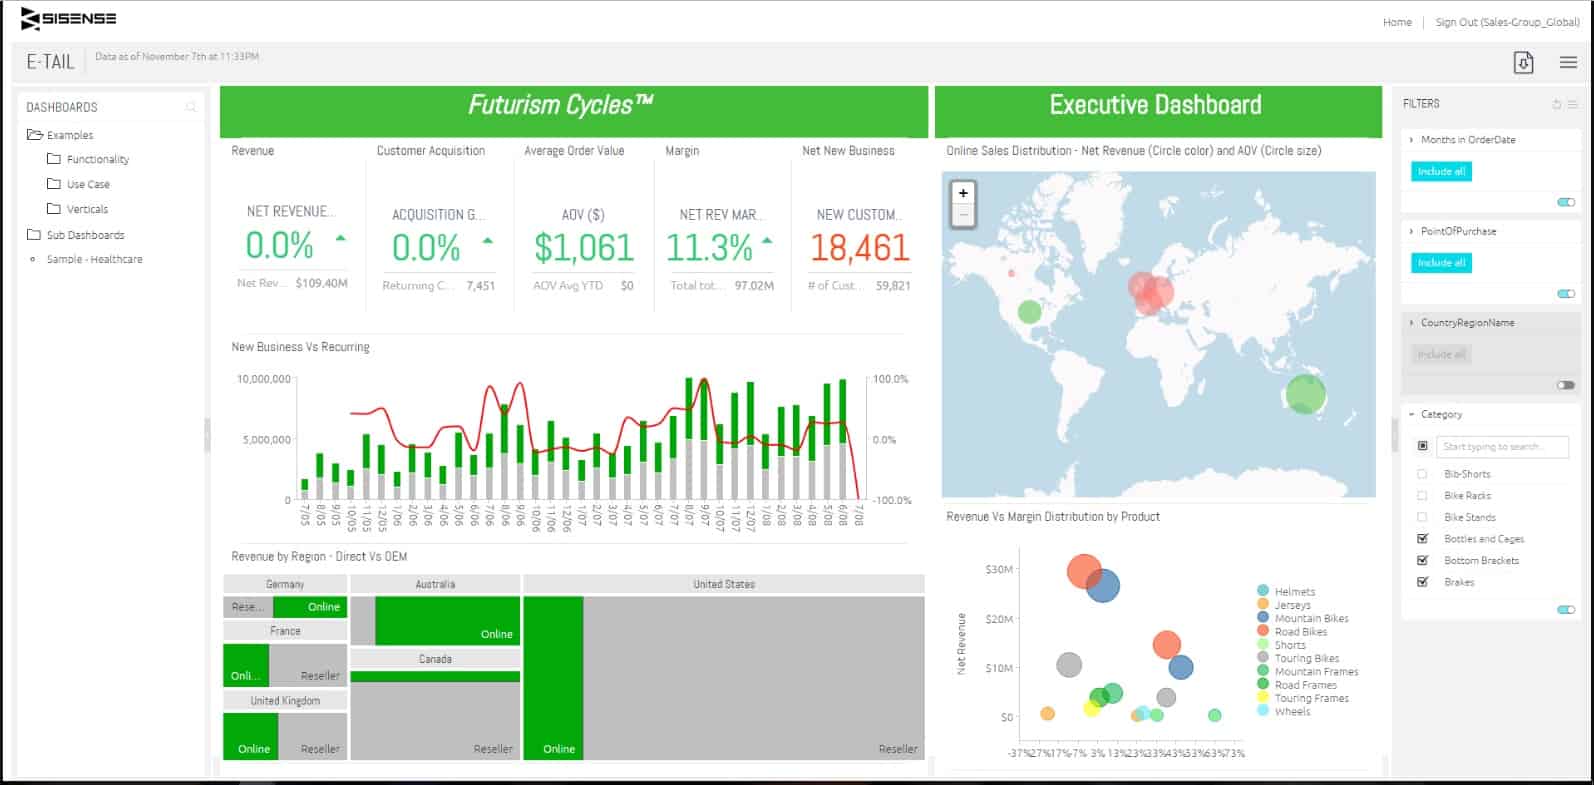
- Sisense: Designed for emerging startups to established enterprises, this BI reporting software allows users to transform data into dashboards and create PDF reports by connecting to relevant databases or apps, and can also mash-up multiple data sources.
Make Better Decisions, Faster with Smartsheet Dashboards
Empower your people to go above and beyond with a flexible platform designed to match the needs of your team — and adapt as those needs change.
The Smartsheet platform makes it easy to plan, capture, manage, and report on work from anywhere, helping your team be more effective and get more done. Report on key metrics and get real-time visibility into work as it happens with roll-up reports, dashboards, and automated workflows built to keep your team connected and informed.
When teams have clarity into the work getting done, there’s no telling how much more they can accomplish in the same amount of time. Try Smartsheet for free, today.


