What Is a Jira Dashboard?
A Jira dashboard is the main display you see when you open Jira. A dashboard shows apps and gadgets that provide different types of information to aid you and your team members as you organize and track a project’s development. Jira dashboards with the right gadgets can relay pertinent information at a glance — no need to pick through the backlog or generate individual reports.
A virtual display of project progress and risks is essential for some team members. For remote teams, a dashboard can keep everyone informed of positive and negative developments. For co-located teams, dashboards can open up communication with people who forget to report their progress or don’t attend the daily standup.
What Are Popular Jira Gadgets?
Gadgets fuel the power of Jira Agile dashboards. A gadget is a small application that displays an overview of data in one or more projects or through custom filters. Jira includes a few built-in gadgets, but you can download dozens of other options when you set up your dashboard. In addition, third-party gadgets with more functionality are available at the Atlassian Marketplace.
Before you fill a dashboard with gadgets, consider what information you and your team need to track. Jira practitioners suggest starting with as few as three gadgets and no more than six. Whatever information you want to follow, there’s probably a gadget for it. Experiment, and see what gadgets work best for your own dashboard and your team dashboards. These are some of the popular gadgets for Jira:
-
Assigned to Me Gadget: The Assigned to Me gadget works well for personal dashboards. It lists to-do and in-progress issues for all projects allocated to the signed-in viewer of the dashboard.
-
Calendar Gadget: This gadget uses a calendar format to display issues and versions according to their due date.
-
Created vs. Resolved Gadget: The Created vs. Resolved gadget tracks how well the team is keeping up with work items. The later the sprint, the fewer the issues that should be logged. The Created vs. Resolved gadget is a good choice for Kanban teams.
-
Issues in Progress Gadget: A potential companion to the Assigned to Me gadget, the Issues in Progress gadget displays only the issues that have the in-progress status and that are assigned to the signed-in viewer of the dashboard.
-
Jira Road Map Gadget: The road map gadget shows what’s been done in a sprint and what versions are due to be released.
-
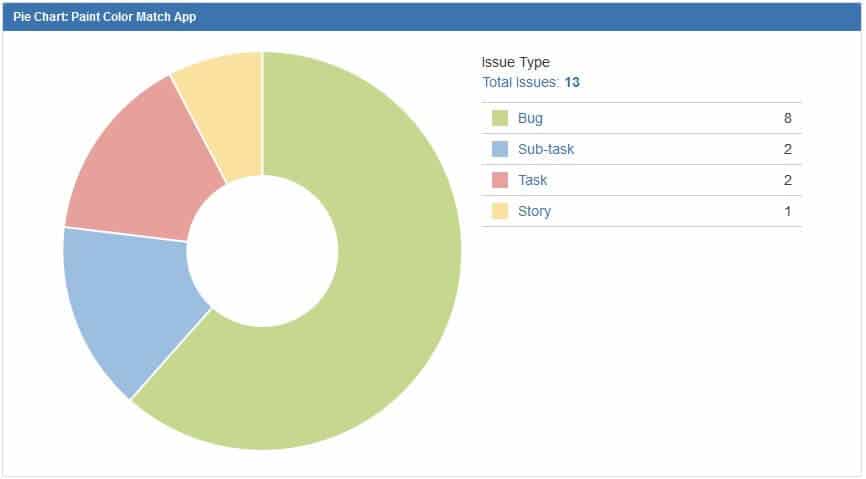
Pie Chart Gadget: A good choice for wallboards, the Pie Chart gadget shows statistics for issues, assignees, or other fields and attributes. Mouse over each piece of the pie to see specific statistics. Click on a piece of the pie in a dashboard to see a link to those issues. Click on a pie piece in a wallboard to go to that selection of issues.
-
Sprint Burndown Gadget: The Sprint Burndown gadget displays the sprint estimate in the vertical axis, along with other information for active sprints only. Useful for Scrum teams, this gadget works in wallboards.
-
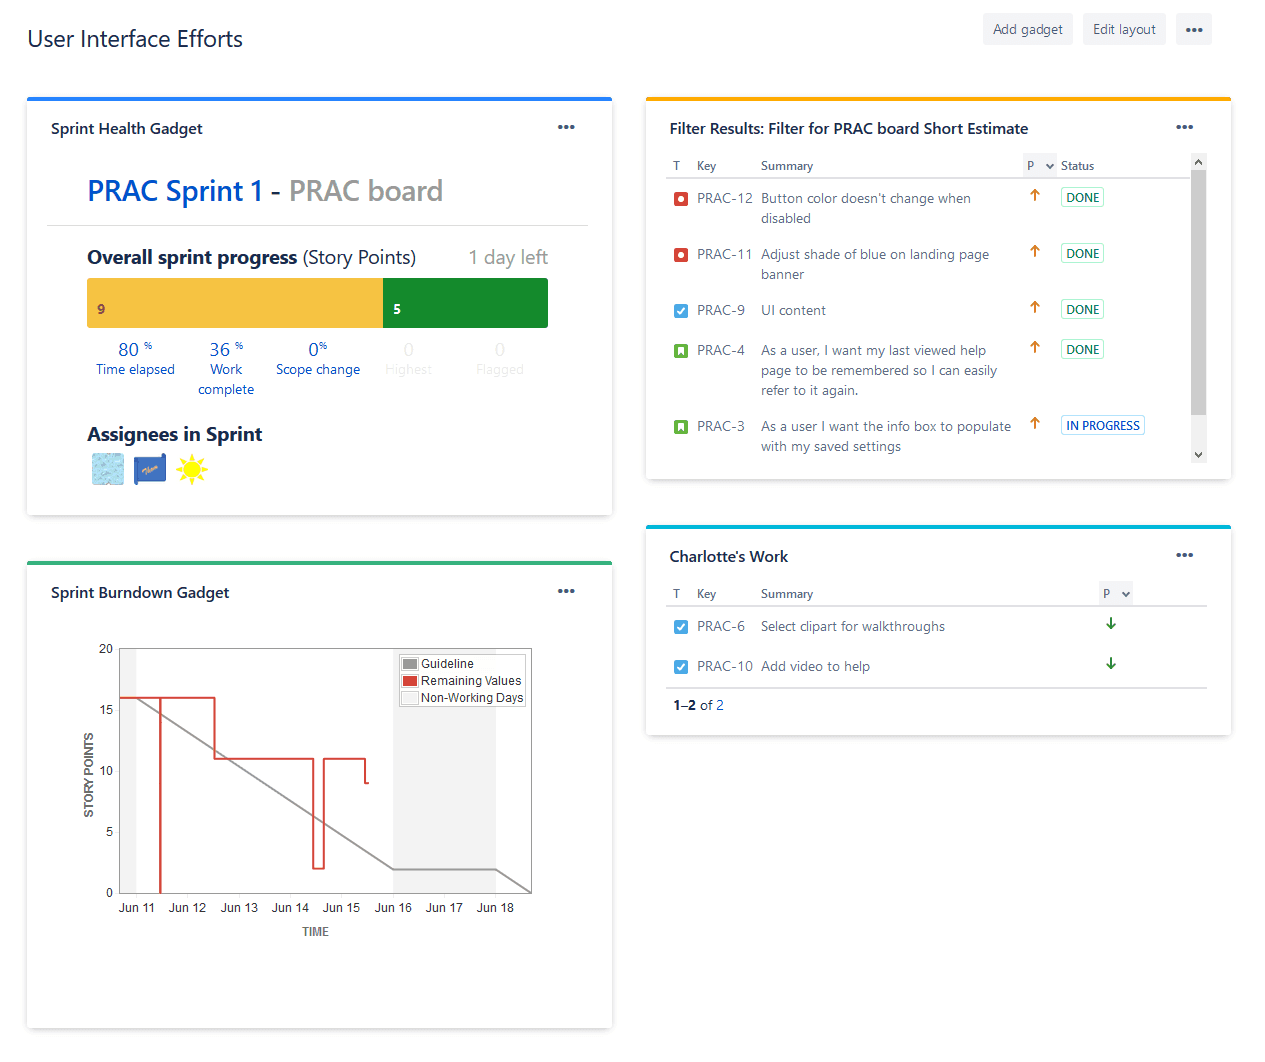
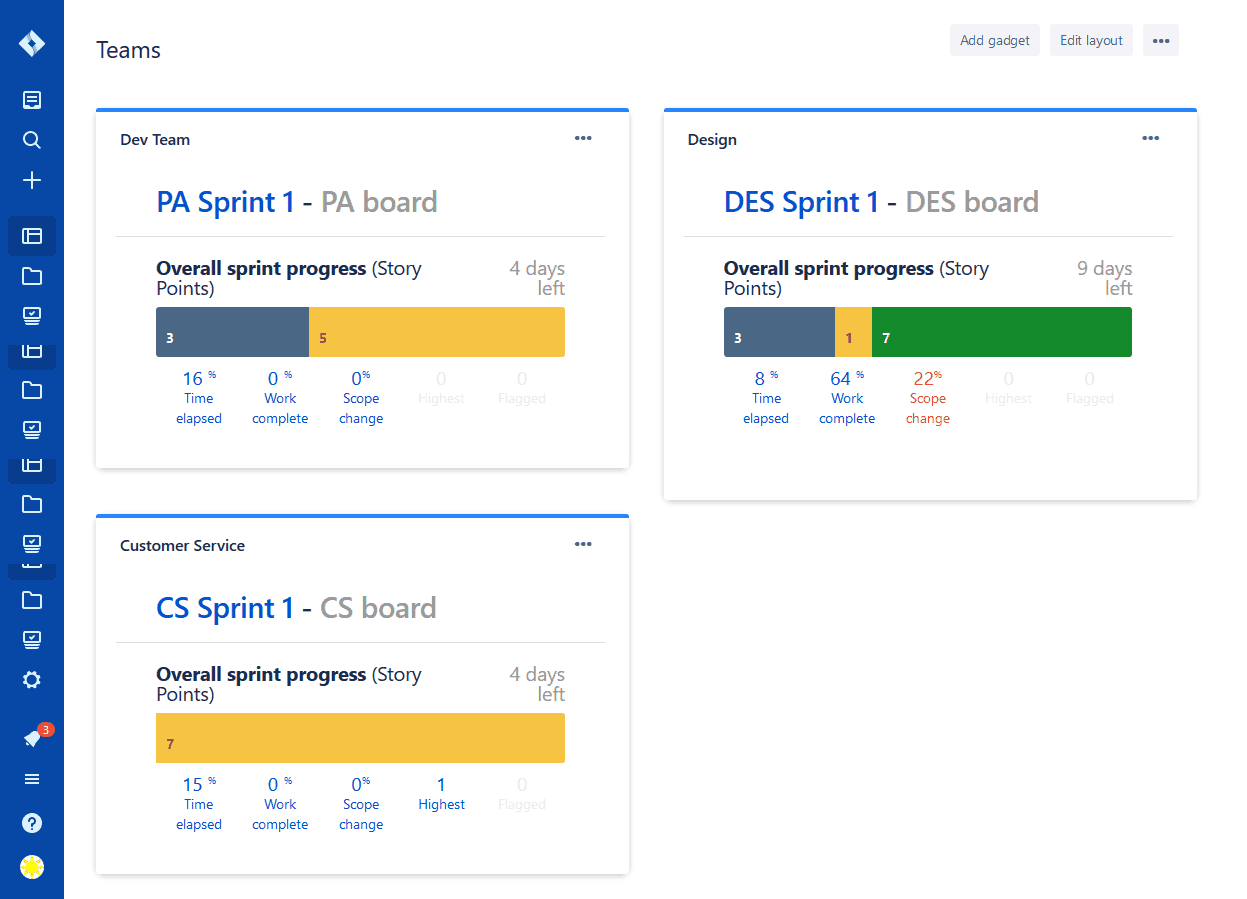
Sprint Health Gadget: Also useful for Scrum teams, the Sprint Health gadget displays progress in a color-coded bar based on the columns in your workflow or board. When work items are removed from an active sprint, they are noted as scope change.
Jira Dashboard Examples
Dashboards are flexible tools that you can share with specific groups or users in certain roles or by project. Depending on your needs, it’s possible to have the following in Jira:
-
One dashboard for one project
-
Multiple dashboards for one project
-
One dashboard for multiple projects
-
A private dashboard for each team member, with his or her own gadgets
Jira Gadgets for Sprint Health and Statistics
What better way to track the progress of a sprint and display resolution statistics than through gadgets? Try these in your dashboard:
-
Try the Sprint Health gadget to track the progress of issues assigned to each team member.
-
Choose the Filter Results gadget, then select the custom JQL filter sprint in (openSprints()) AND project in (PRAC) AND (Flagged is not EMPTY OR priority = Medium), which you can set to cover the range of sprints and issue priorities you want.
-
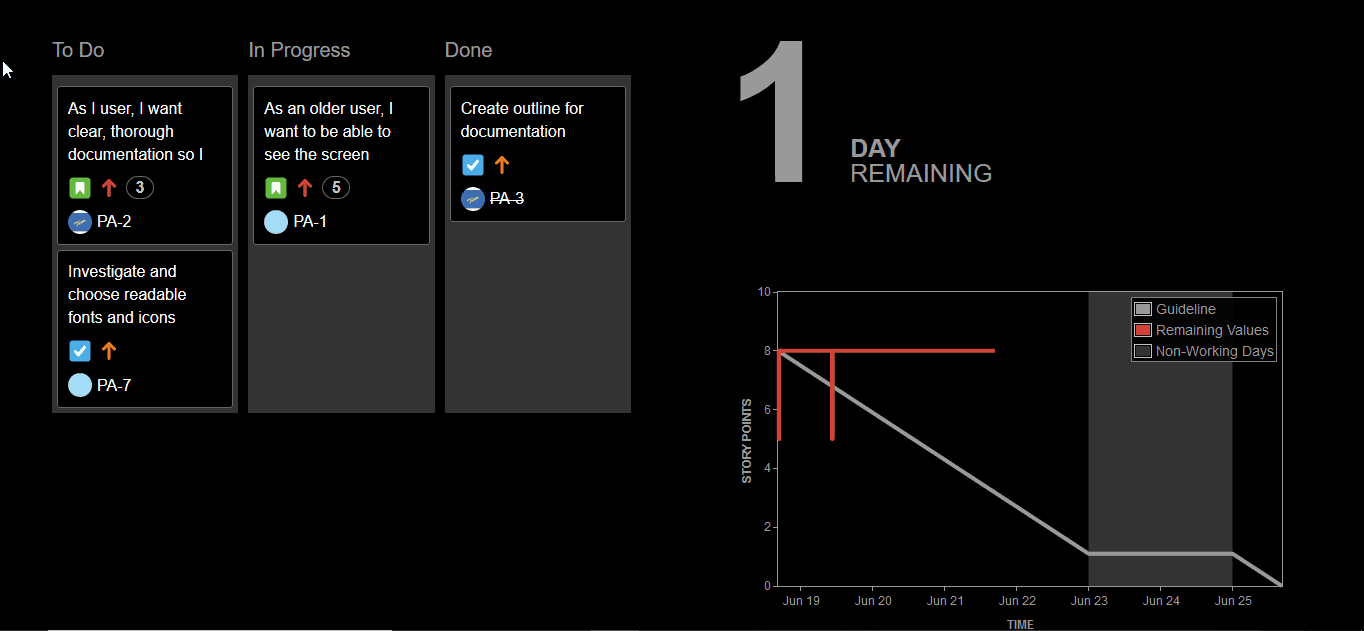
The Sprint Burndown gadget depicts team performance through the sprint. Set your estimation at the beginning of the sprint, which is tracked by the gray line. The red Remaining Values line tracks issues that were added and closed, and ideally it should fall below the Guideline. Jira automatically accounts for scheduled nonworking days with gray columns, and flat lines indicate time when no work is done on the sprint.
Jira Gadgets for Tracking Progress
A team dashboard must serve the interests of your team and pique their initiative. Some gadgets help gauge progress for a project.
-
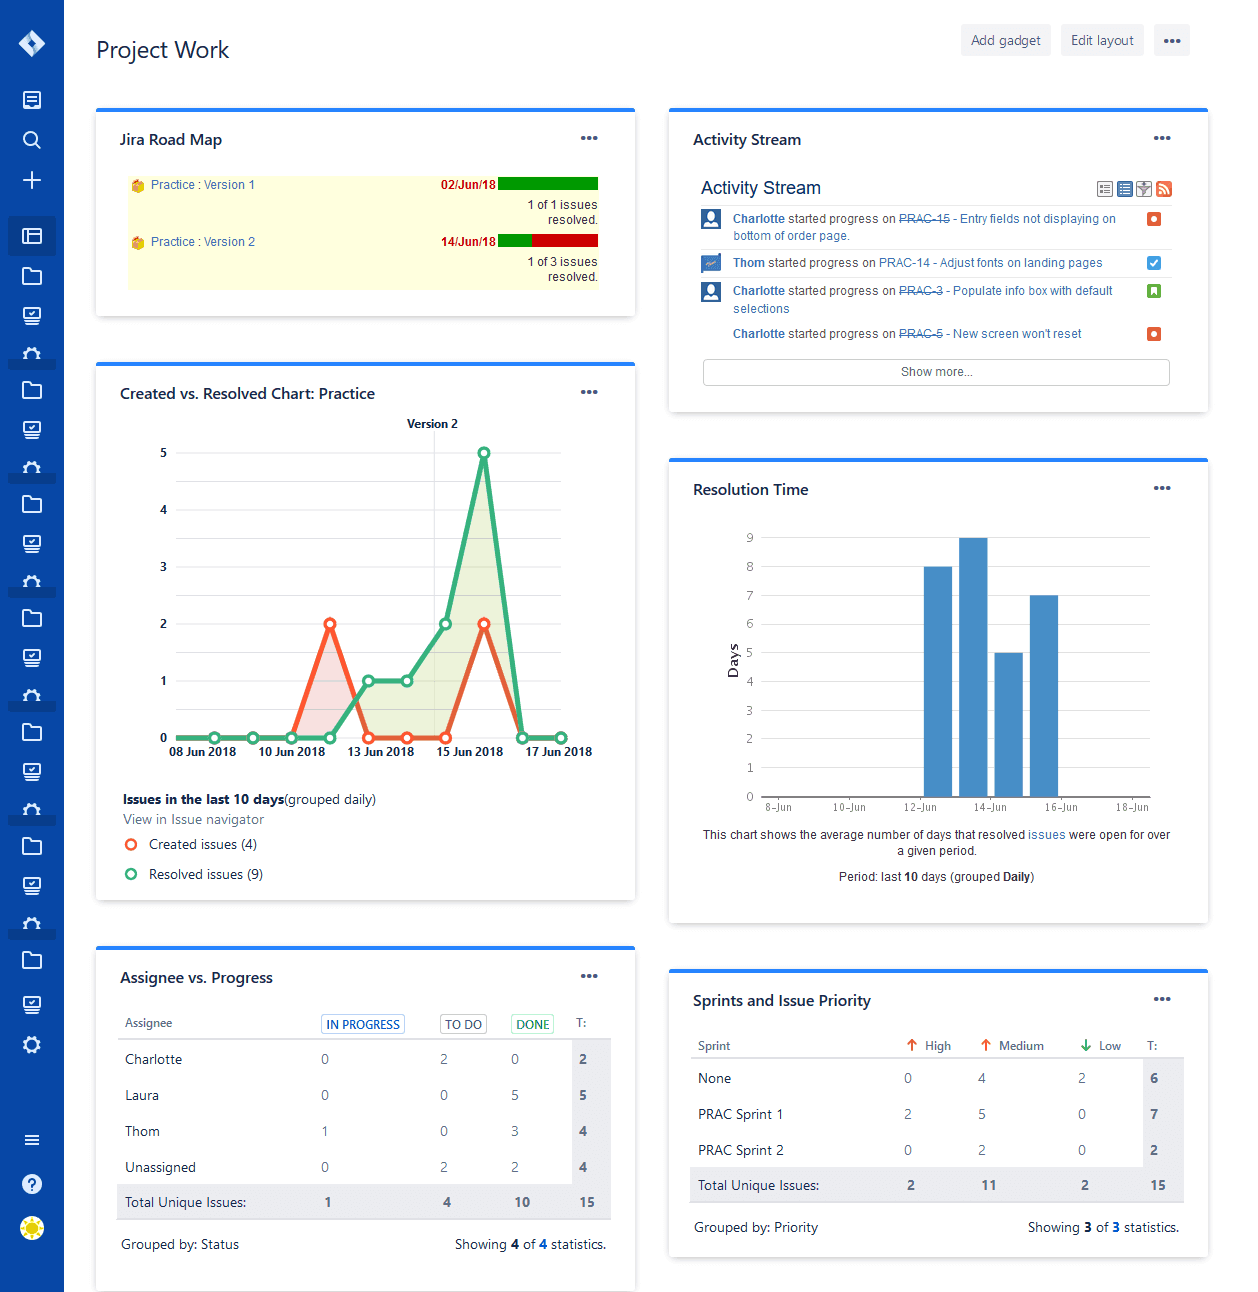
The Jira Road Map gadget clarifies progress toward milestones by displaying which versions are due and the progress on issue resolution for each version.
-
Customize the refresh period on the Activity Stream gadget to stay up-to-date with what’s happening in your project.
-
The Created vs. Resolved gadget displays the rate at which issues are logged and fixed. The fewer the issues logged and the higher the resolution count, the more stable the sprint and, thereby, the project.
-
The Resolution Time gadget shows the average time between an issue’s creation and resolution over the period you select.
-
With one or more copies of the Two Dimensional Filter Statistics gadget, you can track different metrics, such as bugs resolved by each team member or number of issues for each priority level for a sprint.
Jira Gadgets for Understanding Workload
When completing a sprint, you may face challenges that involve knowing exactly how much work each team member has and how quickly each is able to complete their tasks.
-
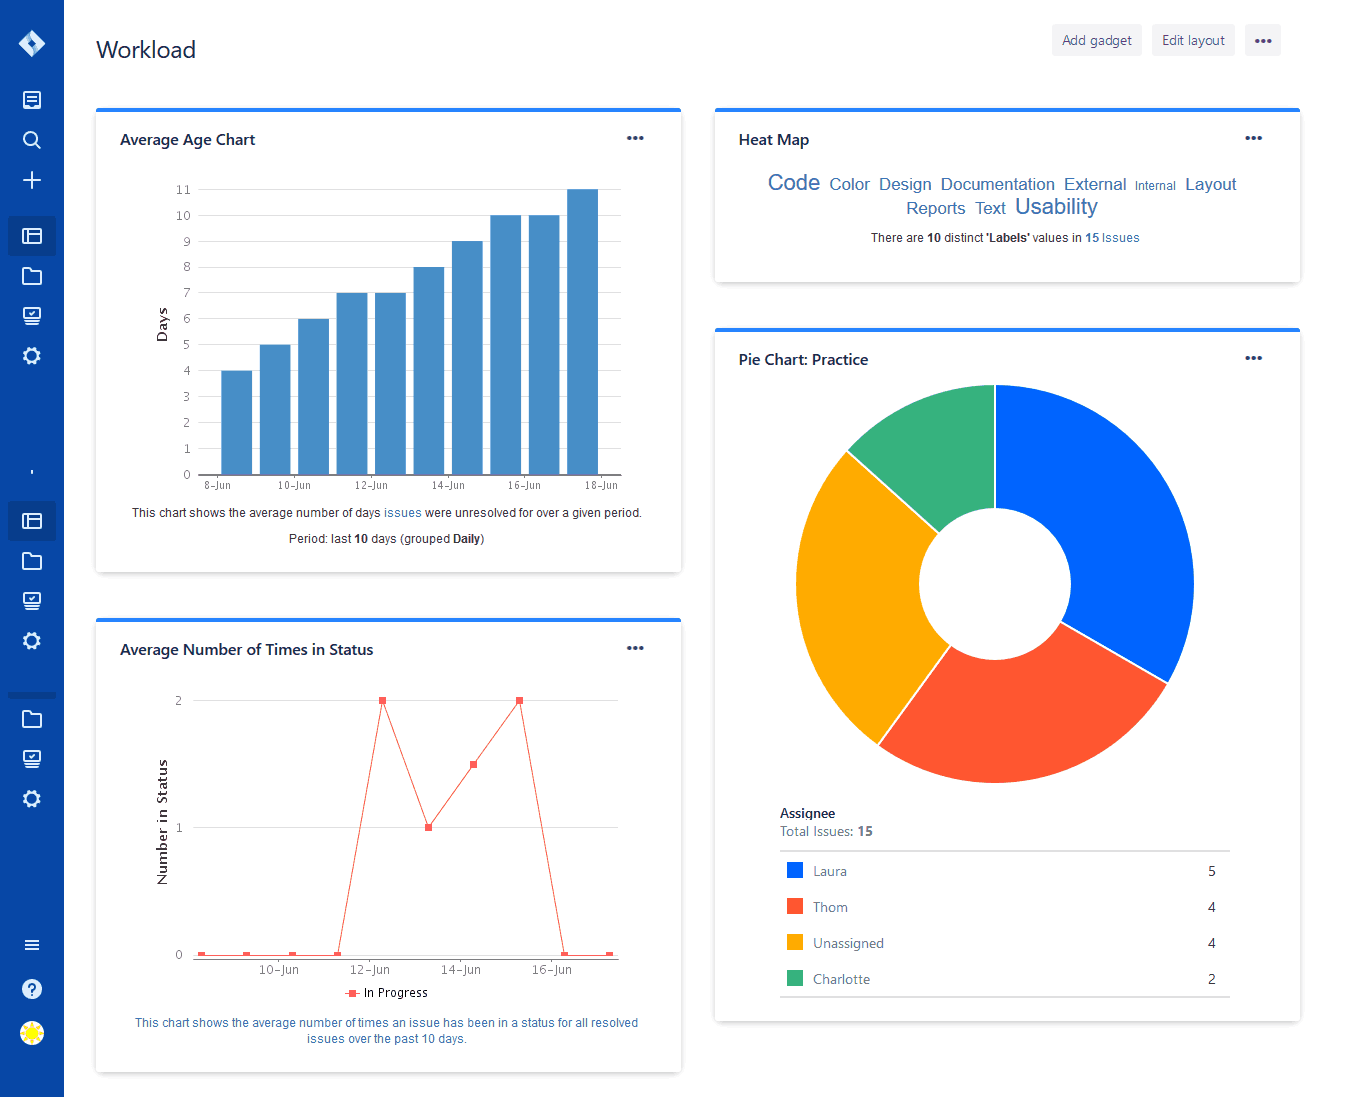
Gadgets like the Pie Chart and Average Age Chart expose this type of detail.
-
A Heat Map shows the frequency of the field of your choice, such as assignees, issue types, or labels.
-
The Average Number of Times in Status gadget shows the average number of days that issues spend in each state.
Jira Gadgets for Status and Watched Items
Jira is all about tracking work items and schedules, and many gadgets are available to help.
-
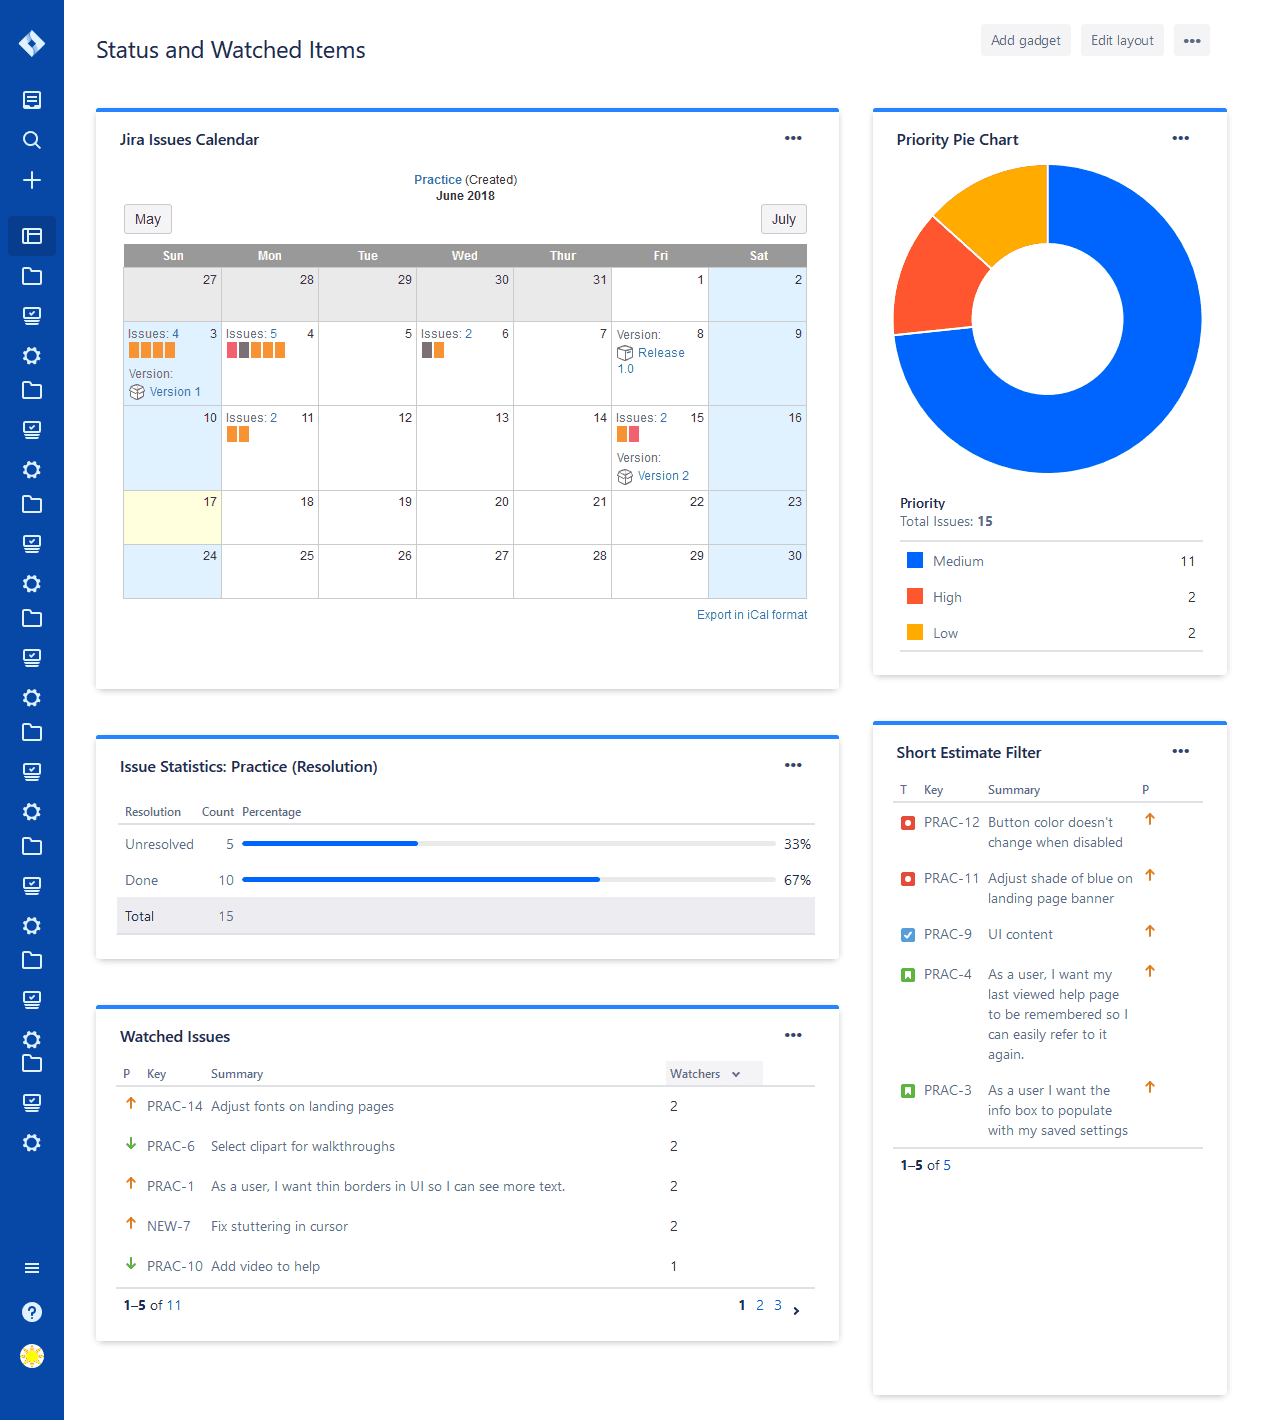
Jira includes a calendar gadget so you can see the context of due dates and when items are logged and fixed.
-
The Issue Statistics gadget helps surface bottlenecks, especially when Show Resolved Issue Statistics is set to No so that only unresolved items appear. Issue Statistics can also show workloads for each assignee.
-
With the Watched Items gadget, you can keep an eye on issues you want to track, including items assigned to others, and you can see how many people are watching the same items.
Jira Gadgets for Tracking Different Teams
Using several instances of the same gadget, you can track progress for different projects and teams, as shown here with the Sprint Health gadget.
A JIRA Dashboard for Every Team Member
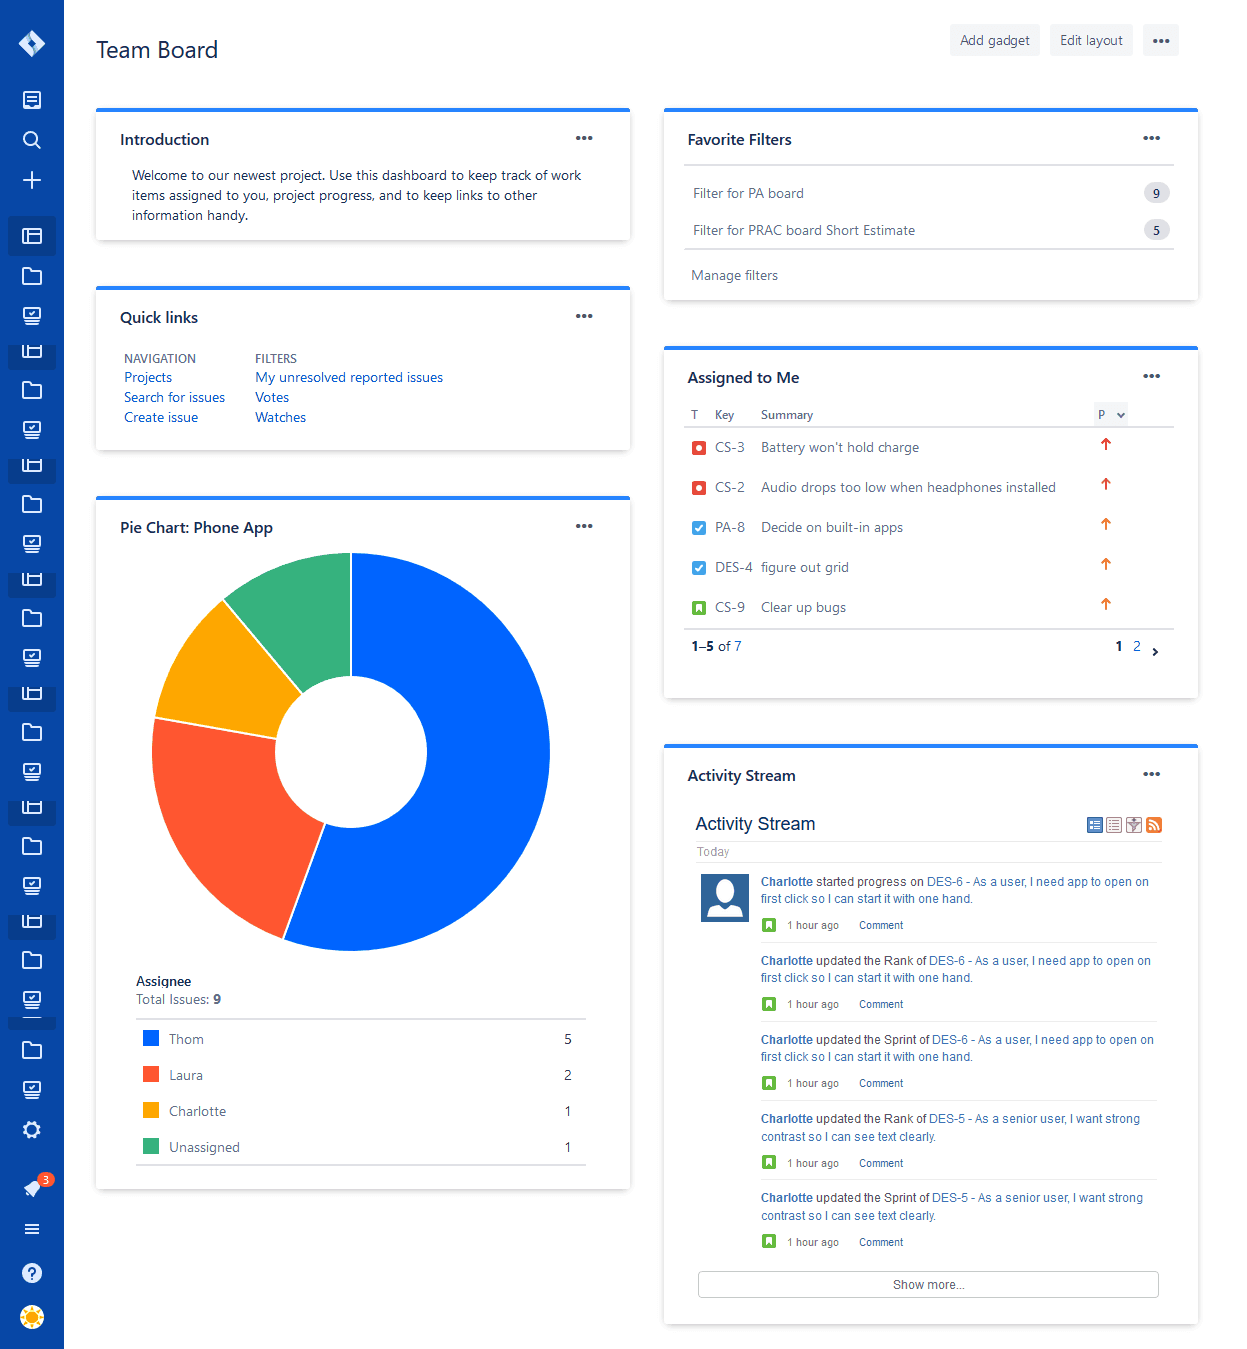
You can help your team keep track of sprint progress and offer easy access to everything they need in JIRA by designing a team board and sharing it with each member. This board includes the Introduction gadget, which by default includes a link to Jira documentation, but you can customize it with your own message. Here are more tips to get the most out of your dashboard:
-
Include the Assigned to Me and Activity Stream gadgets so that each person can track their efforts.
-
Provide easy access to Jira functionality with the Quick Links gadget.
-
Customize the Favorite Filters gadget by clicking Issues and Filters
in the left column, clicking View Filters at the bottom of the pane, and selecting the star next to the filter you want to mark as a favorite. -
Finally, add a gadget such as the Pie Chart to display project progress.
The Wonderful World of JIRA Wallboards
A wallboard is a device that allows you to display a Jira dashboard on a large screen. Some gadgets are uniquely suited to wallboards, such as the Agile Sprint Board gadget, Sprint Health gadget, Days Remaining gadget, and Pie Chart gadget. Try other gadgets to see which ones display your data well on a wallboard.
How to Create a Dashboard in Jira
The first time you log on, Jira displays a default system dashboard, usually containing the Assigned to Me gadget. As an administrator, you can configure this default dashboard. All the gadgets contained in it will be visible to users who have permission to see them. Users can then create personal dashboards.
For this tutorial, we will use Jira Cloud.
-
In Jira, on the Dashboards menu, click either View All Dashboards or View System Dashboards.
-
On the upper-right corner of the screen, click the ellipses
or the Create dashboard button. -
On the Create dashboard page, type a name for your dashboard. Use a descriptive title so that other users can clearly identify its purpose.
-
Add a description of the dashboard (if you want).
-
In the Start from box, select whether to start with default gadgets or a blank dashboard that you can customize.
-
Select whether this dashboard is a favorite. A favorite will show up at the top of your dashboards list.
-
Click Add. The new dashboard appears under Favorite Dashboards. Now you’re ready to add gadgets.
How to Share and Add a Dashboard to a Jira Project
At any time, you can add a dashboard to one or more projects, share or hide it from different users or projects, or share it with individual users or groups.
-
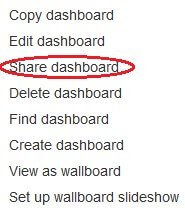
Click the ellipses, and click Share dashboard.
-
To select who can see the dashboard, do the following:
- To share with a group, in the Share box,
click Group. Select a group. Click Add.
- To share with any user, in the Share box, click Any logged-in user. Click Add.
- To share with anyone (whether they log into Jira or not), click Public in the Share box. Click Add.
-
To add the dashboard to a project, in the Share box, click Project. Select who can see it, and click Add. Note: If you want to add the dashboard to multiple projects, you’ll need to do so for each project. Your shares will appear like this:
- Click Update.
How to Manage Shared Jira Dashboards
An administrator can change ownership of another user’s dashboards — for example, when a person leaves the team and a new member fills their position.
-
On the right side, click the gear icon
, and then click System. -
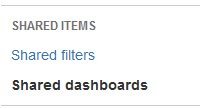
In the left column, scroll down to Shared Items. Click Shared dashboards.
-
Find the dashboard you want to transfer, and click the ellipses
. -
Type in the name of the new owner. Click Change owner.
-
If you work with many dashboards, locate the one you want by searching for it by name or by dashboard owner.
Design and Manage Your Jira Dashboard Layout
Now that you have a Jira dashboard, you can customize it by choosing the layout and adding gadgets.
-
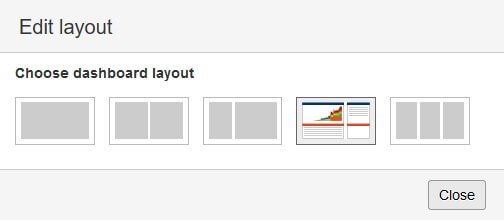
Click the Edit layout
button. Jira provides five options for columns, with one, two, and three columns, as well as wide column options. Choose a layout. Click Close.
-
Click Add a gadget to see a list of what’s available. Select the gadgets you want, and click Add gadget.
Copy a Jira Dashboard
You can also copy a dashboard that you created or that is shared with you. The copy will have the same gadgets and layout as the original.
-
In a Jira dashboard, click the ellipses, and then click Copy dashboard.
-
Name the new dashboard, and add a description (if you want).
-
Select the dashboard you want to copy.
-
Click Create.
Search for a Jira Dashboard
If your team has been creating a lot of dashboards for a long time, you may lose track of good dashboards. To locate an existing dashboard, search for it by name or by owner.
-
In a Jira dashboard, click the ellipses, and click Find dashboard.
-
Type the first few letters of the dashboard or owner’s name. A list of suggestions for each will appear. Click Search.
Delete a Dashboard
-
Open the dashboard you want to delete.
-
Click the ellipses, and click Delete dashboard.
-
Confirm that you want to delete the dashboard.
How to Customize Jira Dashboard Gadgets
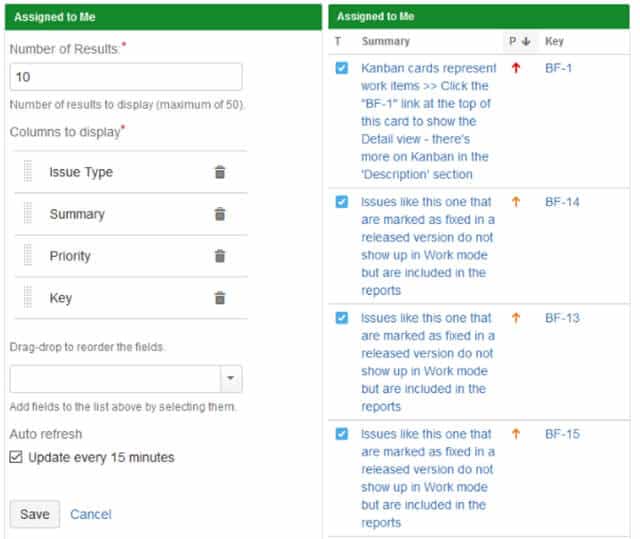
Settings are specific to each available gadget, but you can customize the size and general style. The following images show a gadget’s editing page and its implementation.
At any time you can edit the settings of a gadget to change the information it gathers and displays and how often it updates. Keep in mind that settings are not the same across all gadgets.
Edit Gadget Settings
-
In the gadget, click the ellipses, and then click Edit.
Change the Look of a Gadget
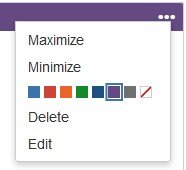
- Hover over the gadget until the ellipses appear. Click the ellipses. On the menu, click Minimize, Maximize, or Restore.
-
To change the color of the gadget or to remove color, select an icon from the palette.
Use Wallboards to Share Information in Jira
A wallboard is a visual tool you can use to project dashboards and gadgets onto a big screen. To access the wallboard feature, plug your device into a TV monitor or other large screen. To display one gadget, click the ellipses, and then click View as wallboard.
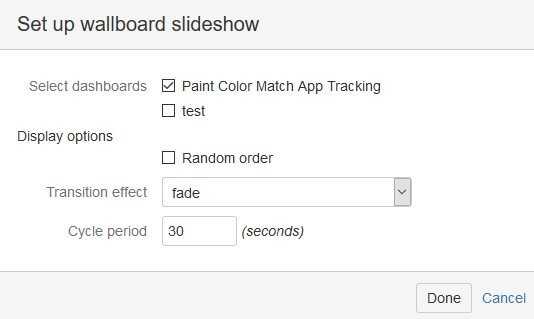
You can create a slideshow to display multiple gadgets in rotation.
-
Click the ellipses, and then click Set up wallboard slideshow.
-
Select one or more dashboards to display.
-
Check the box if you want to display gadgets in random order.
-
Set the type of transition.
-
Set the display time for each gadget.
-
Click Done.
-
Click the ellipses. Click View wallboard slideshow.
Jira Dashboard Best Practices from the Experts
The more you work with Jira dashboards, the better you’ll understand how to optimize them. One tip to keep in mind: Tracking too much information can be counterproductive. Start with a few crucial measures and add gadgets as the need arises. Some users suggest trying fewer than six gadgets to start.
O’Laughlin suggests these tips for setting up dashboards:
-
Know what you’re tracking, then create dashboards tied to personal, team, and organizational goals.
-
Apply the Goldilocks principle and start with three to five metrics to see what gives you the most return.
-
Tailor dashboards to the needs of users; team members require a level of detail that C-suite stakeholders don’t.
Other Jira Dashboard Gadgets
Additional functionality is available through extension gadgets, which you can download as plugins from the Atlassian Marketplace. You can also create Jira gadgets.
-
Labels Gadget: Displays a list of all the labels used in a project.
-
Projects Gadget: Displays information and filters for a project.
-
Recently Created Issues Gadget: Displays a bar chart of newly created issues versus how many of those are resolved.
-
Time Since Chart Gadget: Displays a bar chart showing the number of issues that have changed since a given date based on the criteria you tselect.
-
Time to First Response: Displays the number of hours taken to respond to issues.
-
Version Report: Displays progress against the version release date.
-
Voted Gadget: Shows issues you have voted for.
Improve Project Transparency With Jira and Smartsheet
From simple task management and project planning to complex resource and portfolio management, Smartsheet helps you improve collaboration and increase work velocity -- empowering you to get more done.
The Smartsheet platform makes it easy to plan, capture, manage, and report on work from anywhere, helping your team be more effective and get more done. Report on key metrics and get real-time visibility into work as it happens with roll-up reports, dashboards, and automated workflows built to keep your team connected and informed.
When teams have clarity into the work getting done, there’s no telling how much more they can accomplish in the same amount of time. Try Smartsheet for free, today.
