If you’ve ever used dashboards in Smartsheet, you know how powerful they can be to keep executives and your teams informed with real-time data, and give them the information they need to quickly adjust to changing information. But when it comes to presenting in a meeting, are dashboards the most effective way to communicate and share information?
Since its creation more than 30 years ago, Microsoft PowerPoint has become the de facto presentation program, followed closely by Google Slides and Apple’s Keynote. We’ve come to appreciate these programs for their ease of use — allowing even the newest user to quickly pull together a presentation, complete with graphics and other visual elements. If you’re sharing static information — like a plan or material that’s not going to change — a presentation program like PowerPoint is an effective method to share the details.
However, if you’re responsible for presenting rapidly-changing information and updated metrics on a regular basis — either weekly updates or monthly reports — you’re probably all too familiar with the challenges of updating a presentation, especially when you’re relying on data from multiple sources. There are version control issues, inconsistently formatted figures or content, and your teams may struggle to slice and dice data correctly. Information can quickly become stale — and data entered into a presentation is often outdated as soon as it’s put into a deck.
Given these challenges, what should you do when you need to present these updates and information to the C-suite, or even to your team?
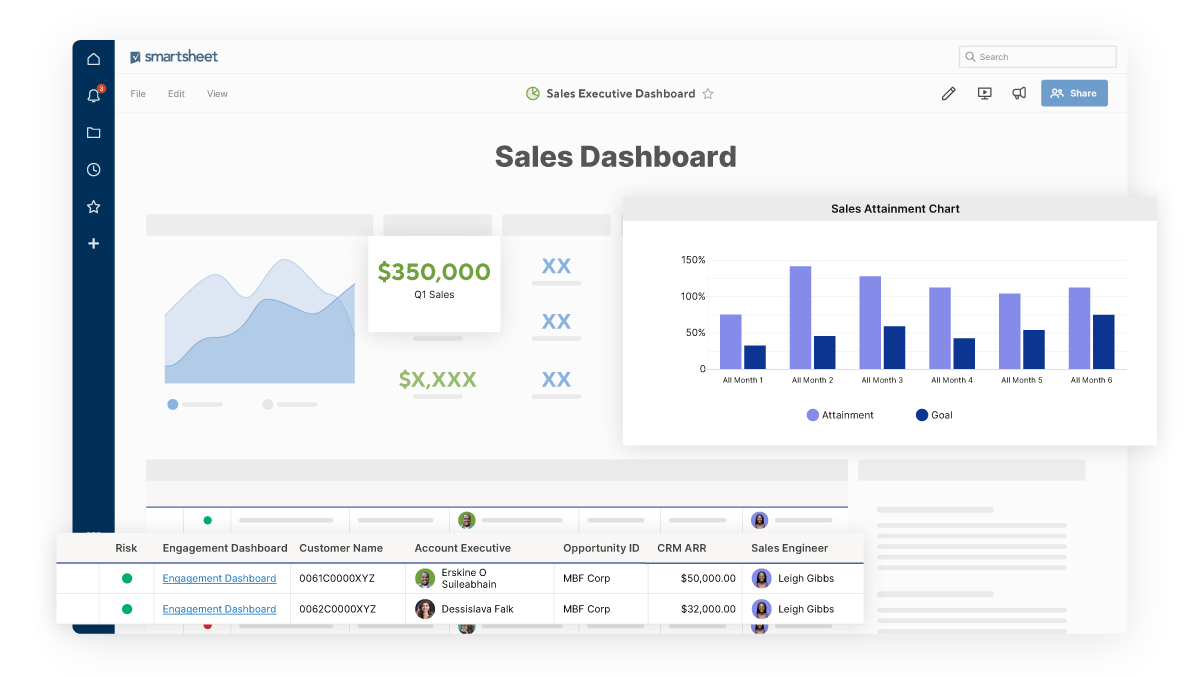
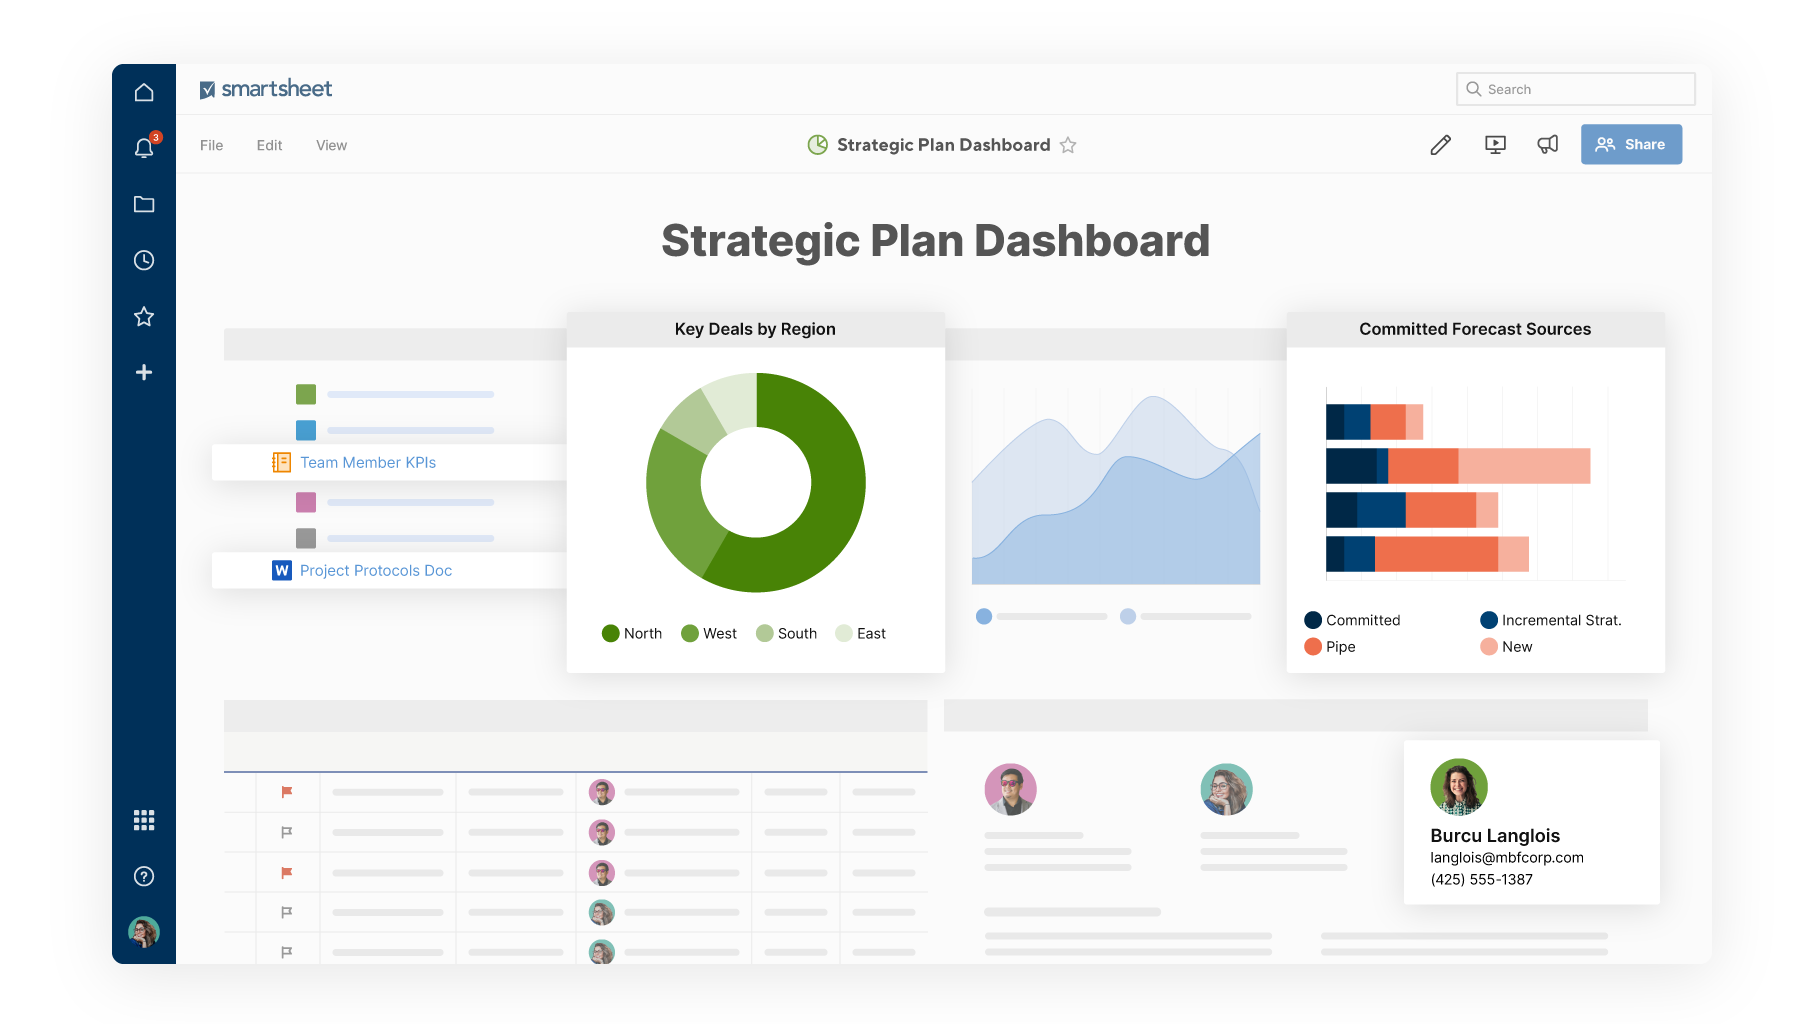
Use Smartsheet dashboards for real-time data
If you’re tasked with conducting weekly update meetings or state of the business meetings with executives, or presenting data to executive teams or other groups in your organization, providing accurate, real-time data is key to keeping them informed and allowing them to quickly respond to dynamic, shifting situations. The best way to do that is by leveraging Smartsheet dashboards.
The biggest lift to make this come to fruition will be the set up: that is, building out the dashboard to convey the necessary information, figuring out how to surface and visualize your data, developing charts, and organizing it all in a clear, concise, yet still visually-appealing way. But once that’s completed, your dashboard can serve as a key foundational element that will keep everyone informed — with minimal ongoing effort from you, especially if you’re showcasing data that’s already living in Smartsheet.
Take a hybrid approach to manage a single source of truth
If you have a suite of materials (e.g. PowerPoint decks with your annual plans, meeting notes, policy and procedure documents) and need to share real-time information and data (e.g. sales figures, stock performance) using both a presentation and a dashboard in meetings could be the custom-fit approach you need.
By embedding your presentation within your dashboard, you create a seamless experience for stakeholders by offering a one-stop-shop that keeps the information they need at their fingertips. Load up your dashboard, access your PowerPoint or Keynote presentation from there and present to your audience, then revisit the dashboard to showcase the latest data and figures.
For remote teams — which comprises many enterprise workers in the current climate of the COVID-19 pandemic — taking a hybrid approach and maintaining a single source of truth can be especially helpful. It gives teams one place to reference so everyone stays informed and can get the business updates they need to do their jobs.
How to decide which to use
When deliberating between Smartsheet dashboards and a presentation program, determining which route to go will become clearer if you ask yourself one important question:
Does the data or information I need to present change on a regular or frequent basis?
If the answer is yes, you’re most likely best served by using a dashboard.
Are you looking to get launched with dashboards but don’t know where to start? Consider using our popular team portal template, which is a great starting point for day-to-day operations for a remote workforce. For more ideas, check out our suite of free templates in our template gallery.


