Article
Charting using Grouping and Summary

August 05, 2021
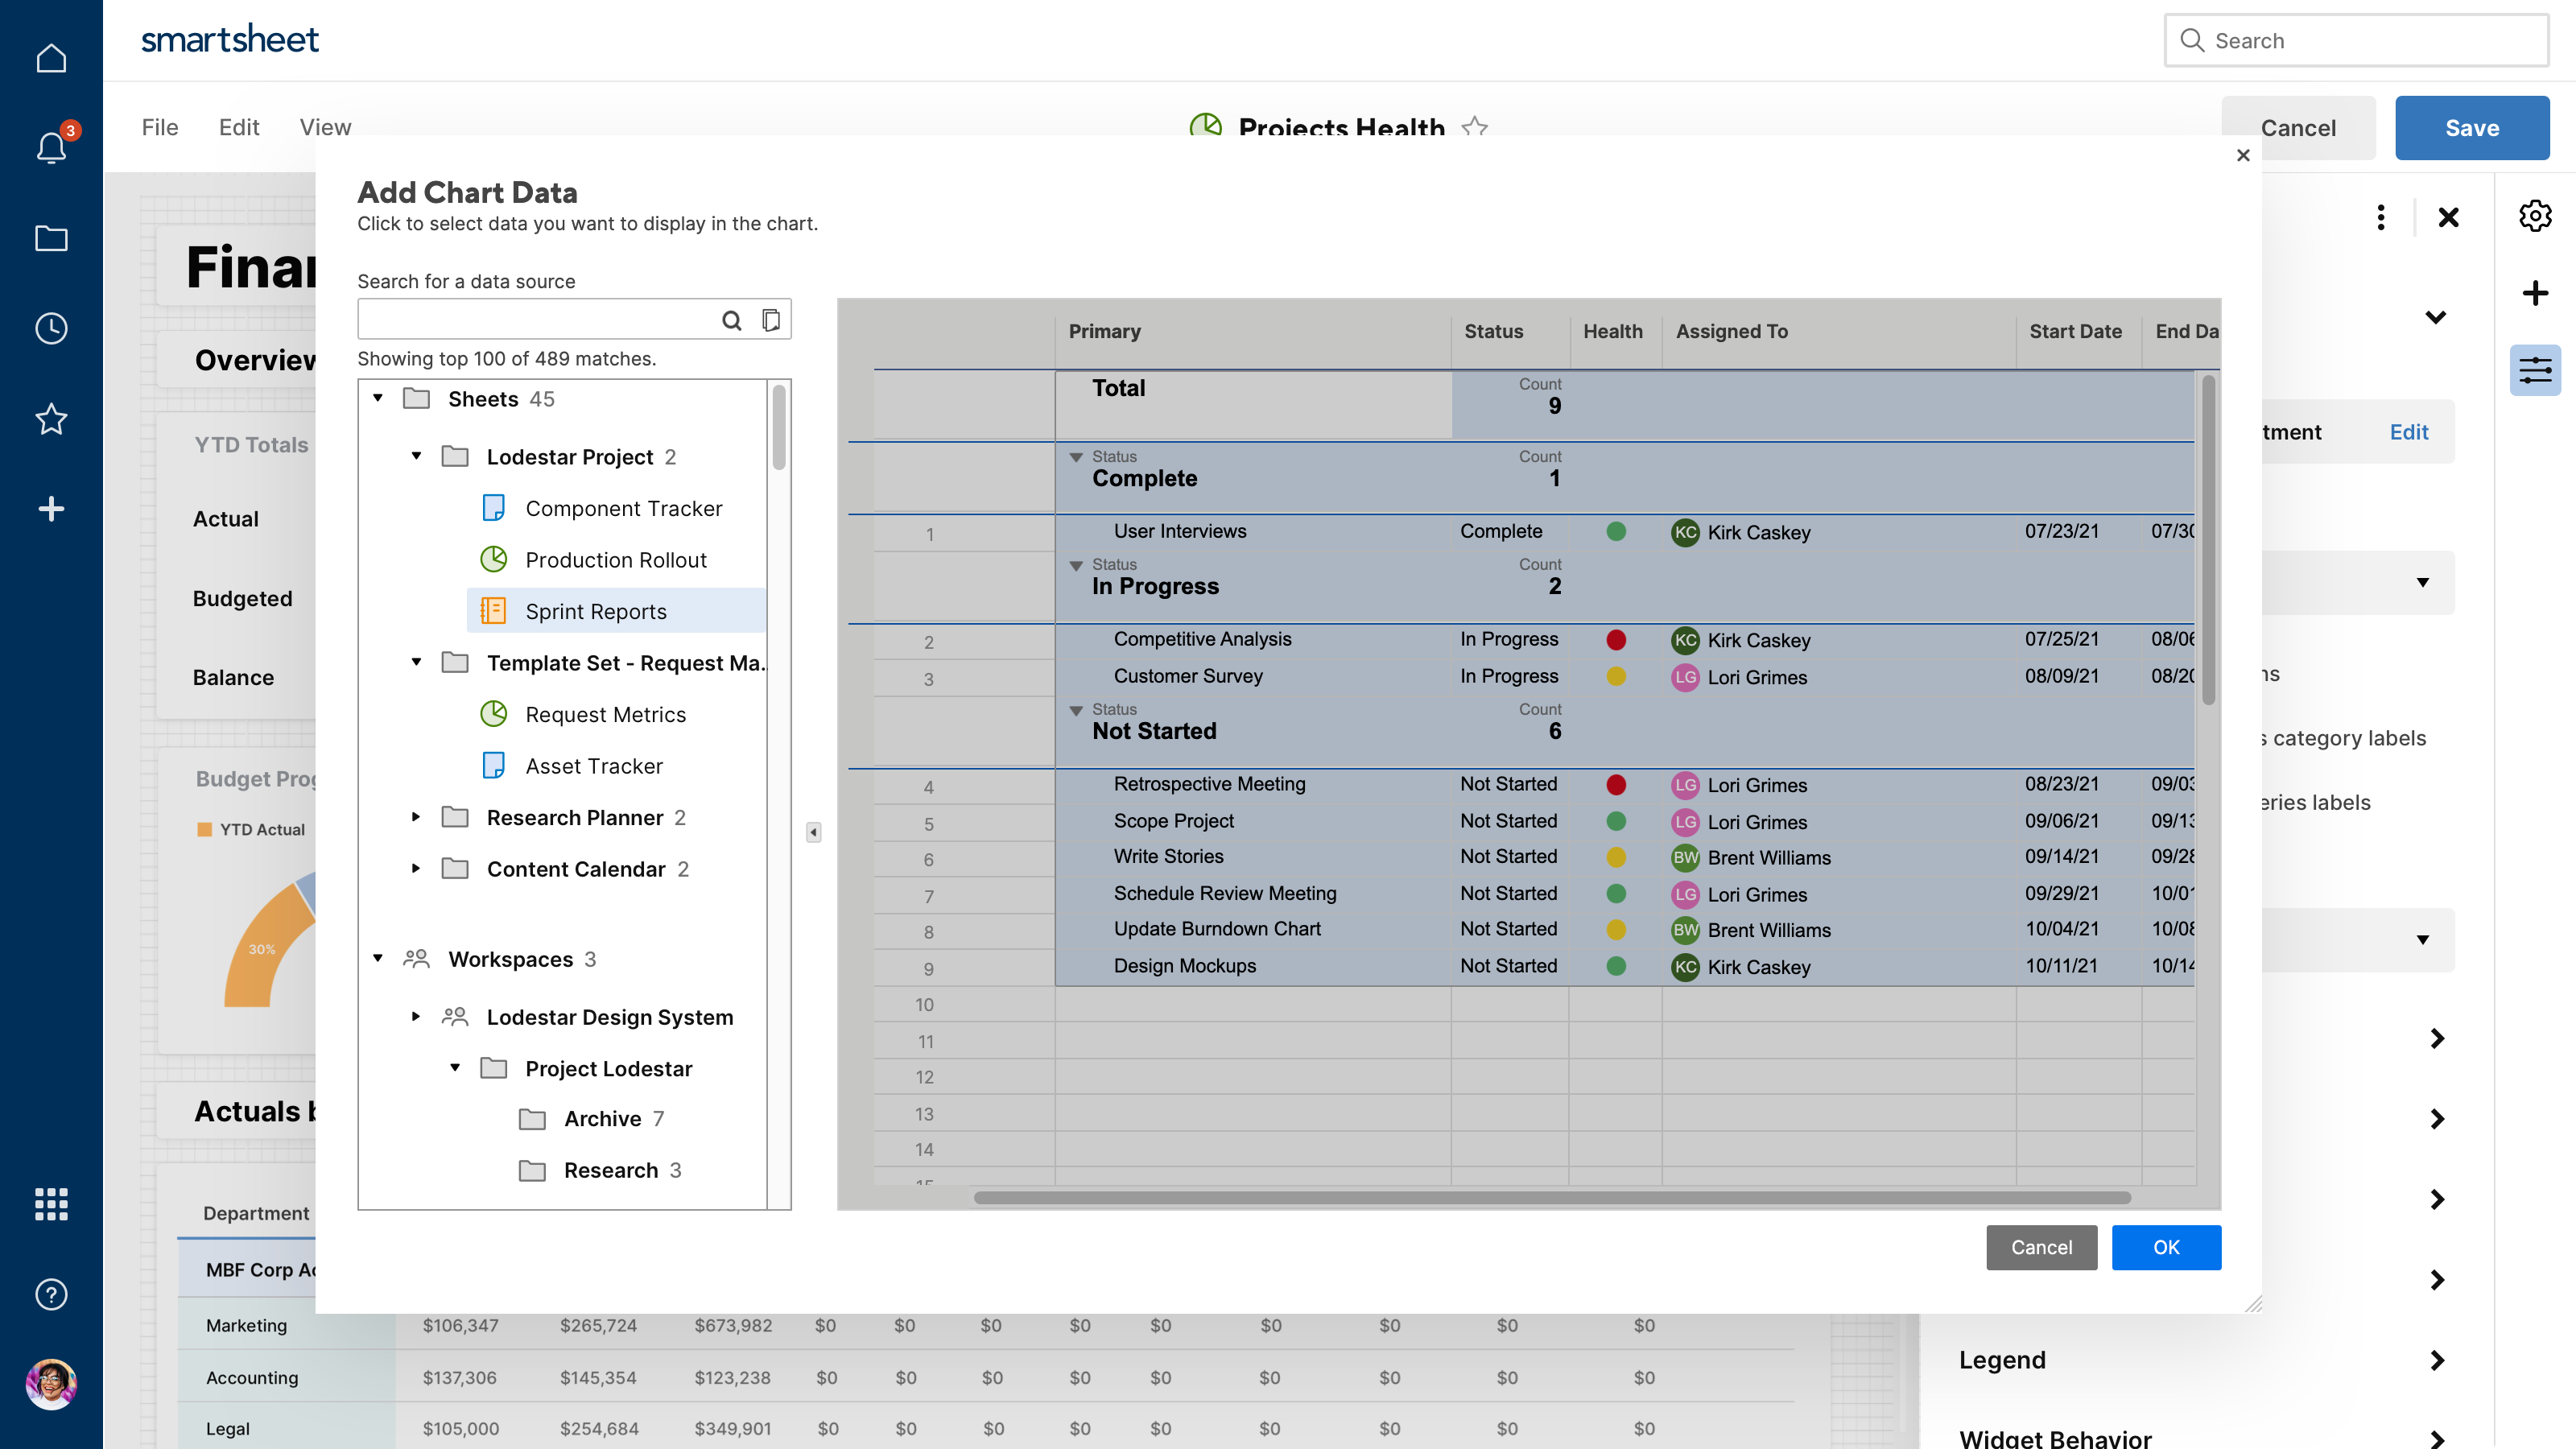
You can now create a chart from reports that have grouping and summary added. To do so, create a chart widget, select “Add Data”, and choose the report you’d like to use as the source for your chart.
Note: You will only be able to create a chart from the summary data that is in the first level of grouping on your report, the top group in your “Groups” dropdown. This update does not support charting from the second level or third level groups in your report and does not support charting from the “Total” group.
Check out our help content to learn more about charting in dashboards and grouping and summary in reports.