Article
Scatter Charts

August 25, 2021
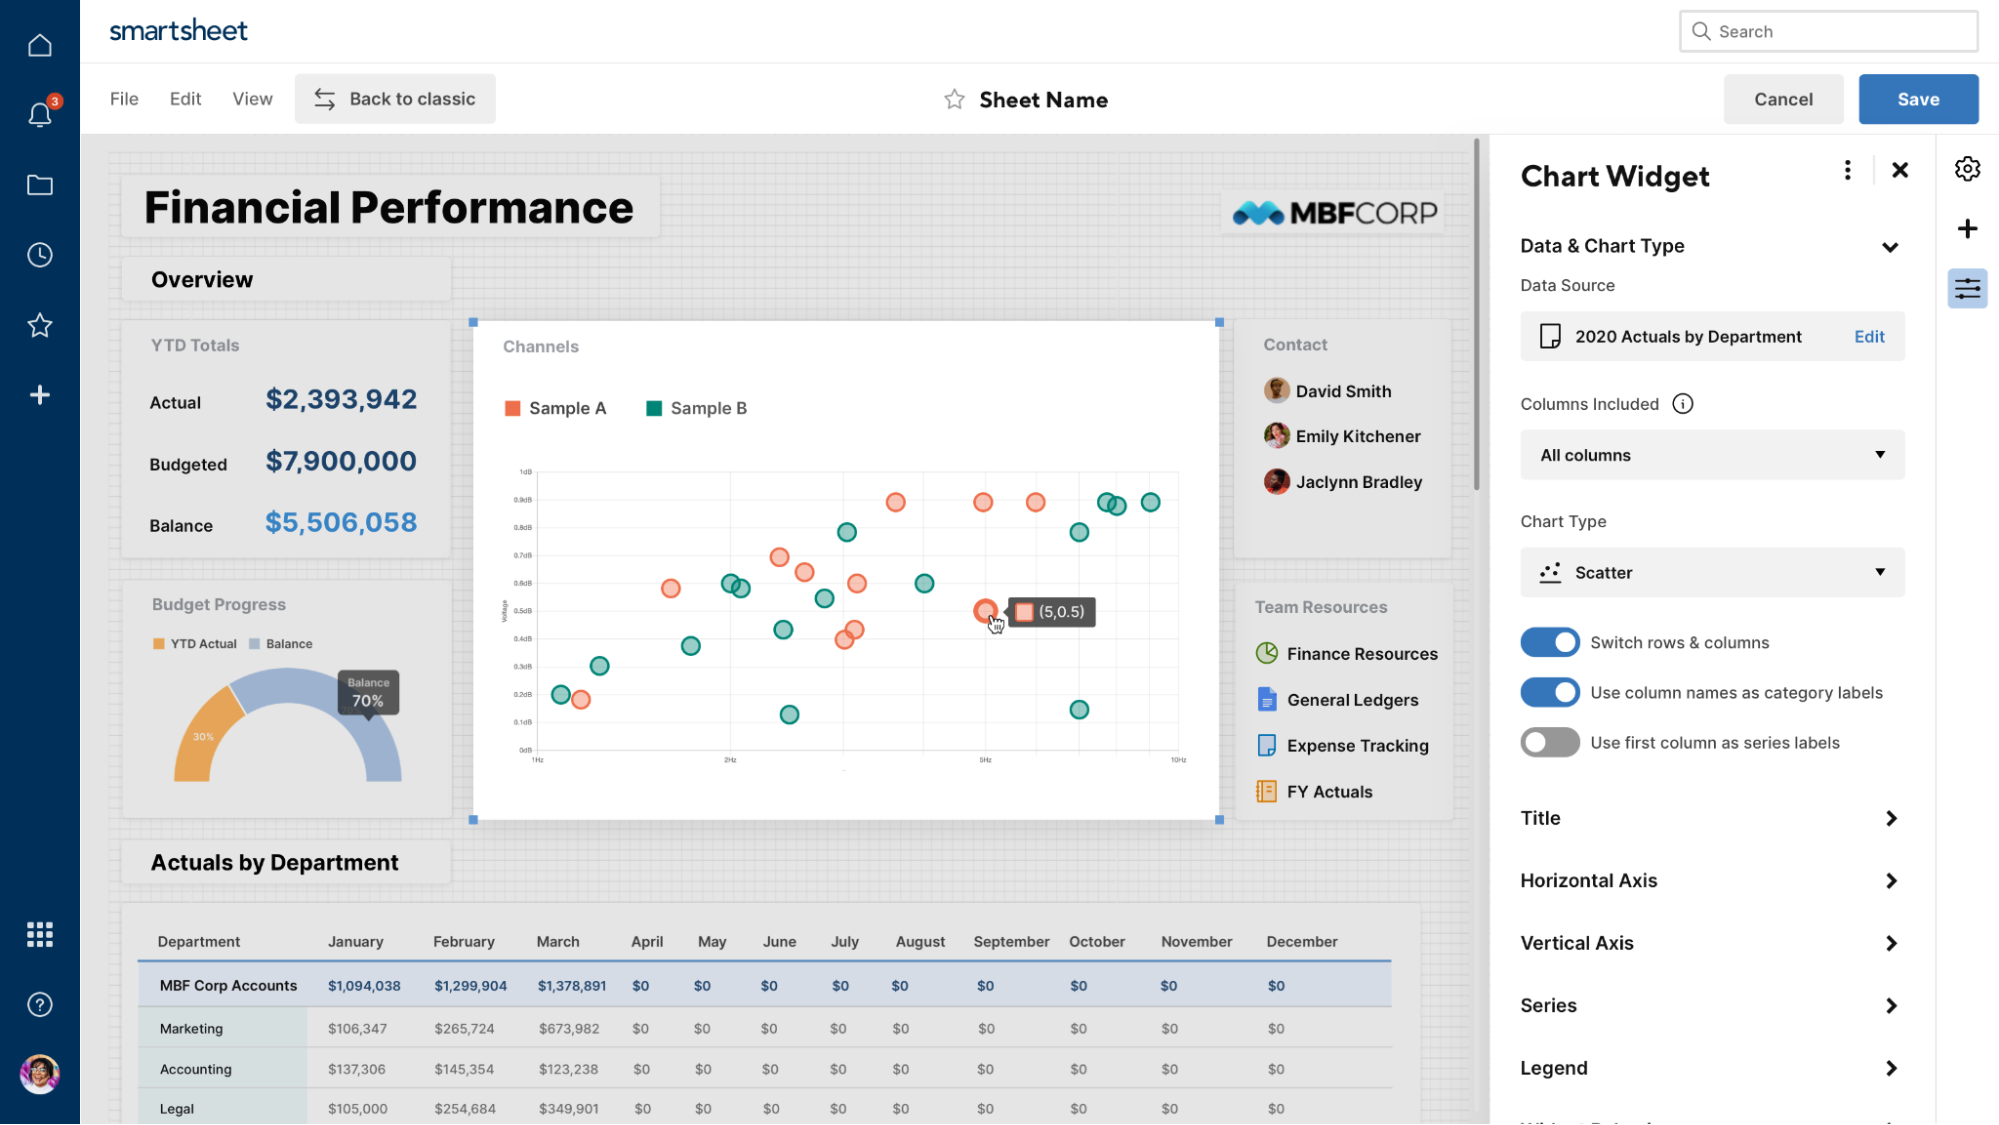
Now you can create a scatter chart using the data in a sheet or report. To begin, create a chart widget, select your data source by clicking Add Data and then change the chart type to Scatter.
We’ve also added an option to change the axis to be a ‘numeric axis’, so charts accurately reflect the position of data instead of evenly spacing data points by default.
To learn more about charting in dashboards, check out our help content.