Smartsheet for Tableau

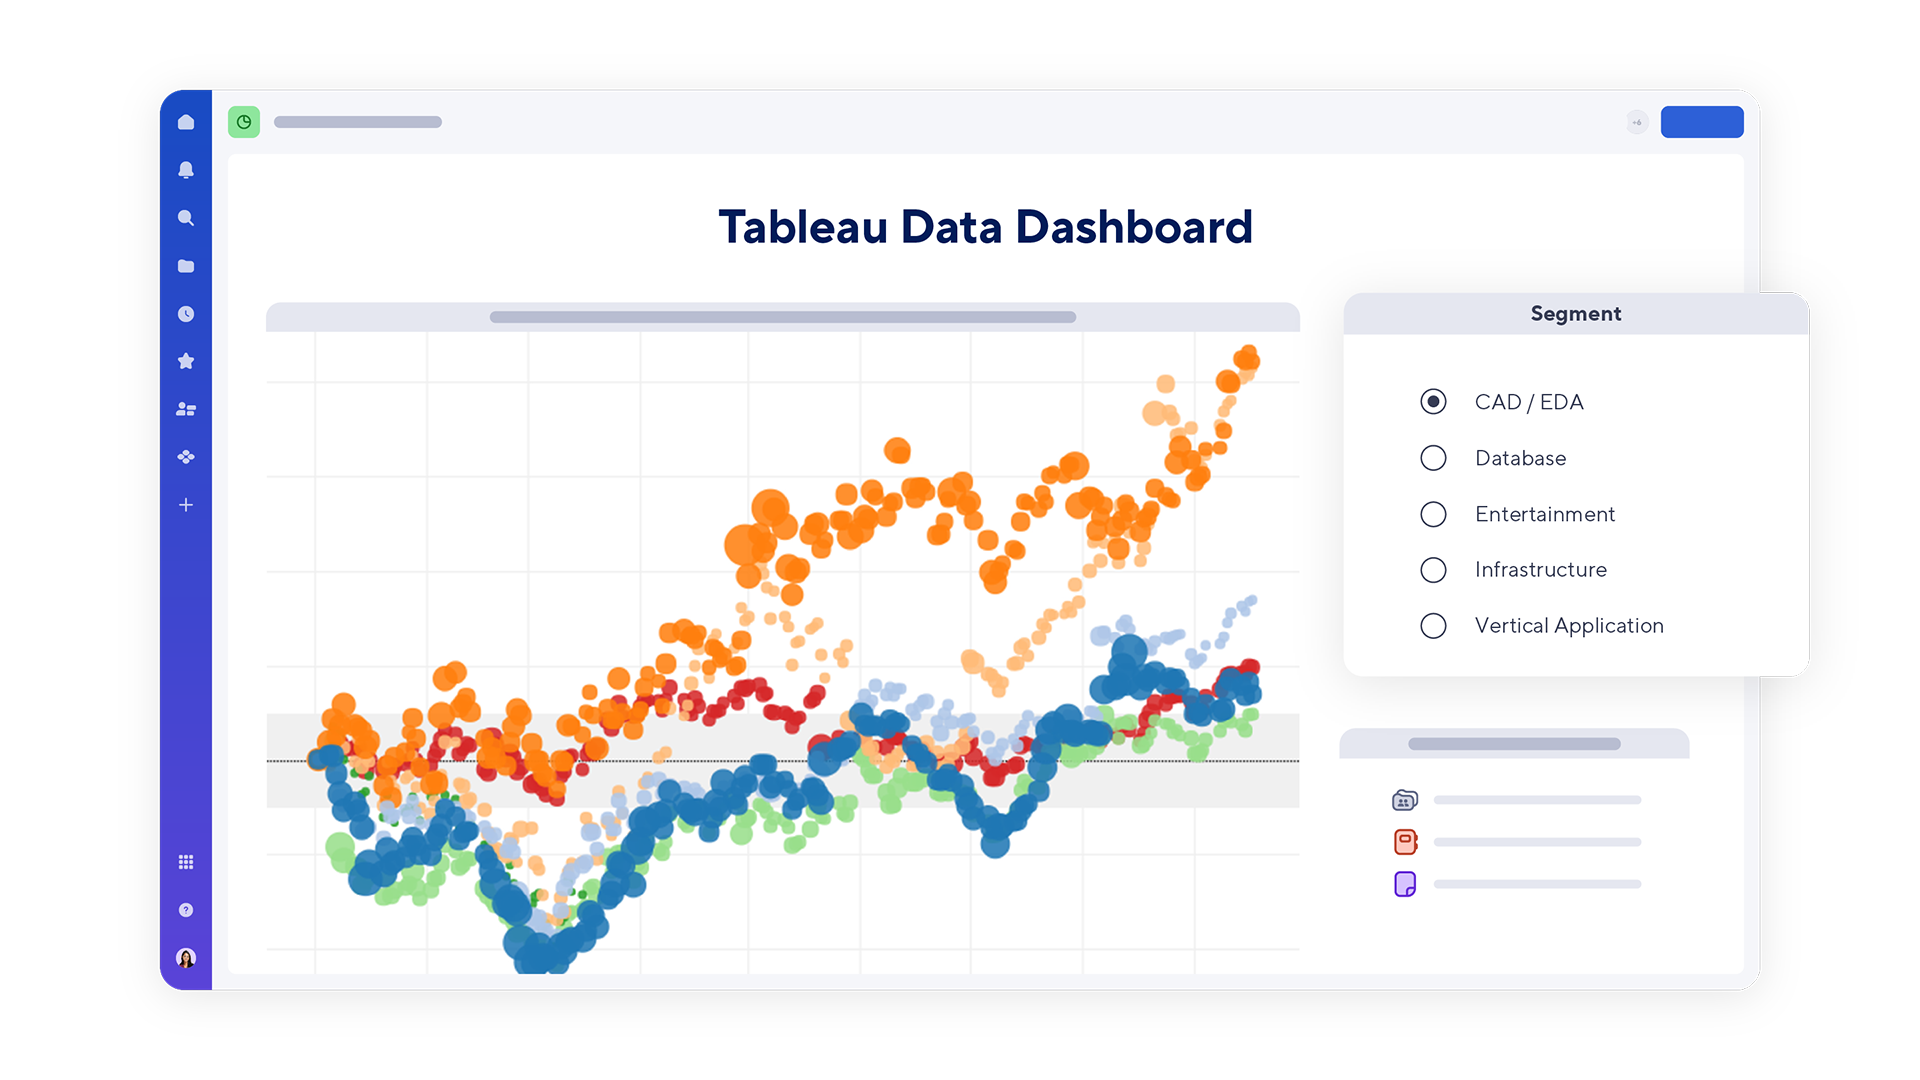
Smartsheet Tableau data visualization dashboard

Overview

Get new data insights for making better decisions.

Smartsheet for Tableau enables you to visualize your Smartsheet data in Tableau, giving you more ways to identify, analyze, and take action on trends and changes in your business. Import Smartsheet data into Tableau and combine data from other business-critical systems to help your whole team gain valuable analytics insights. Then view your Tableau visualized data on a Smartsheet dashboard.

Key Capabilities and Common Use Cases

Accelerators

Deliver powerful data visibility and insights in a whole new way

Nearly every organization today uses analytics tools to discover and explore new insights from their data. Business Intelligence solutions powered by your Smartsheet data can help you make the right data available to the right people at the right time.

Reports Visibility icon

Access real-time data anywhere

You and your department can discover powerful visualizations, analysis, and insight by integrating Smartsheet data into Tableau. The Web Data Connector establishes a link between Smartsheet and Tableau, allowing you to create complex visualizations that you can share across the entire organization. Easily track everything from sales territories to personnel start dates to sales quotas in a single visual.

Activity Log

Easy to use on any platform

With Smartsheet for Tableau, anyone on Mac and Windows can enjoy rich features, and ease of use with the integration. The integration is built on the Tableau Web Data Connector (WDC) technology, which won’t require your IT department to install or maintain any additional software.

Multiple Views

Visibility into what matters most

Improve your insights into Smartsheet data by seamlessly visualizing your work in charts, graphs, dashboards, and more. You can pull data from multiple sheets into a single report, combining information from across the enterprise — from Smartsheet and other analytics apps — and visualize it all in a single dashboard.

Bring your Tableau data visualization back into a Smartsheet dashboard

Use the web content widget to embed Tableau Online in a dashboard. Combine other data to get a complete and actionable view. View solutions ranging from interactive dashboards for executives to forward-looking trend reports to exploratory data analysis charts.

Demand Management

Understand data in new ways

See and understand your Smartsheet data in entirely new ways. Use Smartsheet as the data collection repository, with analysts simply updating a row or two each month. After you have connected Smartsheet as a data source, you can refresh data manually, or on a schedule to pick up any new changes from your sheet or report.