What Is Productivity Calculation?
A productivity calculation measures the efficiency of how resources are used to produce an item or provide a service. It compares the amount of resources used against the output in order to create a efficiency ratio.
Calculating Productivity in Employees
Many external factors can affect your organization’s productivity -- the national economy, a recession, inflation, competition, etc. Although you can’t control everything, you can control and measure employee performance. Employee productivity has a huge impact on profits, and with a simple equation, you can track productivity per individual, team, or even department.
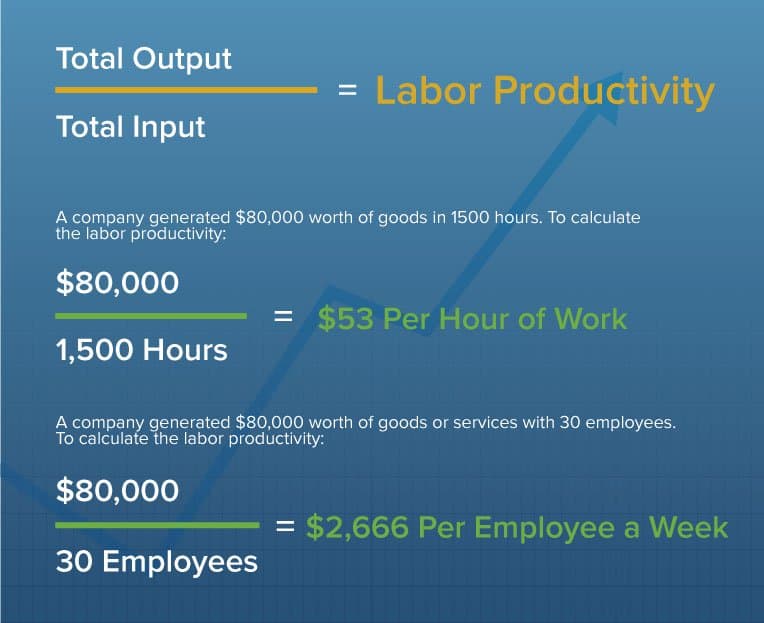
You can measure employee productivity with the labor productivity equation: total output / total input.
Let’s say your company generated $80,000 worth of goods or services (output) utilizing 1,500 labor hours (input). To calculate your company’s labor productivity, you would divide 80,000 by 1,500, which equals 53. This means that your company generates $53 per hour of work.
You could also look at labor productivity in terms of individual employee contribution. In this case, instead of using hours as the input, you would use number of employees.
Let’s say your company generated $80,000 worth of goods or services in one week with 30 employees. You would divide 80,000 by 30, which equals 2,666 (meaning each employee produced $2,666 for your company per week).
Calculating Productivity by Industry
While the formula to calculate employee productivity appears fairly straightforward, you may want to make tweaks based on industry. How you define and measure productivity changes based on your job, so you’ll have to adjust your equation.
For example, the unit of service (UOS) will change depending on the job. The labor productivity formula doesn’t require a UOS, but defining it can be helpful to add context to the output. A salesperson may have “calls made” or “deals closed” as his or her UOS, while a housekeeper in a hotel might have “rooms cleaned per shift” as her UOS.
Benchmarks and Targets
Productivity benchmarks and targets also change depending on the industry. Some jobs already have basic benchmarks established. For example, customer service representatives have benchmarks that establish how long a “productive” call should take. However, many companies will have to establish these benchmarks themselves.
And, based on these benchmarks, you may decide to change the target productivity. In many jobs, like customer service jobs, employee don’t have much control over their own productivity (i.e. it depends on how many calls they receive, which they can’t control). In that case, it’s unrealistic to say they should target 100% productivity, so you may lower the target.
Industry Factors to Consider
When you calculate productivity using the labor productivity method, your outputs will change based on the industry. Here are some examples:
- Sales: To measure sales productivity, you should measure a variety of additional outputs, like the number of new accounts opened, the number of calls made, and the volume of sales in dollars.
- Services: The service industry is one of the hardest industries in which to calculate productivity because of the intangible outputs involved. You could measure the number of tasks performed or the number of customers served.
- Manufacturing: If you manufacture goods, you may want to use output per worker-hour required to produce a single product. In other words, you would want to calculate the product cost of one unit.
Measuring Efficiency
While productivity measures quantity, efficiency measures quality. You could calculate a very high productivity number per employee, but that number alone doesn’t give you any insight into the quality of work (in theory, an employee could seem very productive, but actually be producing horrible outputs).
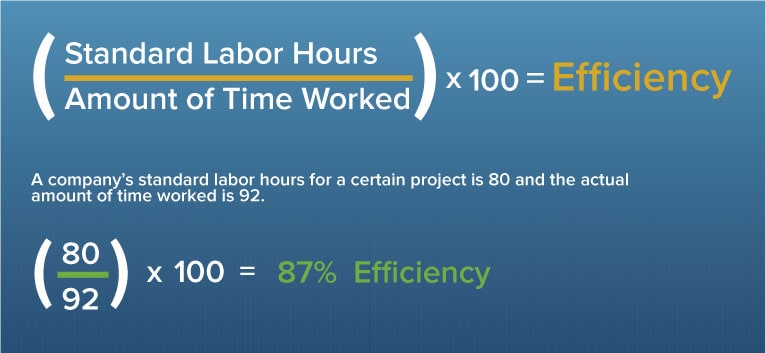
To compare the productivity numbers against a benchmark, you can compare the current productivity with the standard amount of effort needed for the same output. Divide the standard labor hours by the actual amount of time worked and multiply by 100. The closer the final number is to 100, the more effective your employees are.
For example, let’s say the standard labor hours for a certain project is 80 and the actual amount of time worked is 92. You would divide 80 by 92, and multiply by 100, calculating your efficiency to be 87%.
As you compare productivity and efficiency, there are a few different ratios to consider:
- Idle time ratio: (Production downtime / total labor hours) x 100
- Activity ratio: (Expected hours needed to produce actual output / actual hours need to complete) x 100
- Labor capacity: (Actual hours worked / total budgeted labor hours) x 100
Longitudinal Reporting
The biggest benefit to measuring employee efficiency is in longitudinal reporting, where you calculate efficiency over a period of time. This allows you to identify trends that may impact how you organize staff, or hire and remove employees.
Measuring long-term efficiency and productivity can also help you decide who should receive a promotion or bonus. And lastly, this type of reporting can play a role in predictive modeling: if you know an employee’s efficiency rate, then you can predict how many items/tasks will be produced or completed in a certain amount of time.
Calculating Productivity in an Organization
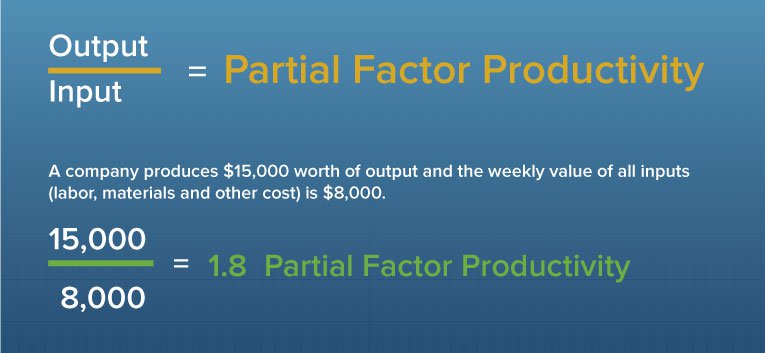
1. Partial factor productivity
This formula is made up of the ratio of total output to a single input. Managers tend to use this formula most often because the data is available and easy to access. Also, partial factor productivity equations are easier to relate to specific processes because they only deal with one input.
To calculate partial factor productivity, let’s say that a company produces $15,000 worth of output and the weekly value of all inputs (labor, materials, and other costs) is $8,000. You would divide 15,000 by 8,000, calculating a partial factor productivity of 1.8.
2. Multifactor productivity
Whereas the partial factor productivity formula uses one single input, the multifactor productivity formula is the ratio of total outputs to a subset of inputs. For example, an equation could measure the ratio of output to labor, materials, and capital. This method is a more comprehensive measure than partial factor productivity, but it’s also harder to calculate.
We’ve asked Dan Keto, a productivity expert from Easy Metrics, to provide an example to illustrate one possible multifactor productivity equation.
One of our clients manages cross-docking operations for one of the nation's largest retailers. Cross-docking is where you take imported containerized ocean freight, unload it, then reload it into outbound truck freight. It is basically like taking apart a Rubik's cube and then reassembling it. The industry paradigm is to look at the production metric for the workers handling the freight in terms of cases per hour (CPH). Over a longer period of time, this is a reasonable metric. However, to manage operations daily per employee, it is not effective.
Each freight container can have from 40 cases to 20,000 cases on it depending on the type of product on the container and have as many as 100 different SKUs. The freight mix has a dramatic impact on the time it takes to process the work. Depending on the container mix, CPH can vary from 20 cases per labor hour to over 400.
Using CPH, the client was unable to have any consistency in either its productivity or labor forecast requirements because they were not using other factors present in the data to more accurately calculate the labor standard. By incorporating SKUs, splits, case weight and cube into the calculations, we were able to develop a multi-factor labor standard that could accurately and consistently predict the amount of labor required for each container of freight.
Using a linear regression model, the standard formula for this method is
HOURS = AX + BY + CZ + D
In the case of the above example, HOURS = A*(# Cases) + B*(Splits) + C*(SKUs) + D*(Cube) + E*(Weight) + F. The coefficients A-F are the calculated weighting factors multiplied against the input to get you the end result. These coefficients can be either calculated using time in motion studies (industrial engineering model) or if you have a large enough data set, linear regression tools. Modern technology and big data can now give even small operations the ability to calculate cost effectively multi-factor productivity standards.
The end result using the above example was that the client was able to see down to each employee what the productivity level was and then proactively manage and train accordingly. Labor costs were reduced by over 30%.
3. Total factor productivity
This formula combines the effects of all the resources used in the production of goods and services (labor, capital, material, etc.) and divides it into the output. This method can reflect simultaneous changes in outputs and inputs, however they do not show the interaction between each output and input separately (meaning they are too broad to be improve specific areas).
Once again, this equation is hard to calculate. Our productivity expert from Easy Metrics, a labor management system, shares an example to illustrate one possible calculation.
Measuring total factor productivity is both art and science. The key thing to keep in mind when building out this productivity metric is to focus on inputs that have a reasonable correlation for cost and efficiency to the output. Engineers will often want to measure every possible input factor around a process. Using big data analysis, we have often found that the correlation of many of these input factors is below the natural variance (noise) that occurs within the process, so collecting that information is often not worth the cost of doing so.
One of our customers is a large food processor that produces packaged vegetable products. They have roughly 200 employees per shift, working 16 equipment driven production lines and approximately 1000 different product SKUs. Their standard metric was to look at lbs per labor hour produced to measure their efficiencies, however this can be very misleading because depending on what the product is, there is a high variance between each product.
We worked with them to increase the number of factors measured to get a clear understanding of overall productivity as well as identify areas to focus on that can drive higher productivity. These factors were:
- Machine uptime: Measured as a percentage of shift hours
- Missing time: Variance between worker time clock time and time on production line
- Labor standard versus lbs/hr: Developed multivariate production standards based on pack style and commodity type/mix. Result scored as a percentage of standard where 100% means operating at expected productivity level.
- Product yield/loss: Qualitative factor that measured output weight versus input weight
- Input product quality factor: Commodity quality variances create variances in productivity
- Production run factor: Takes into account time to switch lines over to new product types. Short runs proportionately have comparatively larger set-up times per pound produce.
The end result was a comprehensive reporting dashboard with one macro result of the total productivity factor, scored as a percentage where 100% is daily goal, then each above sub-factor broken down so they could identify deficiencies. Each sub-factor is weighted in proportion to its importance. Labor standards and machine uptime were give weightings of each 30% with the other factors weighted less since those two factors were the primary driver of productivity.
Total Productivity Factor = 0.30 × Machine Uptime + .10 × Missing Time + .30 × Labor Standard + .10 × Product Yield + .10 × Input Quality Factor + .10 × Production Run Factor
The client now has clear visibility into their operations and the information at hand to address deficiencies as they arise.
Other Things to Consider
Once you have identified the formula that works best for you organization, there are a number of other factors to consider:
- Productivity index: Because productivity is a relative measure, it must be compared to something else for the data to be valuable. You may have a set of numbers representing your organization’s productivity, but how do you know if those are good numbers or bad numbers? To understand your own organization’s productivity, you must create a productivity index. This is the ratio of productivity measured in a certain period of time to the productivity measured in a base period. For example, if the base period’s productivity is 2 and the following period’s productivity is 2.3, the productivity index would be 2.3/2 = 1.15, meaning that your organization's productivity had increased 15%. By tracking these numbers over time, you can identify patterns and evaluate success or failure.
- Value added: Value added is a common measure for goods and services (output). It is the difference between what a customer pays and what the business pays for the raw materials. The higher the value of a product or service, the more money that can be put toward wages, profits, or taxes. Value added is calculated by subtracting the total cost from the sales of output.
- Utilization: Utilization measures management’s work. It looks at labor (available time) to open work and indicates how well managers have used labor resources. For example, there are 450 working minutes in an eight-hour shift. If 380 of those minutes were spent actually working, that person’s utilization would be 84%.
Calculating Productivity From Office Productivity Software
You know that technology helps your employees and organization be more productive, but how can you measure and prove it?
Calculating the value of office productivity software isn’t as clear cut as calculating productivity for employees or your company. There is no single formula that will generate the ROI from a new tool.
However, there are a couple of different tactics you can implement to help you prove the value of office productivity tools.
- Compare metrics before and after implementing the tool: Before you start calculating value and productivity from a tool, you must track metrics before the tool has been implemented. You need to have numbers to compare against, otherwise you won’t be able to attribute any upticks to the office productivity tool. If possible, track total numbers on a yearly, quarterly, monthly, weekly, and daily basis before the tool. For example, in a subscription-based company, you should track trials, conversions, upgrades, downgrades, and cancels for each timeframe. Then, after you implement the tool, you can track the same metrics and compare numbers. While you won’t be able to 100% correlate changes to the new tool (other factors could also be contributing), you’ll have a strong anecdotal cause.
- Frame value in terms of employee time: Once employees are using the tool, ask each person how much time he or she is saving. For example, if your office productivity software automates a process that used to be managed full time by an employee, you’re essentially saving that person’s annual salary. Or, if the tool saves a certain employee 5 hours a week, figure out how much you are paying that employee per hour and multiply that by 5 to calculate the total savings per week.
Case Study: How Forrester Calculated Productivity from Smartsheet
Forrester Research, an independent technology and market research company, quantitatively calculated the value of Smartsheet, a collaborative work management tool, in its study, “The Total Economic Impact of Smartsheet.” Forrester’s approach acts as a case study to help other organizations figure out how to assign a monetary value to software.
Forrester calculated the following business benefits from using Smartsheet:
- 25% increase in productivity of work teams, leading to $3,609,375 in savings over three years.
- 21% time savings for project, product, and process managers, leading to a $5,890,500 savings over three years.
- A reduced cost of $835,200 over three years to consolidate customer issues, increasing the responsiveness of sales and service engineers.
- Improved resourcing around projects, resulting in a cost avoidance of $450,000 over three years.
- ROI of 1,437%
How did Forrester come up with these numbers? Here is the framework and methodology they followed:
- Interviewed internal Smartsheet employees across departments
- Interviewed organizations currently using Smartsheet
- Constructed a financial model populated with the cost and benefit data obtained from the interviews.
- Risk-adjusted the financial model based on issues and concerns highlighted in interviews.
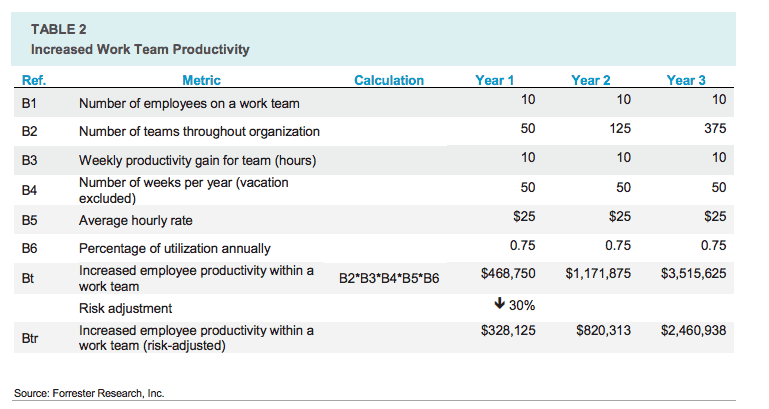
After extensive research and collecting hard data, Forrester plugged in their findings into a table like this:
Here is a formula to replicate this approach for your own organization:
Number of teams in your organization X weekly productivity gain for team in hours X number of weeks per year excluding vacation X average hourly rate X percentage of utilization annually = increased productivity before risk adjustment
Then, once you get that number, you’ll need to adjust for risk (this requires that you assign a percentage value to represent risk in your organization).
Increased productivity before risk adjustment X risk adjustment percentage = risk adjustment in dollars
Increased productivity before risk adjustment - risk adjustment in dollars = final increased work team productivity
Quick Tips to Improve Productivity
After you’ve gone through and calculated productivity at the employee, organization, and software level, the next logical question is, “How do I improve the productivity?”
Here are some simple tips and tricks to improve productivity at all levels:
Improving Employee Productivity:
- Set clear goals: Employees are more motivated to go above and beyond when they have clear expectations and guidelines. By sharing specific goals with the team, they’ll be able to better manage their time and optimize productivity.
- Provide feedback on a regular basis: Effective feedback improves team morale and encourages employees to grow and do better. Make sure to give continuous feedback that focuses on action, rather than the person, and be precise.
- Give them the right equipment: Ask employees what tools and equipment they need to be successful and make sure they work! You don’t want to reduce productivity simply because computers or software aren’t functioning properly.
Improving Organizational Productivity:
- Design an incentive program: Employees work harder when they feel respected and appreciated. An incentive program, like offering extra vacation time or bonuses, can motivate an entire company to work harder. And an incentive program doesn’t even have to have monetary value to be effective. Something as simple as an employee recognition program can boost productivity.
- Ensure senior leadership buy-in: When you set organizational goals, make sure you have leadership buy-in. Leaders are always being watched and judged, so they need to sset a good example. If employees see them leaving early every day or on Facebook for hours, they’ll start to think that’s okay too.
- Encourage flexible schedules: Although it sounds counterintuitive, requiring all employees to follow the same rigid schedule is bad for morale and company productivity. Allowing employees to work from home, set their own schedules, and/or have unlimited PTO actually enhances loyalty and productivity.
Improving Software Productivity:
- Get the whole team on board: You won’t move the needle if only one person is using the office productivity tool. The key to generating value is to ensure widespread adoption. If everyone is using the same tool, your team can move faster and get more work done.
- Leverage free trainings: If employees don’t understand how to use a tool out of the gate, they just won’t make the time to learn it. It could be the easiest tool to learn, but employees may feel overwhelmed and not know where to start. Take advantage of the training options software companies typically offer, from on-demand videos to free webinars to in-person sessions.
- Explore integrations: Employees use dozens of different apps on a daily basis and if a new tool doesn’t connect or work with the apps they already use, they’ll forget about it. The goods news is that most productivity tools offer integrations with other tools like Google Apps, Evernote, Tableau, and others.
Improve Productivity with Real-Time Work Management in Smartsheet
Empower your people to go above and beyond with a flexible platform designed to match the needs of your team — and adapt as those needs change.
The Smartsheet platform makes it easy to plan, capture, manage, and report on work from anywhere, helping your team be more effective and get more done. Report on key metrics and get real-time visibility into work as it happens with roll-up reports, dashboards, and automated workflows built to keep your team connected and informed.
When teams have clarity into the work getting done, there’s no telling how much more they can accomplish in the same amount of time. Try Smartsheet for free, today.