What Is an Agile Gantt Chart?
An Agile Gantt chart is a project management tool that maps sprints, tasks, and milestones onto a timeline, providing a clear picture of how these elements fit together in the project schedule. It helps teams stay on track while allowing for flexibility.
Key Takeaways:
|
At first glance, Gantt charts may seem incompatible with Agile. Agile is iterative and fast-moving, whereas Gantt charts typically outline fixed, long-term schedules and dependencies. In practice, however, many teams use both effectively. A well-built Gantt chart helps project leads plan across multiple sprints, align teams, and identify risks early — all without compromising agility.
Using the chart, you can map major deliverables, estimate timing for upcoming features, and connect dependencies across teams. This high-level schedule is helpful in communicating timelines and major deliverables to stakeholders. Instead of translating your backlog into separate updates, you have a visual timeline ready to share.
A Gantt chart doesn’t replace your backlog or task board — it complements them. It helps you step back, spot the moving parts, and keep long-term goals in view while your team works on short-term tasks. Find out more about how to strike this balance in this all-in-one guide to Agile project management.

“Gantt charts are a great visual representation of the overall timeline and milestones of a project,” says Marisa Browne, a PMP-certified Project Manager at Traffix, a North American transportation and logistics company.
“A Gantt chart is preferable to a detailed project plan or Kanban board when you are looking for a comprehensive reference for reporting on project progress.”
Browne adds that it’s an analytical and decision-making tool as well. “If you’re utilizing a Gantt chart properly, you can easily view timeline slippage, dependencies, critical path, and percentage of project completed for the full project lifecycle,” she says. “It is a great tool for a high-level view to inform decisions and to motivate and align project stakeholders.”
Learn more about this powerful planning tool in this guide to Gantt charts.
How to Make a Gantt Chart for Agile Projects
To create a Gantt chart for an Agile project, start by downloading a template, then enter backlog items and group them by sprint or release. Add only blocking dependencies and key milestones, then timebox the timeline with sprint dates. Assign near-term owners and update the chart as needed.
Here’s how to build a Gantt chart that supports Agile planning, communication, and flexibility:
- Download a Template
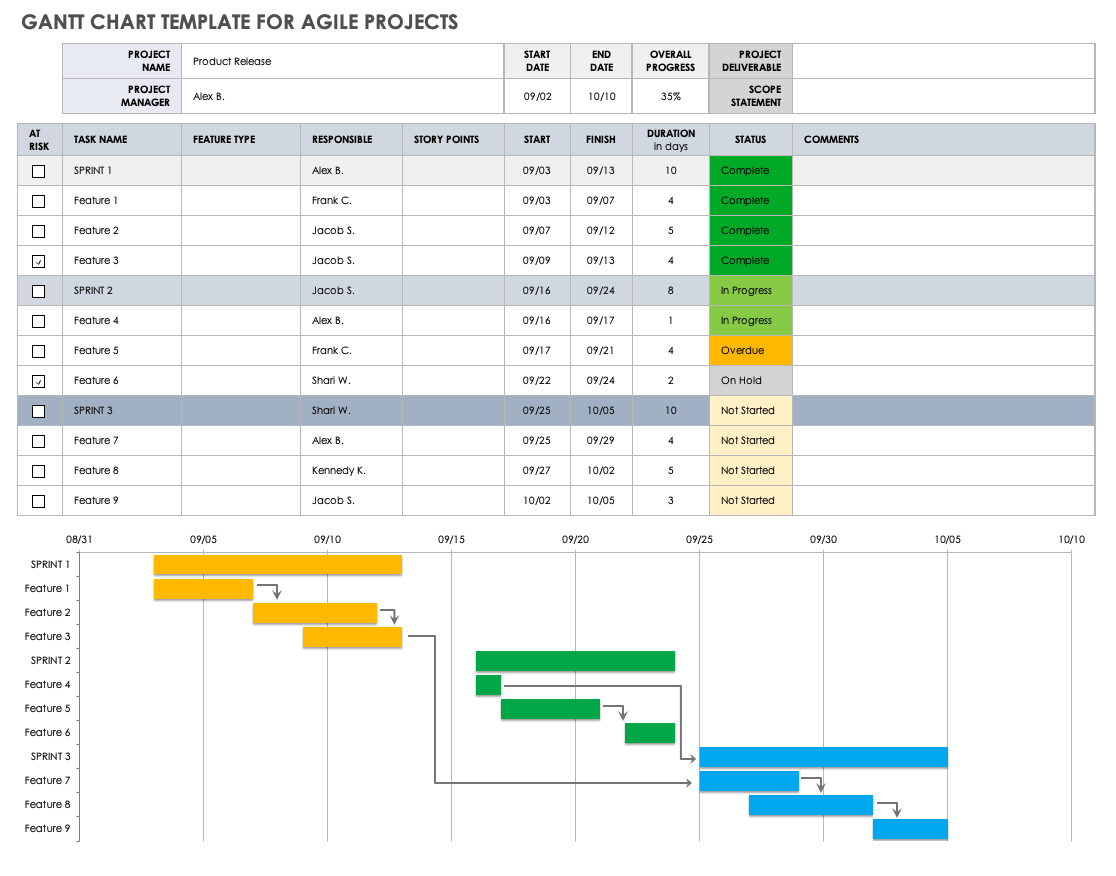
Download a simple Gantt chart template in Excel or Google Sheets. These templates support Agile workflows with a structured but adaptable layout that includes space for sprints and releases.
- Pull Tasks From Your Backlog
Teams that work in Agile likely have a backlog already in place. Identify the most important features from this backlog, and enter them into the template. Focus on the work required to visualize upcoming activity rather than mapping out every detail. Group these features by sprint, release, or theme, according to your team’s delivery structure. - Estimate Sprint and Task Durations
Estimate task durations using velocity, points, or rough estimates, then estimate start and end dates for each sprint. The purpose of this step is to sketch out timing and set expectations, not to build a fixed schedule. Enter these durations into the template to populate the Gantt chart automatically. The template color-codes the task bars by sprint, helping stakeholders quickly understand the flow of work at a glance. - Identify Dependencies
Identify dependencies, focusing only on those that could truly block progress or that require coordination across teams. Represent these dependencies directly on the Gantt chart by dragging arrows from one task bar to another or by copying and pasting arrow links as needed. You might also want to write down some key milestones, such as demos, at this point. - Assign Task Owners
Assign tasks by entering the responsible party where indicated in the template. This is only necessary for near-term sprints. For future sprints, stay flexible. Agile teams thrive on shared ownership, so involve everything in assigning and adjusting. - Test Scenarios on the Chart
Adjust task start and end dates to test what-if scenarios. If a sprint slips, how does that affect dependencies or handoffs? Agile planning is iterative, and this step allows you to test changes in a low-risk approach. - Update as Needed
Update the chart at natural cadence points: sprint planning, reviews, or shifts with a major deliverable. - Share the Chart With Stakeholders
Share the chart when you need to communicate the big picture to stakeholders. Gantt charts like this are especially helpful for updating non-Agile teams — such as marketing, executives, or clients — who need a schedule overview but not a full backlog. Clarify that dates are directional rather than fixed and that the Gantt chart is a current snapshot intended for visibility and discussion, not a contractual agreement.
Tip: If you’re a Smartsheet user, you can turn this Gantt chart template into a dynamic, collaborative Gantt chart with dependencies, milestones, drag-and-drop dates, and real-time updates — all while keeping your Agile tools in place.
You can also download other free Gantt chart templates and Gantt chart templates with dependencies.
How Gantt Charts Work With Agile Methodology
Gantt charts work with Agile by offering a high-level view of sprints, tasks, and dependencies. In Agile, the project manager updates the chart at key points, such as sprint planning or reviews, to align stakeholders who need a schedule view, without replacing core tools such as boards or backlogs.
Agile focuses on short-term planning, continuous feedback, and delivering work in small, manageable increments. Traditional Gantt charts, by contrast, emphasize long-term timelines and are more popularly used in Waterfall methodology. While many Agile teams do not use Gantt charts, many find that a simple Gantt chart fills an important gap: It connects sprint-based work to larger timelines for stakeholder visibility.
For Agile project managers, Gantt charts can also make these tasks easier:
- Identifying Dependencies: Users can add task dependencies to Gantt charts, which is harder to visualize on a standard sprint board.
- Communicating Progress to Leadership: Charts provide clarity on where a project stands.
- Coordinating Among Teams: Development might work in Agile, but marketing, sales, and executives often still expect to see a schedule.
- Planning Across Sprints: In an Agile Gantt chart, teams can lay out several sprints in sequence and attach key work items to each, illustrating how near-term work contributes to longer-term goals.
- Preparing for Deadlines: Even in Agile, some deliverables can’t slip, such as a hard release date or regulatory milestone. Highlight those in your Gantt charts.
“I generally use a Gantt chart to report on overall project status to executives or stakeholders and as a communication tool with the project team on an as-needed basis,” says Browne. “With the immediate project team, I'd rather utilize standups, sprints, and the project plan for day-to-day team ownership and reference the Gantt chart as needed.”
Browne explains that this approach puts Gantt charts in their proper context. “This ensures we are prioritizing the right tasks to hit project milestones and leaves room for flexibility. A detailed project plan or Scrum board will always be my source of truth in an Agile project — and a Gantt chart will complement the project plan as a visual representation to collaborate and communicate status.”

Dave Brocious, Managing Partner at Sky Point Crane, explains how his company uses Gantt charts for complex 3D lift planning and rigging operations. “A Gantt chart provides a crucial visual of safety milestones and interdependencies that a simple backlog cannot replicate,” he says. “However, its perceived rigidity can create friction, as our teams prioritize solving unique customer problems and being responsive. We overcome this by using the Gantt as a dynamic guide, constantly communicating and adjusting with customer input, ensuring our ‘being responsive’ core value is upheld.”
He says the key is finding a middle ground: “We balance the chart's structure with Agile values by using it to anchor critical path safety requirements while allowing flexibility for team ownership in execution.”
Benefits of Gantt Charts for Agile Work
Gantt charts benefit Agile work by bridging short-term sprint planning with long-term project visibility. They provide a clear timeline of sprints so Agile teams can link near-term tasks to larger goals and deadlines. This makes it easier to communicate plans to stakeholders who expect schedule-based updates, while maintaining flexibility.
Overall Benefits of Agile Gantt Charts
Agile Gantt charts give teams a big-picture project view while supporting Agile flexibility. They connect sprint-level work to long-term goals, provide a helpful reference for non-Agile teams, and map dependencies so you can spot delays before they happen. They also enable scenario testing and encourage deadline awareness.
Here are the benefits of Agile Gantt charts:
- Big-Picture Outlook: These charts help Agile teams connect sprint-level work to longer-term goals and milestones.
- Cross-Team Reference Point: Many non-Agile teams think in terms of fixed schedules — not flexible sprints — and a Gantt chart provides a shared point of reference.
- Deadline Awareness: If you’re managing around a fixed deadline, such as a launch date or an upcoming compliance requirement, a Gantt chart can help keep Agile teams on track.
- Dependency Mapping: You can map dependencies directly onto your Agile Gantt chart, so teams can quickly see how delays would impact other work.
- Scenario Testing: By adjusting task start dates and durations, teams can experiment with different scheduling scenarios.
Client and Stakeholder Benefits of Agile Gantt Charts
Agile Gantt charts give clients and stakeholders a shared visual reference that helps keep everyone aligned on priorities and deadlines. They show what’s in progress and what’s coming up next, which makes it easy to see how current efforts fit into the overall timeline.
Here are the benefits of Agile Gantt charts for clients and stakeholders:
- Clear Milestones: Reviews, handoffs, and deadlines are easier to see when they’re laid out on a timeline.
- Client Confidence: Ongoing visibility into the plan reassures clients that the Agile team is making progress.
- Input Awareness: Clients can see on the chart when they need to give input, whether for a review or testing.
- Planning: Stakeholders can organize their own work — such as marketing initiatives or product training — around the Gantt chart.
- Work Transparency: Anyone can view the chart and see what’s underway and what’s next.
Internal Team Benefits of Agile Gantt Charts
Agile Gantt charts give internal teams a long-range view of project work and how today’s tasks contribute to broader goals. They are also a powerful collaborative tool, serving as a reference point for discussions about priorities, dependencies, and trade-offs. By making workloads visible, they help prevent imbalances.
Here are the benefits of Agile Gantt charts to internal teams:
- Capacity Management: When recording work assignments in the Gantt chart, Agile teams can spot and correct upcoming work imbalances so that team members don’t burn out.
- Clarity: Gantt charts reduce common misunderstandings about timing, ownership, and progress.
- Informed Discussions: By making work visible, the chart becomes a tool for discussing priorities, dependencies, and trade-offs.
- Longer View: Teams can see what’s coming next and understand how current tasks are building toward upcoming deliverables.
- Motivation: When team members understand the big picture, they understand how their work contributes to the success of the whole team.
Challenges to Overcome With Gantt Charts in Agile
While Gantt charts can be a useful tool in Agile, they pose several challenges. They can tempt teams to overplan, become high-maintenance, and give stakeholders a false sense of fixed deadlines. In Agile, keep Gantt charts high-level and team-driven, and frame them as a forecast, not a contract.
Here are the most common challenges faced by teams using Gantt charts in Agile:
- Too Much Detail: Gantt charts tempt people to overplan. Instead of mapping out high-level goals, it's easy to fall into the trap of scheduling every story weeks in advance. That doesn’t leave time to learn, reprioritize, or respond to change — core components of Agile. Tip: Use your chart to outline deliverables, not to lock down the entire backlog.
- High Maintenance: Agile work changes often. Keeping a Gantt chart up-to-date becomes burdensome if you’re tracking too many details. What starts as a helpful visual tool can quickly turn into a time suck. Tip: Update the chart at major checkpoints, such as demos, not every time a task shifts.
- Schedule Perceptions: Seeing a polished timeline can lead some stakeholders to believe the dates are fixed. This can create major problems, especially if leadership expects work to be delivered according to the dates in the Gantt chart. Tip: Frame the chart as a weather forecast, not a promise.
- Lost Sense of Value: Agile prioritizes outcomes over output, while Gantt charts illustrate timing. Gantt charts can pull attention toward deadlines and away from completing the highest-value work next. Tip: Use the chart for discussions about value being delivered, not to enforce a timeline.
- Conflicting Metrics: If you work in Agile, you’re probably already tracking with burndown charts, velocity, or story completion. Adding a Gantt chart might create mismatched signals about how the team is doing. Tip: Align what the Gantt chart shows with how your team actually measures progress. Keep it high-level.
- Risk of Top-Down Control: If only one person maintains the Gantt chart, it can become a top-down planning tool. This can easily clash with Agile values such as self-organization. Tip: Keep the chart visible to the whole team and involve them in updating it.
- Better Alternatives: In some cases, a timeline might not be necessary. A visible backlog, working board, and good communication may be enough. A Gantt chart adds structure, but it should solve a real problem, not just check a box. Tip: Ask what problem you're solving before introducing a Gantt chart. If the need is visibility or cross-team planning, it can be a great fit. If it’s simply a matter of habit, reconsider. You can learn about one alternative in this article on roadmaps vs. Gantt charts.
“In many Agile projects with constant iterations, a Gantt chart can cause confusion and require too much effort to update if utilized too frequently,” Browne says. “In these instances, I will utilize a Gantt chart to reflect the current state when reporting out to stakeholders, or the project team on a less frequent basis. If there is project alignment and understanding of deliverables, dependencies and progress, then the Gantt chart is providing its intended value.”
How Gantt Charts Fit Into Waterfall or Agile Workflows
Gantt charts fit differently depending on the workflow. In Waterfall, they act as a master plan, mapping each phase in linear steps. In Agile, teams use them as a flexible planning and communication tool. In hybrid workflows, Gantt charts help align Agile teams with departments that work with fixed timelines.
Here is a breakdown of how Gantt charts fit into Waterfall, Agile, and hybrid workflows:
Waterfall — Gantt Charts as the Master Plan
- In a Waterfall project, teams define the entire scope up front, then break it into phases such as requirements, design, development, testing, and delivery. Once one phase ends, another begins.
- This structure makes Gantt charts a perfect fit. You can map the whole plan on a Gantt chart and use it as the official timeline. Learn more in this guide to using Waterfall in project management.
Agile — Gantt Charts as a Planning and Communication Tool
- Agile doesn’t rely on fixed phases. Teams work in sprints, deliver in small increments, and adjust based on what they learn. That can make rigid Gantt charts seem like a poor match, but used correctly, they can be valuable.
- Frame the chart as a way to show how the timeline is unfolding. Gantt charts can track release timing, visualize progress, and highlight cross-team dependencies. Think of the chart as a high-level view that complements your sprint board — useful for planning and communication, but never set in stone.
Hybrid Workflows — Gantt Charts as a Bridge
- Many teams run Agile sprints while coordinating with departments that still work in phases, such as marketing, legal, finance, or vendors. The Gantt chart shows how these timelines align and makes it clear what needs to shift when a deadline slips. Each group can work on different timelines while staying in sync.
Agile vs. Waterfall: What’s the Difference?
The following diagram illustrates the process differences between Agile and Waterfall project management.

Turbo-Charge Your Gantt Charts with Project Management for Smartsheet
From simple task management and project planning to complex resource and portfolio management, Smartsheet helps you improve collaboration and increase work velocity -- empowering you to get more done.
The Smartsheet platform makes it easy to plan, capture, manage, and report on work from anywhere, helping your team be more effective and get more done. Report on key metrics and get real-time visibility into work as it happens with roll-up reports, dashboards, and automated workflows built to keep your team connected and informed.
When teams have clarity into the work getting done, there’s no telling how much more they can accomplish in the same amount of time. Try Smartsheet for free, today.
FAQs: Gantt Chart for Agile
Yes, a Gantt chart is good for Agile when kept flexible. Gantt charts help Agile teams plan sprint-level work, track timing, and stay on top of external deadlines. They are especially useful for visibility across teams and for giving stakeholders a clear view of what’s ahead.
A Gantt chart can be used in Scrum. While not a core part of Scrum, Gantt charts can still help teams map sprint timelines, highlight dependencies, and show progress at a higher level. The key is to keep them lightweight and updated alongside your Scrum board.
Agile is a project approach built on iteration and flexibility. A simple Gantt chart is a visual tool that shows tasks on a fixed timeline. Agile adapts as work changes. Gantt charts provide a snapshot of the evolving plan.
Yes, some Agile teams use Gantt charts as a supplemental planning and communication tool, not a replacement for backlogs or task boards. They rely on them to visualize sprints, milestones, and cross-team dependencies, and to show stakeholders how their work fits into a broader timeline.


