Marketing Performance Dashboard Template
Download Marketing Performance Dashboard Template — Microsoft Excel
Created for marketing executives, this dashboard template provides information on campaign performance and lead conversions. View the top channels, average opportunity amount, number of leads, and return on investment (ROI) for each campaign. The template also provides a rundown of leads by source, total leads created, cost per acquisition, and closed/won amount, and lists the total marketing spend versus the budgeted amount for a high-level view of budget performance.
Revolutionize your marketing approach
From campaign planning to content calendars, Smartsheet helps marketers stay aligned, hit deadlines, and prove impact.
While traditional spreadsheets can track basic tasks, they fall short when it comes to real marketing execution. Smartsheet is purpose-built for marketing teams, combining the flexibility of a spreadsheet with powerful tools like automated reminders, content approvals, calendars, dashboards, and more.
Start your free trial today and see how much more you can do with Smartsheet.
Digital Marketing Dashboard Template
Download Digital Marketing Dashboard Template — Microsoft Excel
This online marketing dashboard template allows you to track SEO analytics, including the total sessions for a given month, the number of sessions by source, and backlinks. Measure the performance of paid media and organic search traffic against your marketing goals. The template calculates your average ROI and total revenue for the month, and also displays monthly site visits over the course of an entire year.
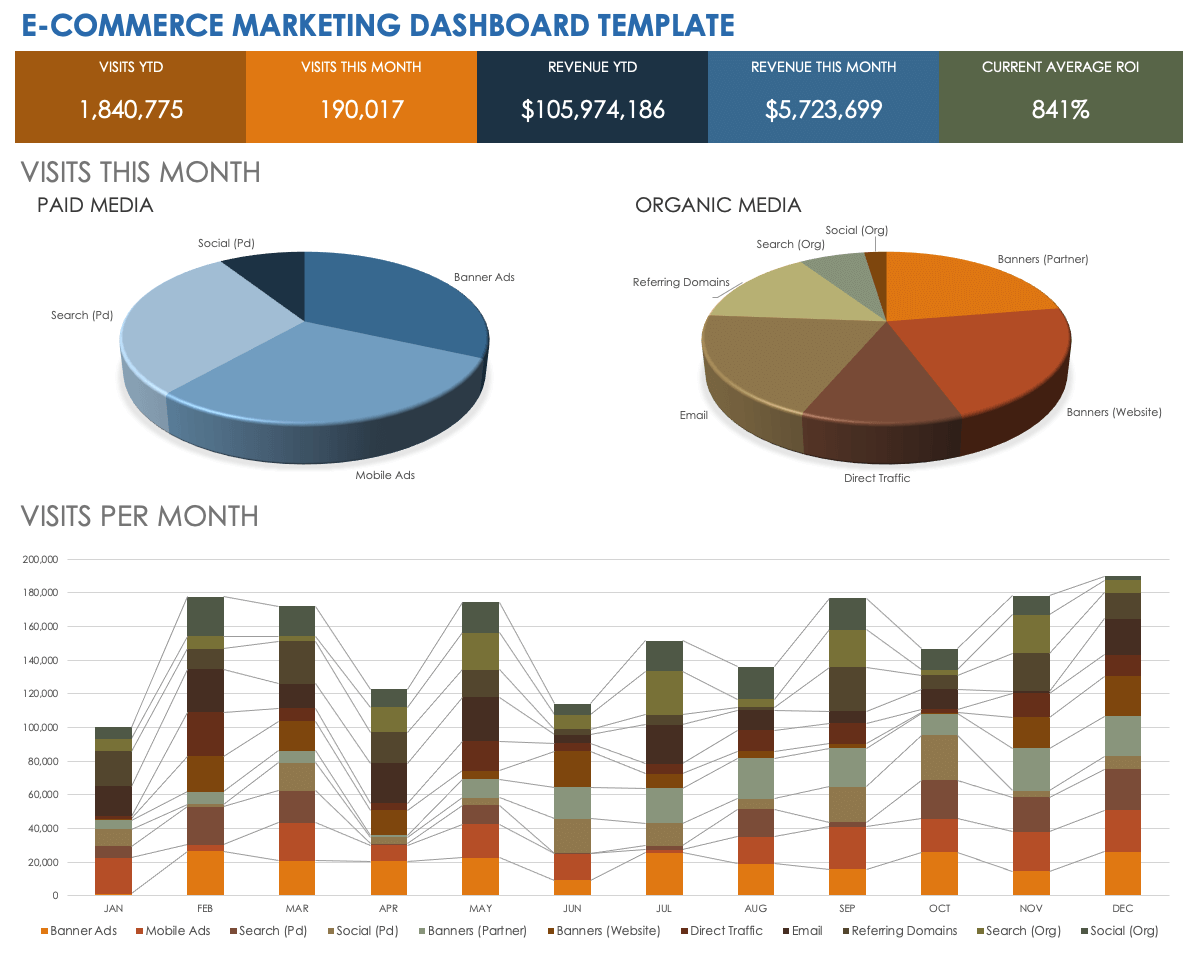
E-Commerce Marketing Dashboard Template
Download E-Commerce Marketing Dashboard Template — Microsoft Excel
Monitor site visits, product orders placed, customer enrollments, and revenue with this e-commerce dashboard template. Set your target number for site visits to see what percentage of your goal you’ve reached for each traffic source. Compare traffic sources by the number of customer purchases and total revenue earned, measure ROI for paid media campaigns, and track monthly revenue for an entire year.
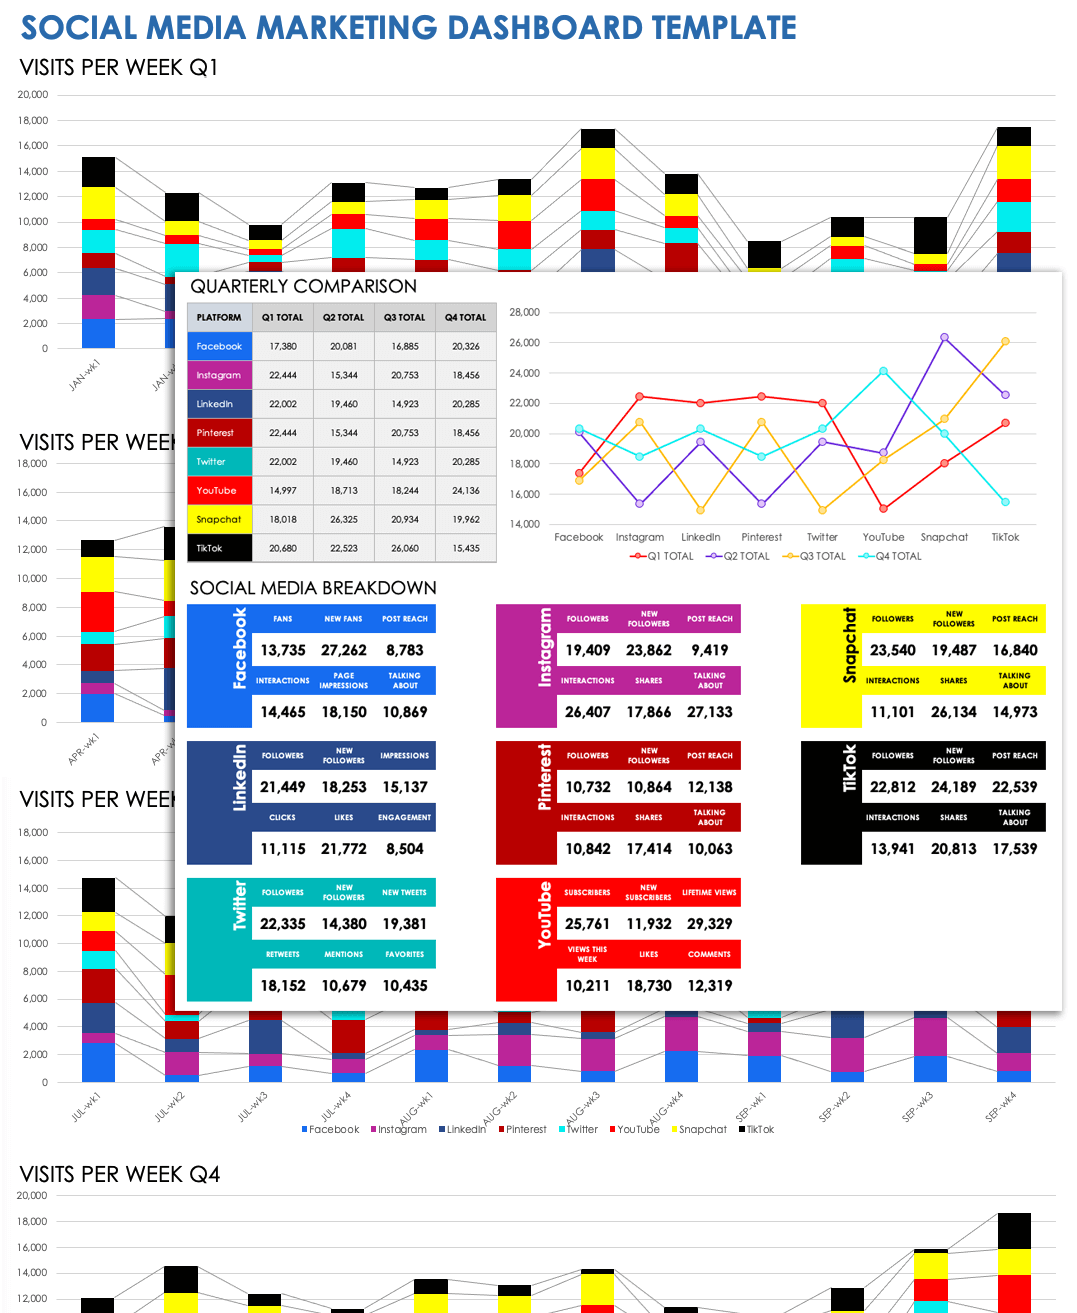
Social Media Marketing Dashboard Template
Download Social Media Marketing Dashboard Template — Microsoft Excel
Use this sample marketing dashboard to compare social media campaigns on multiple channels, including Facebook, LinkedIn, YouTube, Twitter, and Instagram. For each social media platform, the dashboard displays the number of site visits per week during each business quarter. In addition to providing detailed quarterly charts, the dashboard also includes a graph that shows how each social campaign performed across all four quarters. Below the dashboard, you can view a summary of followers, post reach, shares, and other data.
Web Analytics Marketing Dashboard Template
Download Web Analytics Marketing Dashboard Template
Microsoft Excel
| Google Sheets
Compile web analytics in this dashboard template, which allows you to track the daily and monthly visitors, bounce rate, and average time spent on the site. The template also offers daily metrics in the form of percent change from the previous day, and uses line charts to plot metrics over the course of 30 days, so you can easily view fluctuations in site performance.
Email Marketing Dashboard Template
Download Email Marketing Dashboard Template — Microsoft Excel
Use this email marketing dashboard template to measure new subscriptions, unsubscribes, and bounce rate, in order to evaluate the success of your email marketing campaigns on a monthly basis. For each email campaign, view new subscriptions over the last 30 days, as well as subscription growth rates for each month of the year. The dashboard uses a bar chart and line graph to clearly display email marketing data.
Marketing Campaign Dashboard Template
Download Marketing Campaign Dashboard Template — Microsoft Excel
Measure the success of a marketing campaign based on spending, ROI, and consumer awareness and perception. Compare planned versus actual costs, pipeline performance, and closed/won deals. For each metric, the dashboard displays amounts for annual campaign totals, the current time period, and the previous time period to help contextualize your current marketing performance. Use this simple dashboard template to ensure that your marketing campaigns are on track to meet your planned objectives.
Marketing KPI Dashboard Template
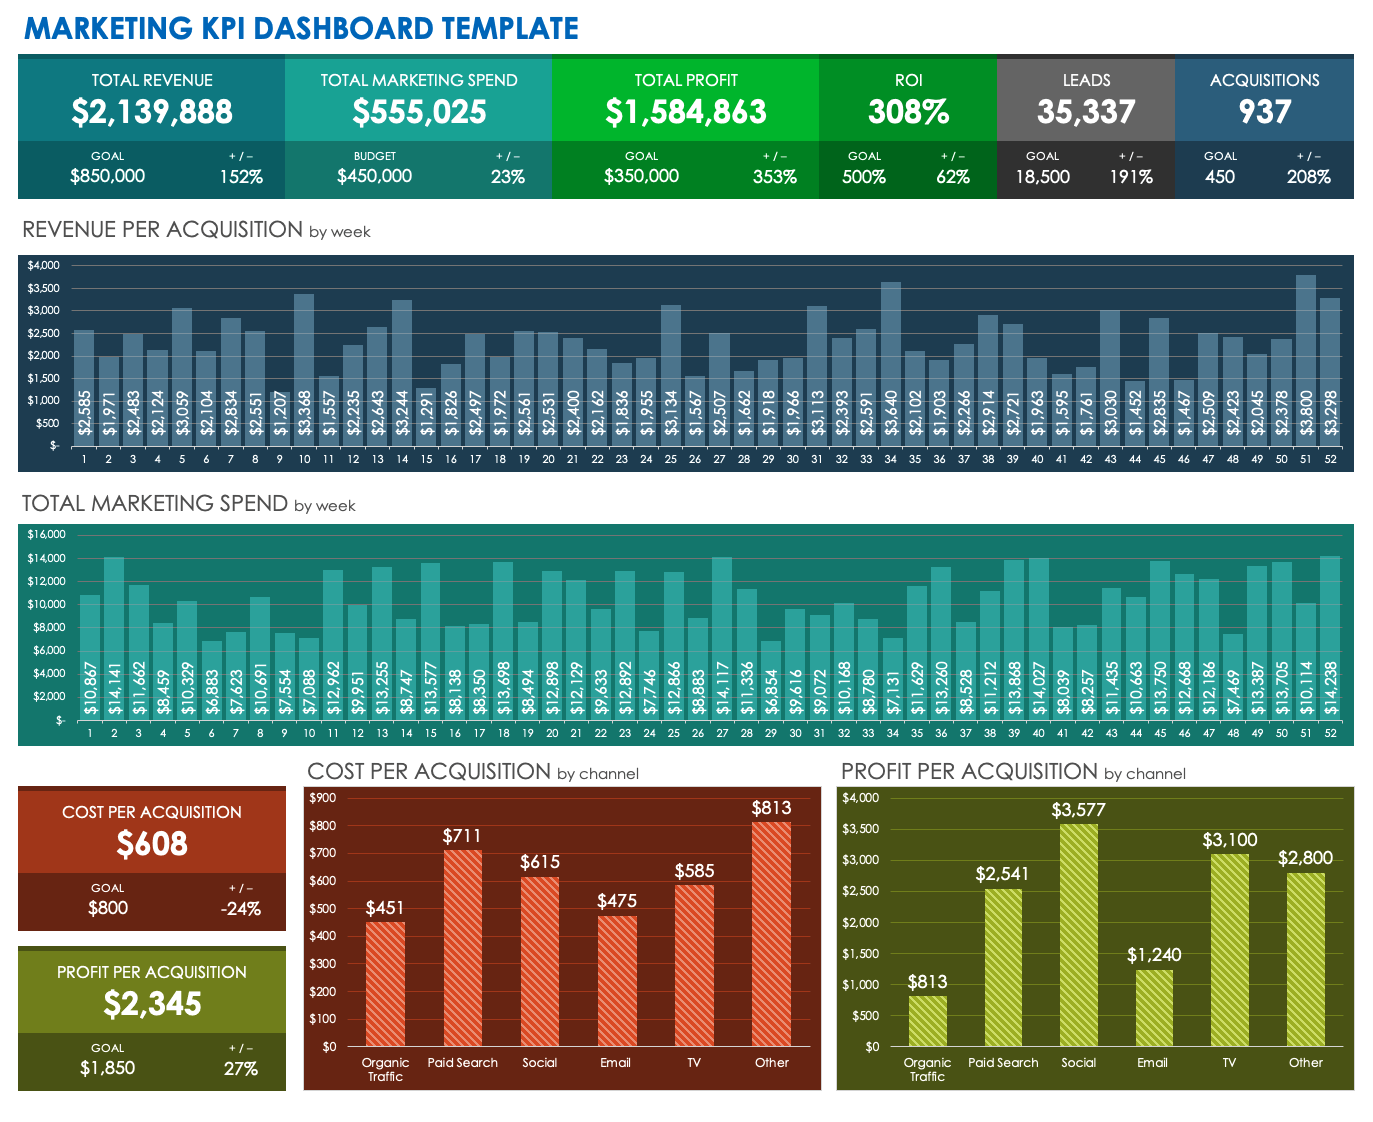
Download Marketing KPI Dashboard Template — Microsoft Excel
Track marketing KPIs and measure performance against your aims for revenue, leads, and customer acquisitions. The dashboard displays customer acquisition cost according to the marketing channel, as well as profit per acquisition. The template also breaks down marketing spend by week and shows the total ROI. Enter your marketing data for a quick, visual summary of KPI progress.
Marketing Dashboard PowerPoint Template
Download Marketing Dashboard Presentation Slide Template — Microsoft PowerPoint
Create a PowerPoint marketing dashboard to use in a presentation. Simply input a summary of online marketing performance, including sessions per week, session duration, bounce rate, traffic sources, and leads per source. The template also includes space for you to note customer conversion data, including top channels, campaigns, and pages by conversion. Show stakeholders how well digital marketing campaigns are meeting objectives.
Marketing Funnel Dashboard Template
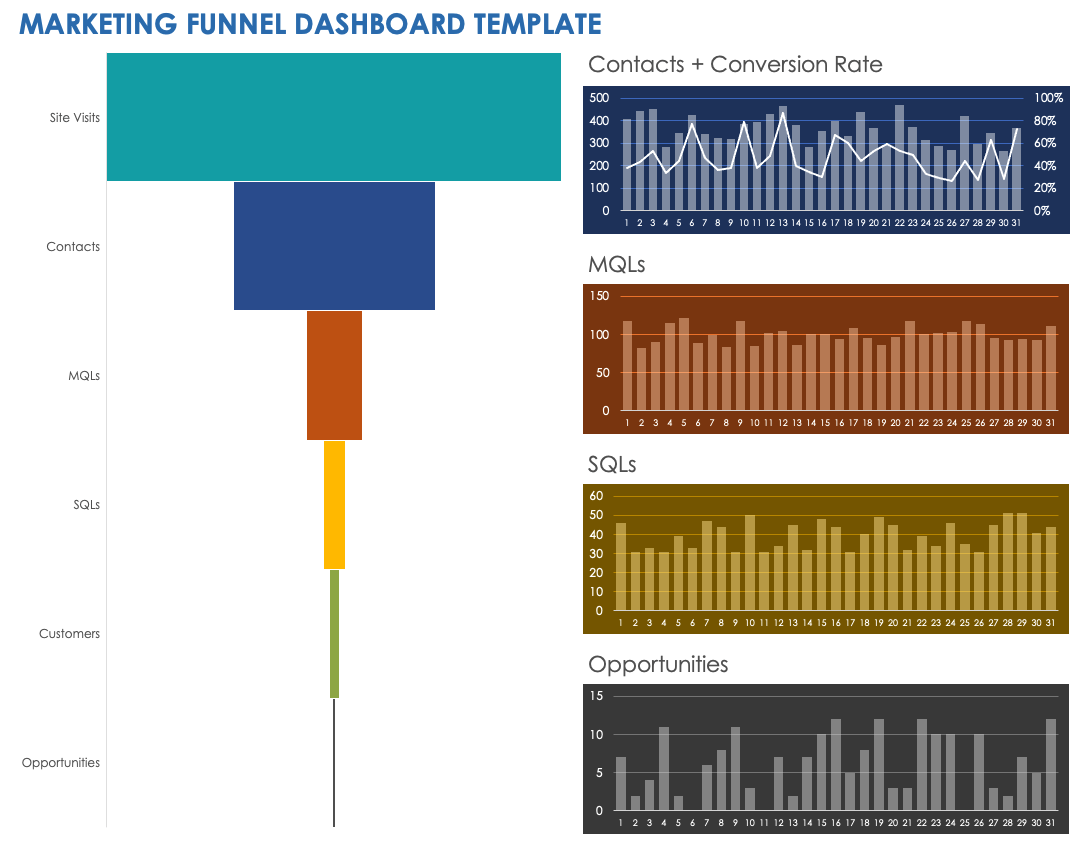
Download Marketing Funnel Dashboard Template — Microsoft Excel
This marketing funnel dashboard makes it easy to track pipeline performance, from sessions to marketing qualified leads (MQLs). The template calculates the total conversion rate, and also includes charts for weekly contacts, MQLs, sales qualified leads (SQLs), and opportunities. In addition, you can quickly compare lead generation and customer conversions to your pipeline goals.
Sales and Marketing Dashboard Template
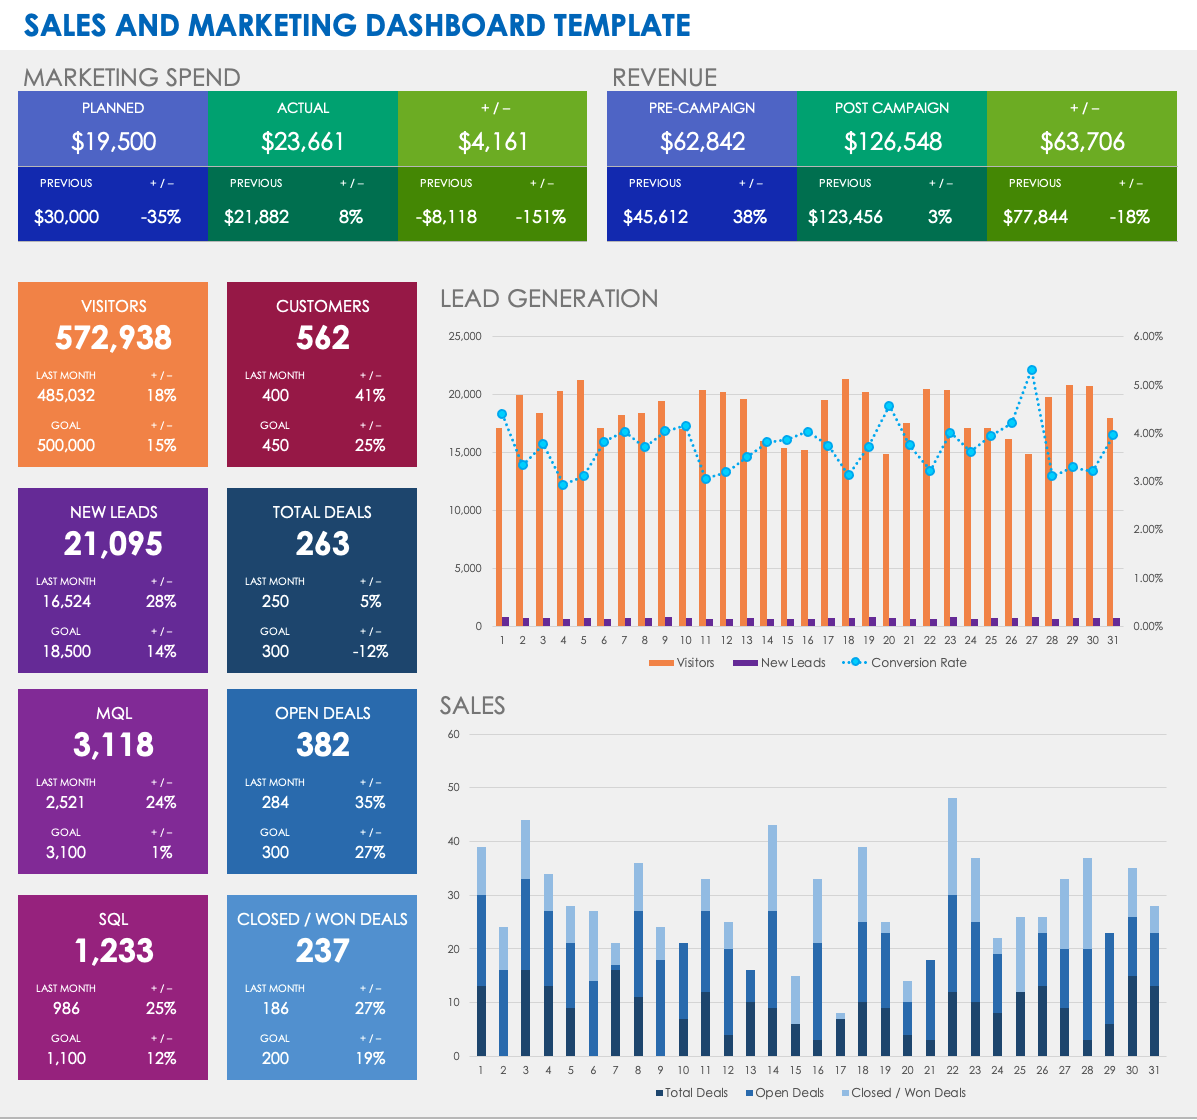
Download Sales and Marketing Dashboard Template — Microsoft Excel
This sales and marketing metrics dashboard template focuses on lead generation, funnel performance, and revenue. It displays new contacts and sessions, closed/won deals, and total revenue for a given month, and also includes sales and marketing pipelines, which show lead conversion metrics and sales deal stages. Then, the template will automatically calculate the conversion rate for acquired customers and closed/won deals, so you can compare your monthly revenue outcomes to your sales targets.
CMO Marketing Dashboard Template
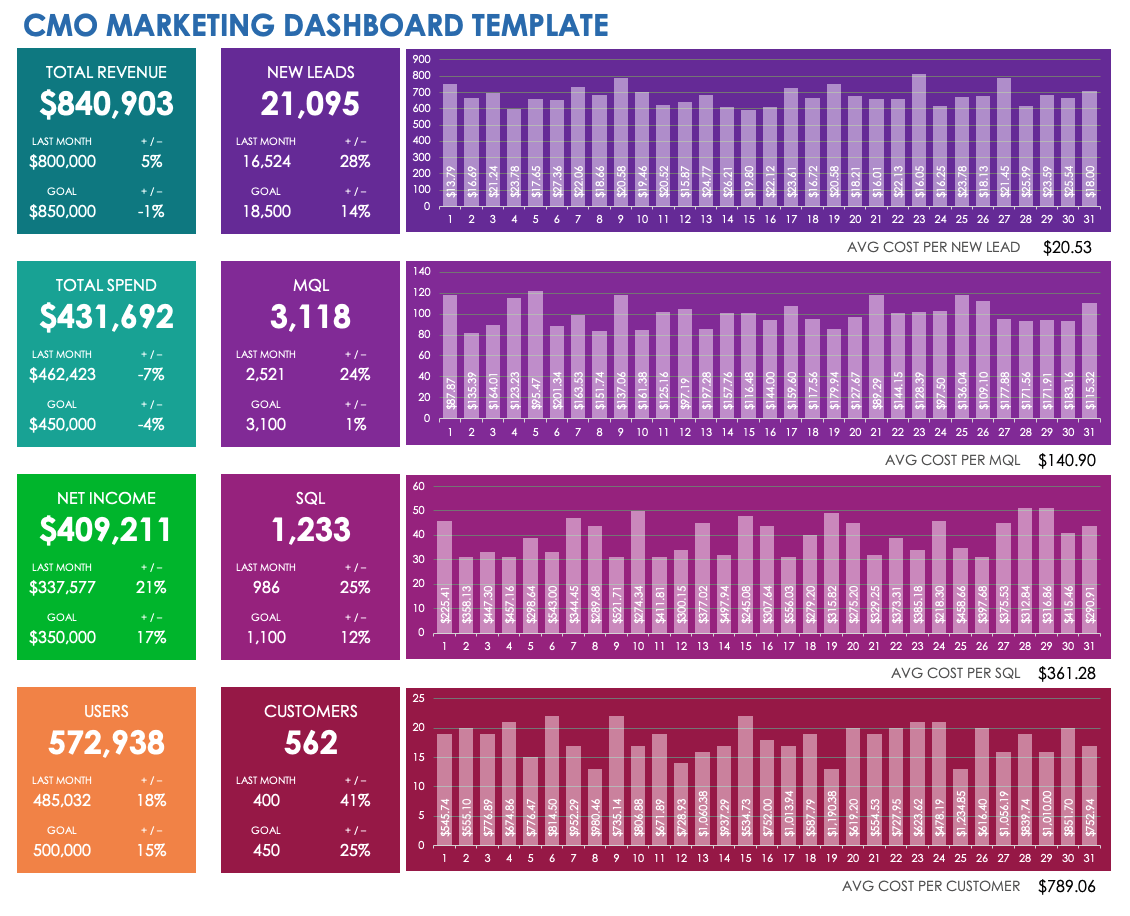
Download CMO Marketing Dashboard Template — Microsoft Excel
This CMO dashboard focuses on customer costs and value, and will automatically calculate total revenue, costs, and net income to give you a broad overview of marketing performance. Graphs provide a visual breakdown of costs versus net income per lead, MQL, SQL, and customer. For each of these four funnel statuses, you can compare current and previous time periods with your aims. Add your numbers for total users, leads, MQLs, SQLs, and customers to see how performance is measuring up along each stage of your marketing funnel.
PPC Marketing Dashboard Template
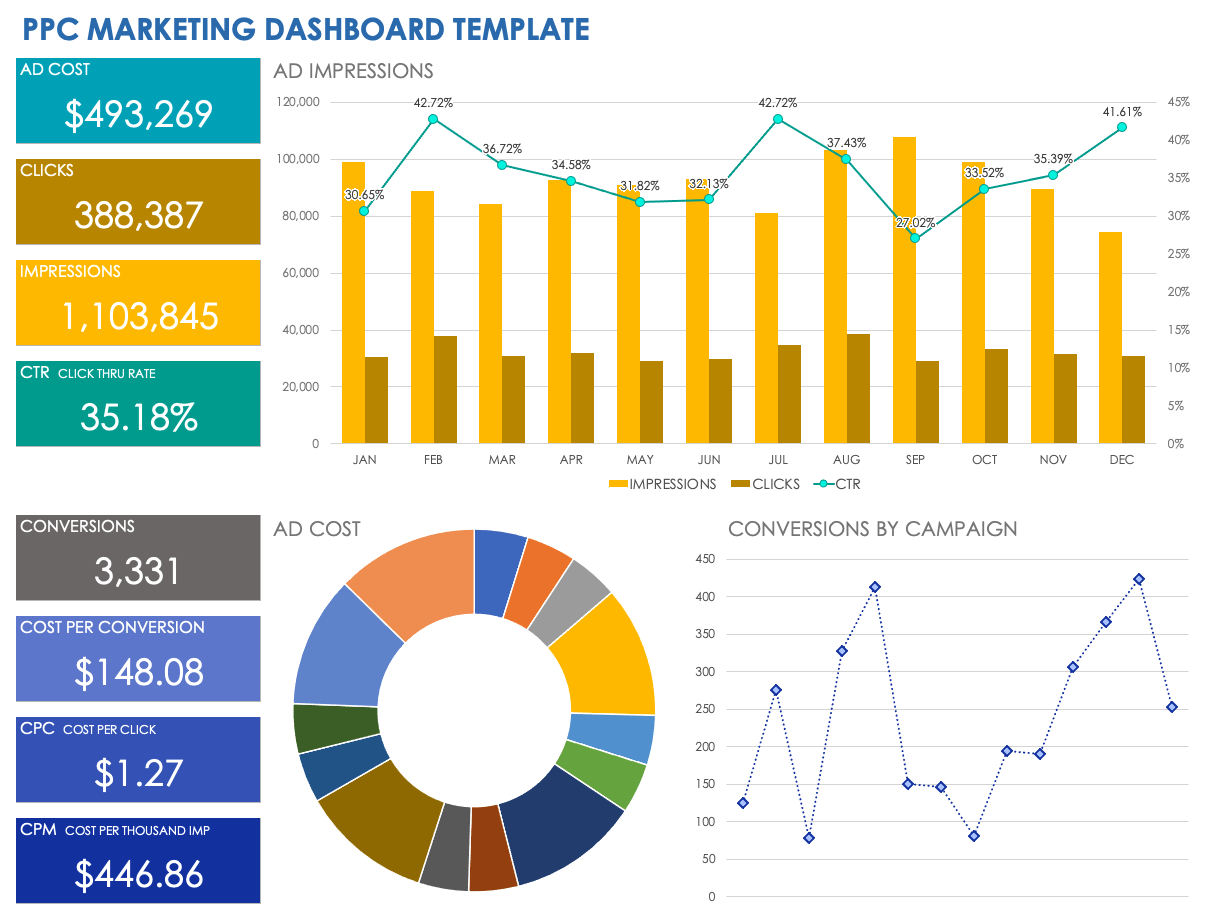
Download PPC Marketing Dashboard Template — Microsoft Excel
This pay-per-click (PPC) dashboard template was designed with Google Ads in mind. Modify the example content to accommodate any PPC marketing campaign, whether you’re using Bing Ads, Facebook Ads, or other PPC ad networks. Use the dashboard as a summary report to show monthly ad performance, top keywords, conversions by campaign, and total ad cost. Compare current and prior time periods concerning impressions, click-through rate (CTR), cost per conversion, cost-per-click (CPC), and cost per thousand impressions (CPM).
Marketing Leads Dashboard Template
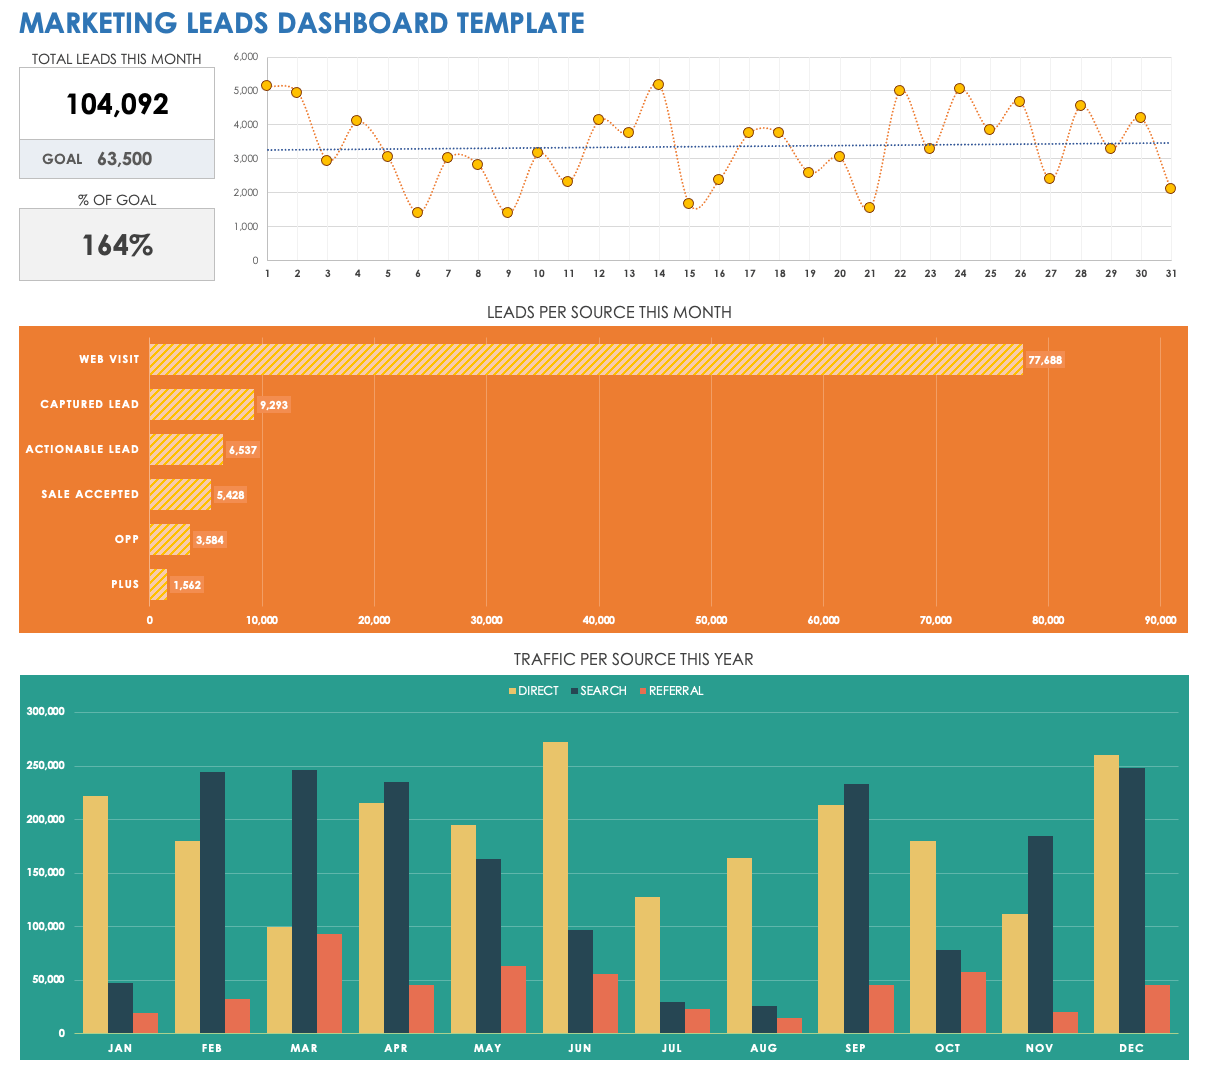
Download Marketing Leads Dashboard Template — Microsoft Excel
Compare total leads in a given month to your consumer goals. Chart daily numbers for new leads as well as monthly pipeline performance, from initial web visits to sales accepted and new opportunities. This dashboard also shows referral, direct, and organic search traffic for each month of the year. Quickly calculate what percentage of your marketing lead target you have reached or exceeded.
What Is a Marketing Dashboard?
A marketing dashboard is a visual display of KPIs and other important metrics that you can use to evaluate marketing performance. For a thorough guide to using and creating effective dashboards, read about the best types of marketing dashboards for your company. To find more free downloads, including sales and marketing dashboard templates, see this roundup of Microsoft Excel dashboard samples and free Excel Dashboard Templates.
