Google Sheets Simple Gantt Chart Template
Download Blank and Sample Versions of the Simple Gantt Chart Template for Google Sheets
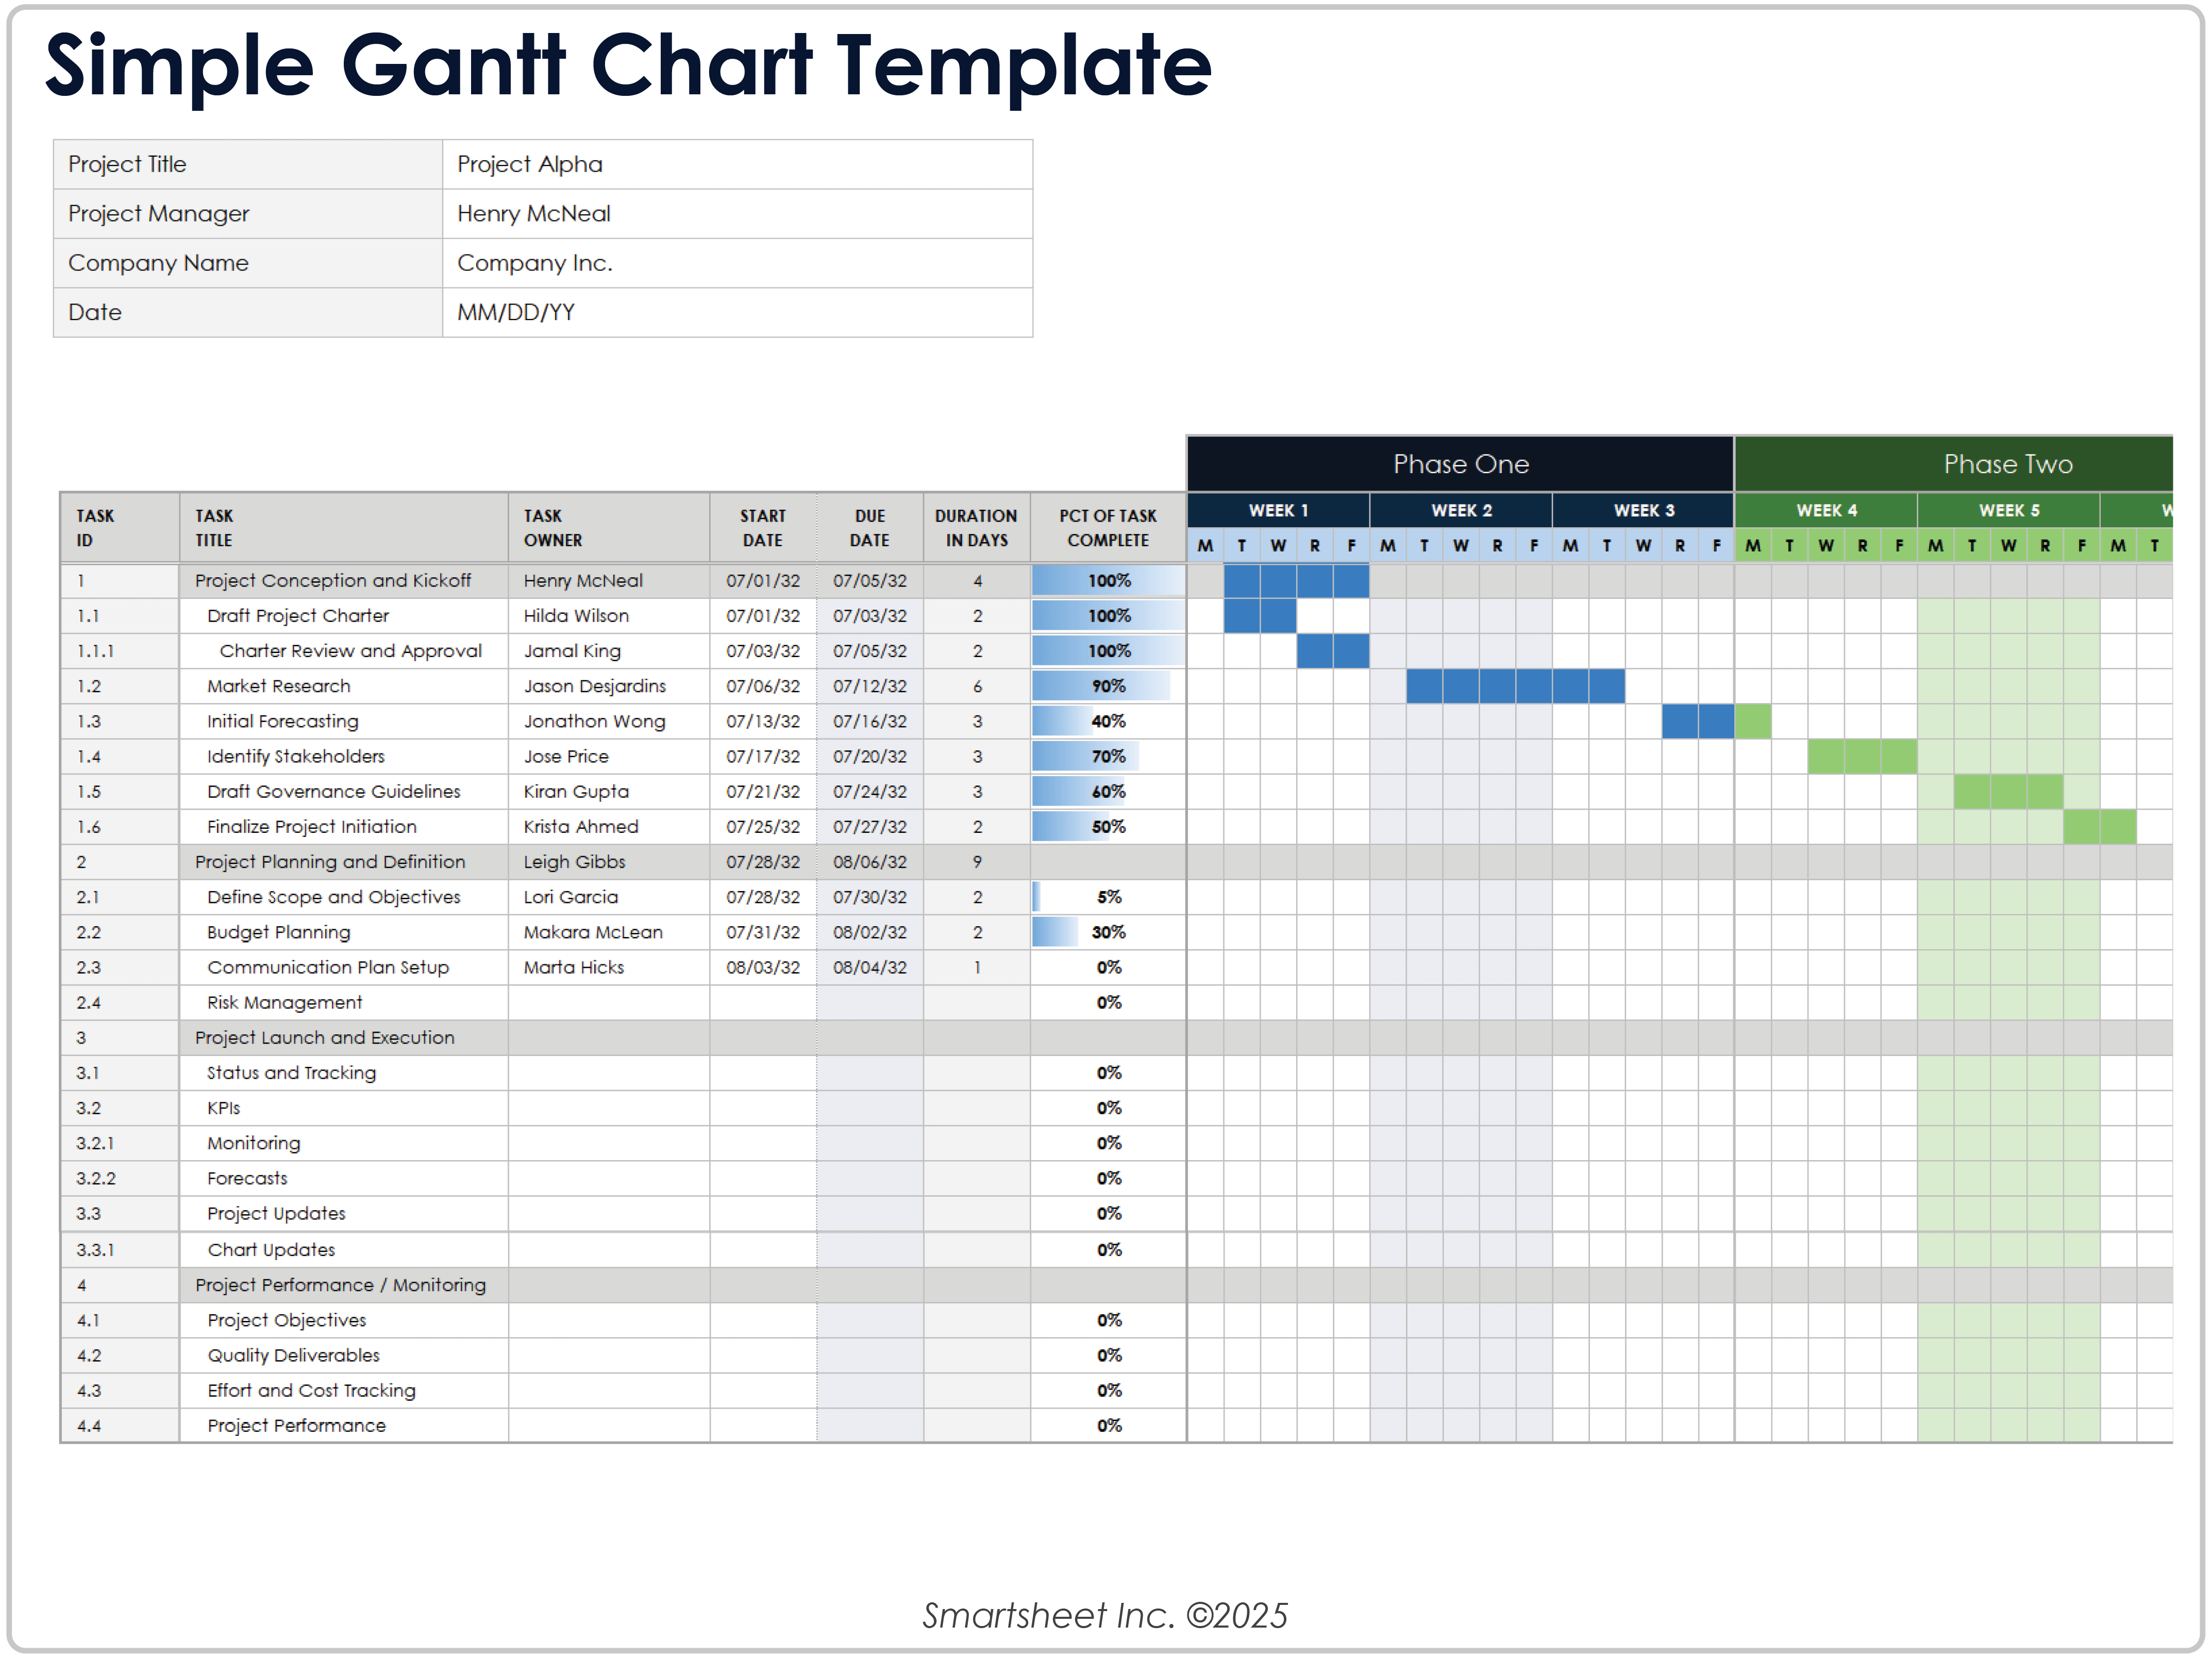
When to Use This Template: This template helps you organize and manage simple projects, timelines, and initiatives, such as documenting and visualizing project tasks across a fixed timeline.
Notable Template Features: This template includes columns for task start and end dates, as well as fields for inputting task titles, owners, and completion percentages charted across a 12-week, four-phase timeline.
Learn how to make a Gantt chart in Google Sheets with a step-by-step guide and video instructions for creating and customizing a Gantt chart.
Google Sheets Advanced Project Gantt Chart Template
Download the Advanced Project Gantt Chart Template for Google Sheets
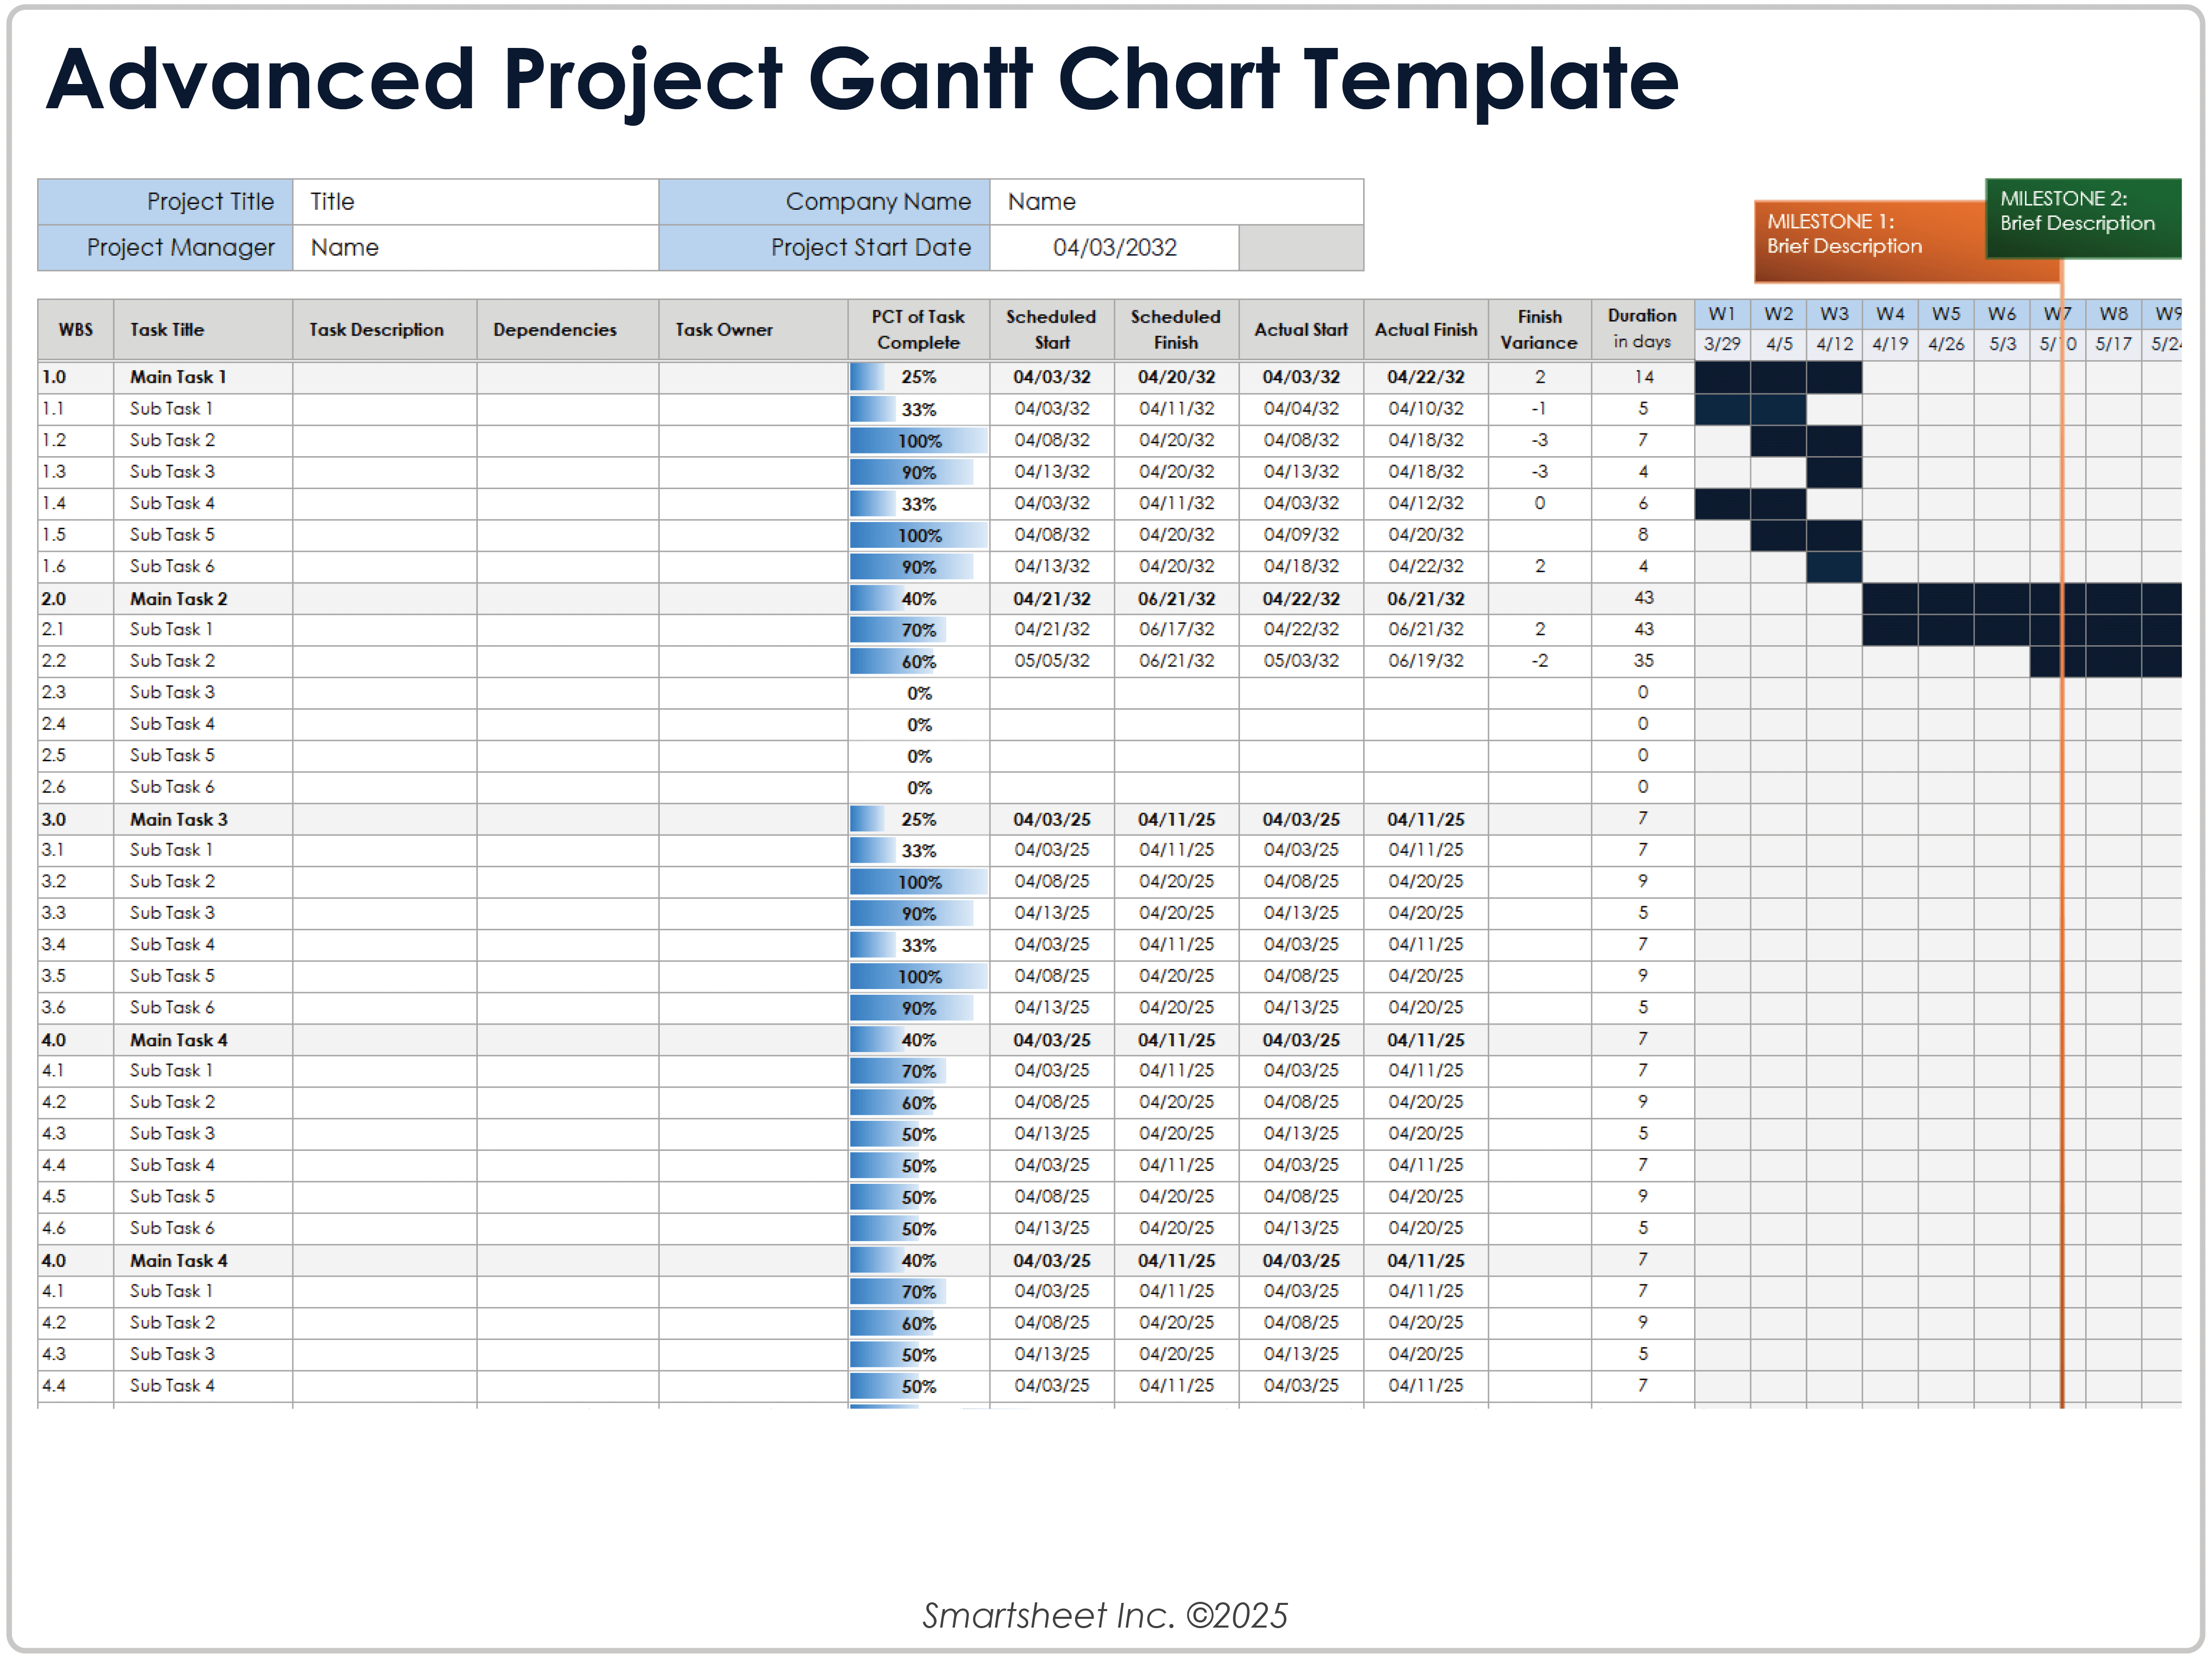
When to Use This Template: This advanced template is ideal for managing a complex project and tracking project phases, tasks, and subtasks. It benefits projects that need clear oversight and a precise structure and timeline.
Notable Template Features: This template features columns for recording the WBS number, task description, owner, and completion percentage. The columns for scheduled and actual start and finish dates calculate the finish variance and duration days to help track task progress.
Check out this guide to learning about, creating, and benefiting from the advantages of work breakdown structures.
Google Sheets Gantt Chart Template with Dependencies
Download the Gantt Chart Template with Dependencies for Google Sheets
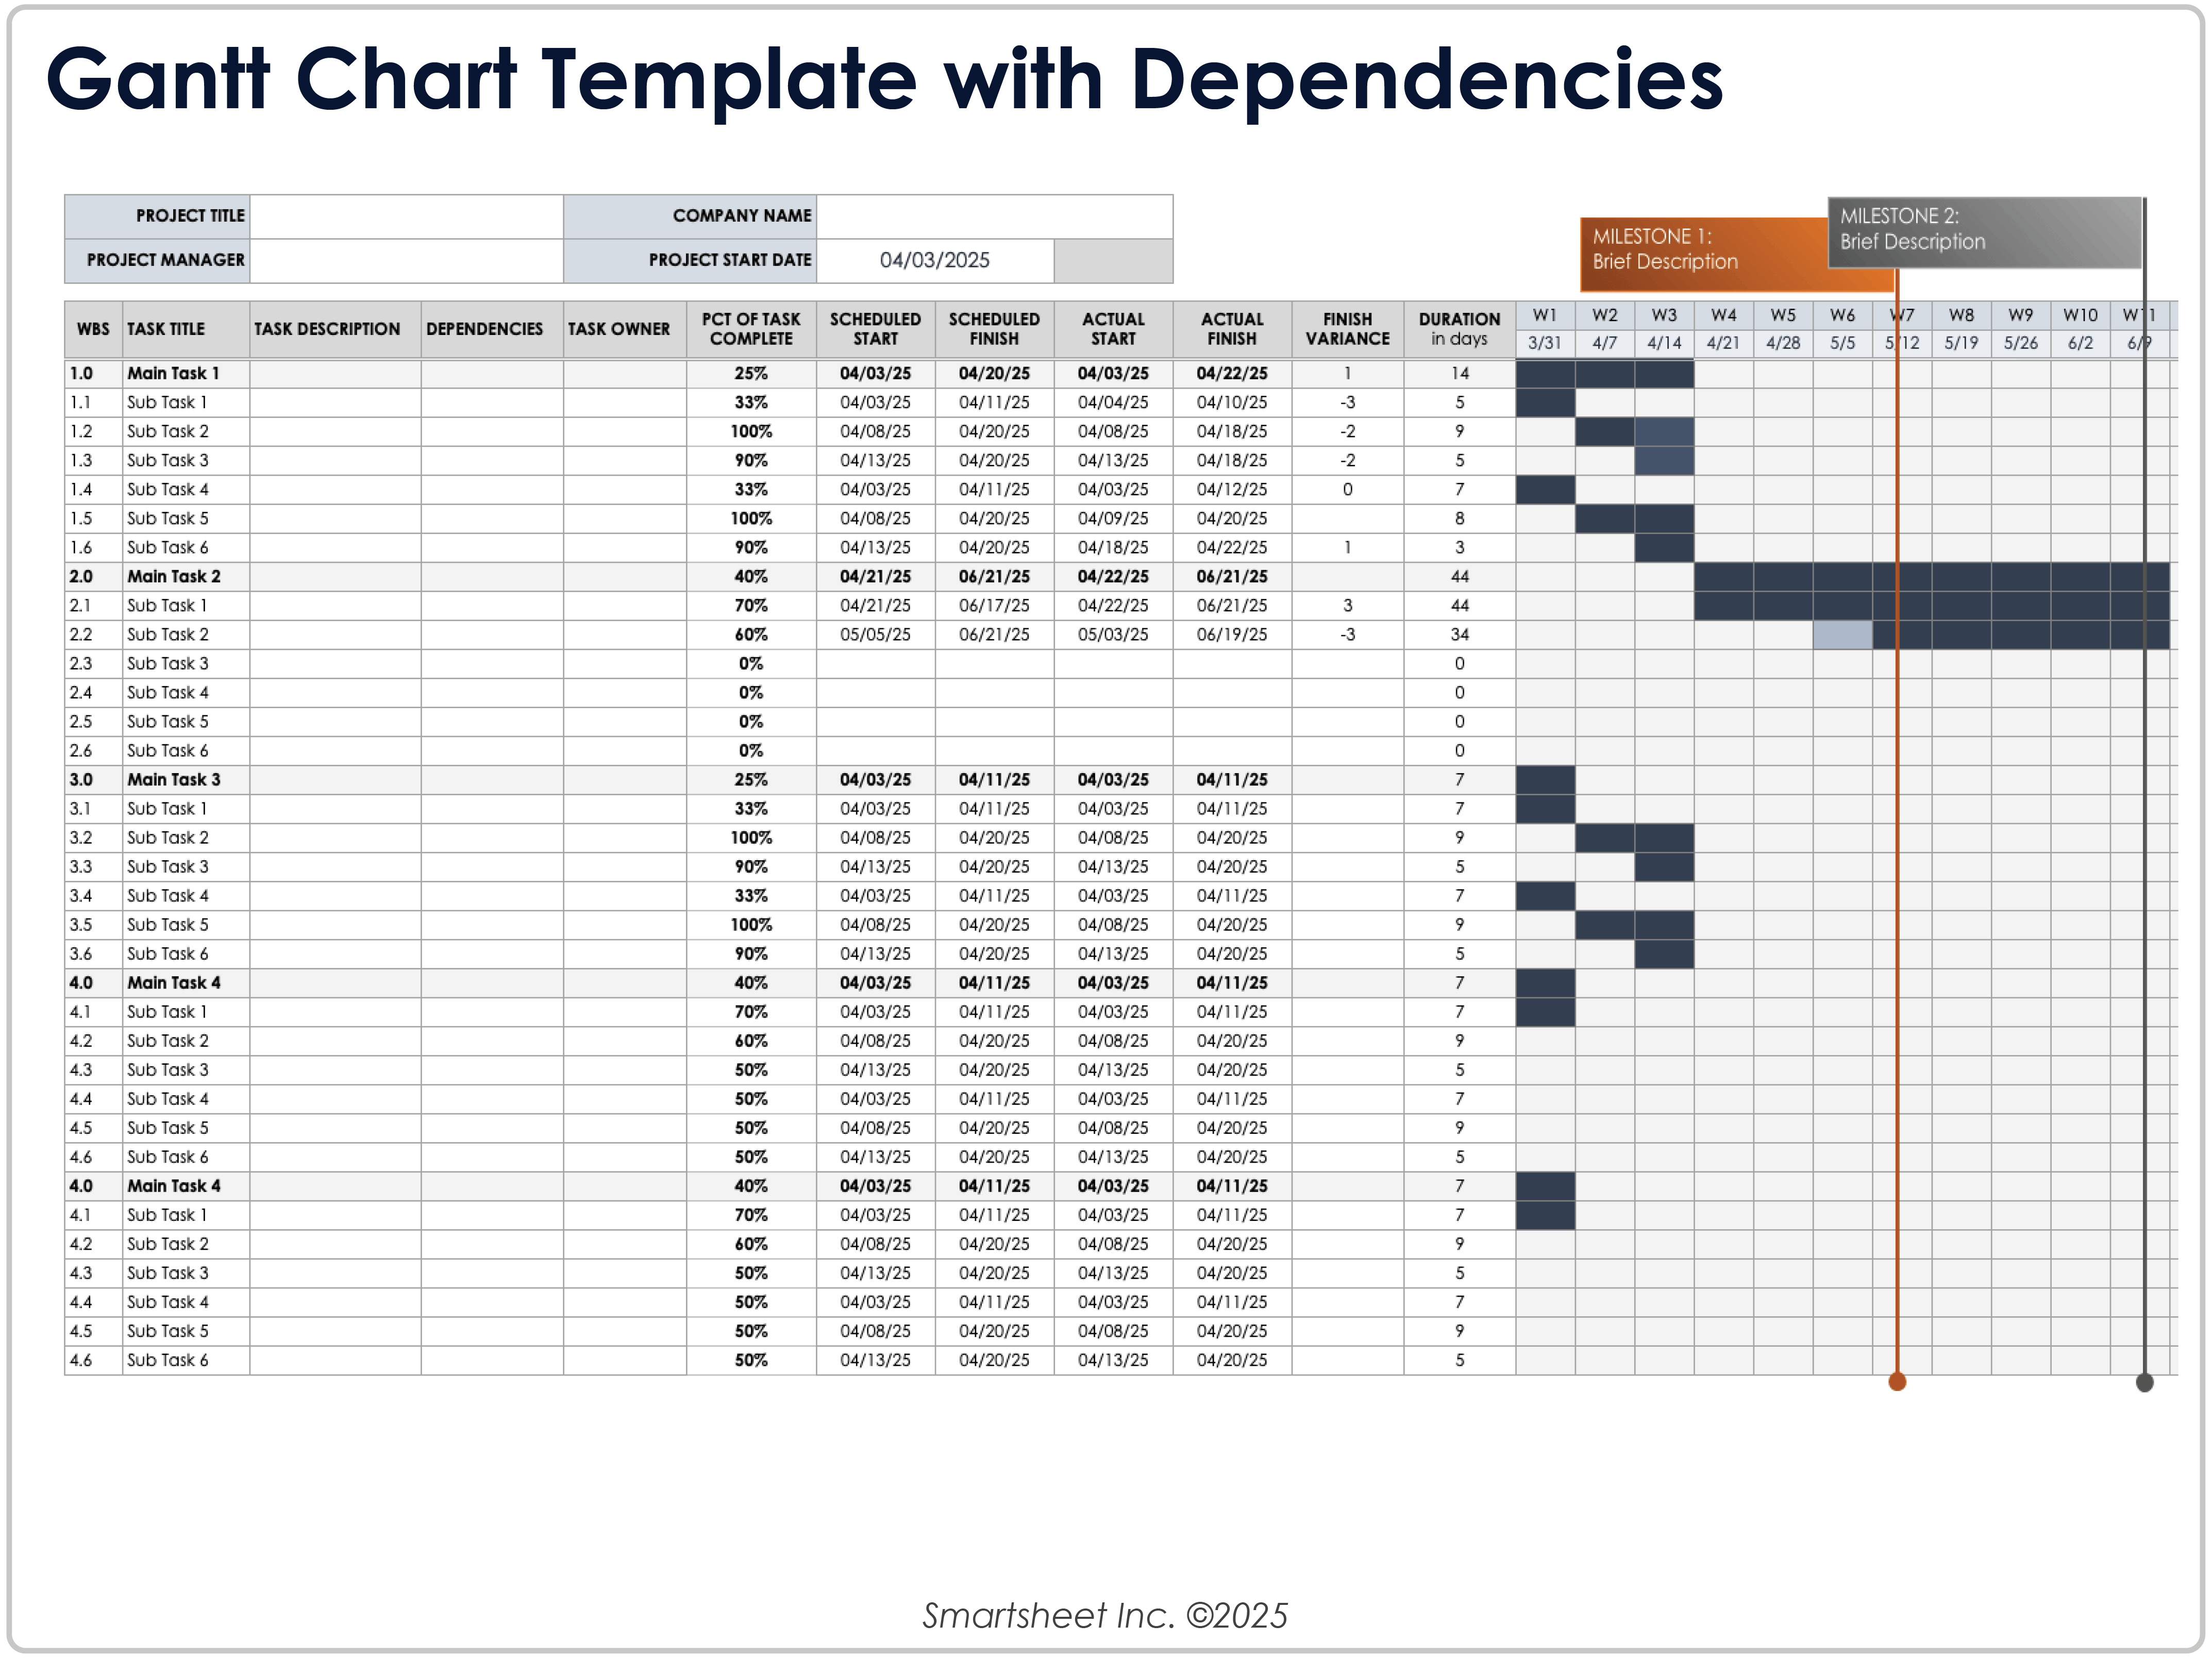
When to Use This Template: This template is ideal for planning and tracking milestones, as well as managing project task sequences and deadlines, to meet project objectives.
Notable Template Features: This template allows you to input descriptions, dependencies, owners, and other data about tasks and subtasks organized by preformatted WBS numbers. It includes variance and duration columns, as well as milestone markers across a 52-week timeline.
Learn more about the definition, benefits, types, and more with this collection of free Gantt chart templates with dependencies.
Google Sheets Scrum Project Management Gantt Chart Template
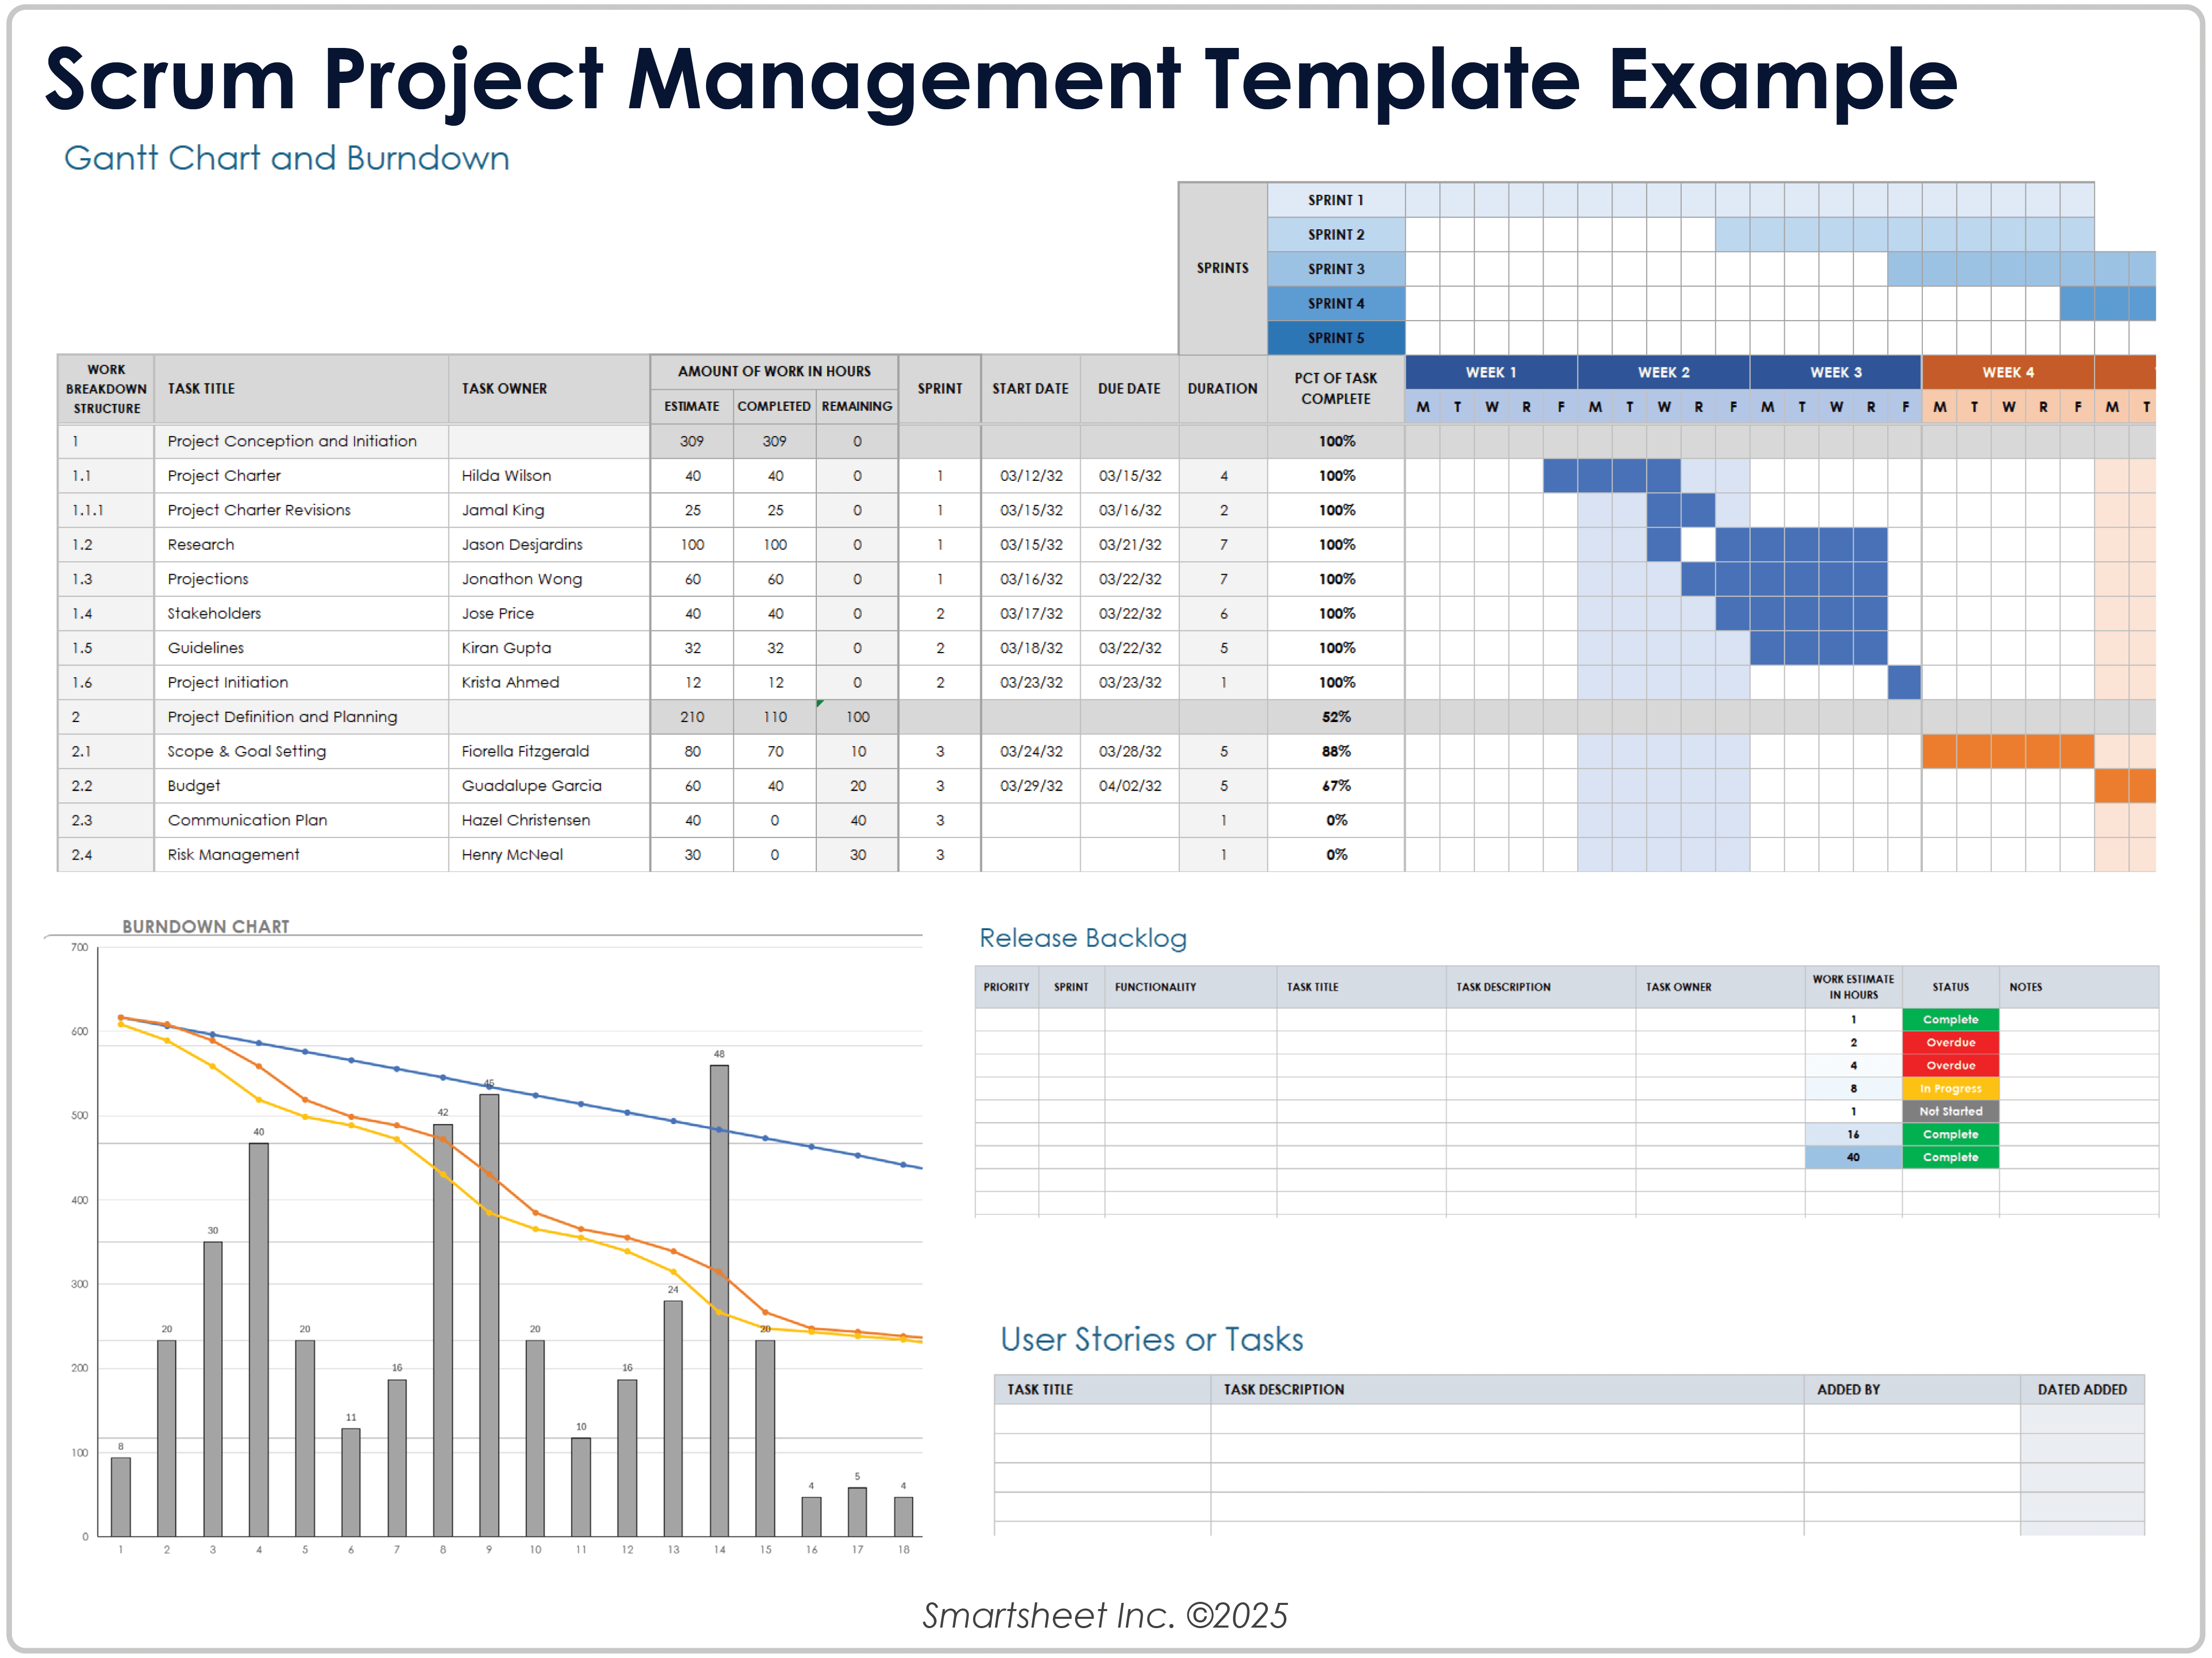
When to Use This Template: This template helps you organize and manage project tasks and sprints. It is ideal for aligning Agile work methods with advanced project planning and management.
Notable Template Features: This template lets you list project tasks with their WBS, sprint numbers, and start and due dates. The burndown chart visualizes and tracks daily hour estimates, completion hours, and remaining hours.
Learn more about Gantt chart functions, components, types, and more with this informative Gantt chart guide.
Google Sheets Construction Project Gantt Chart Template
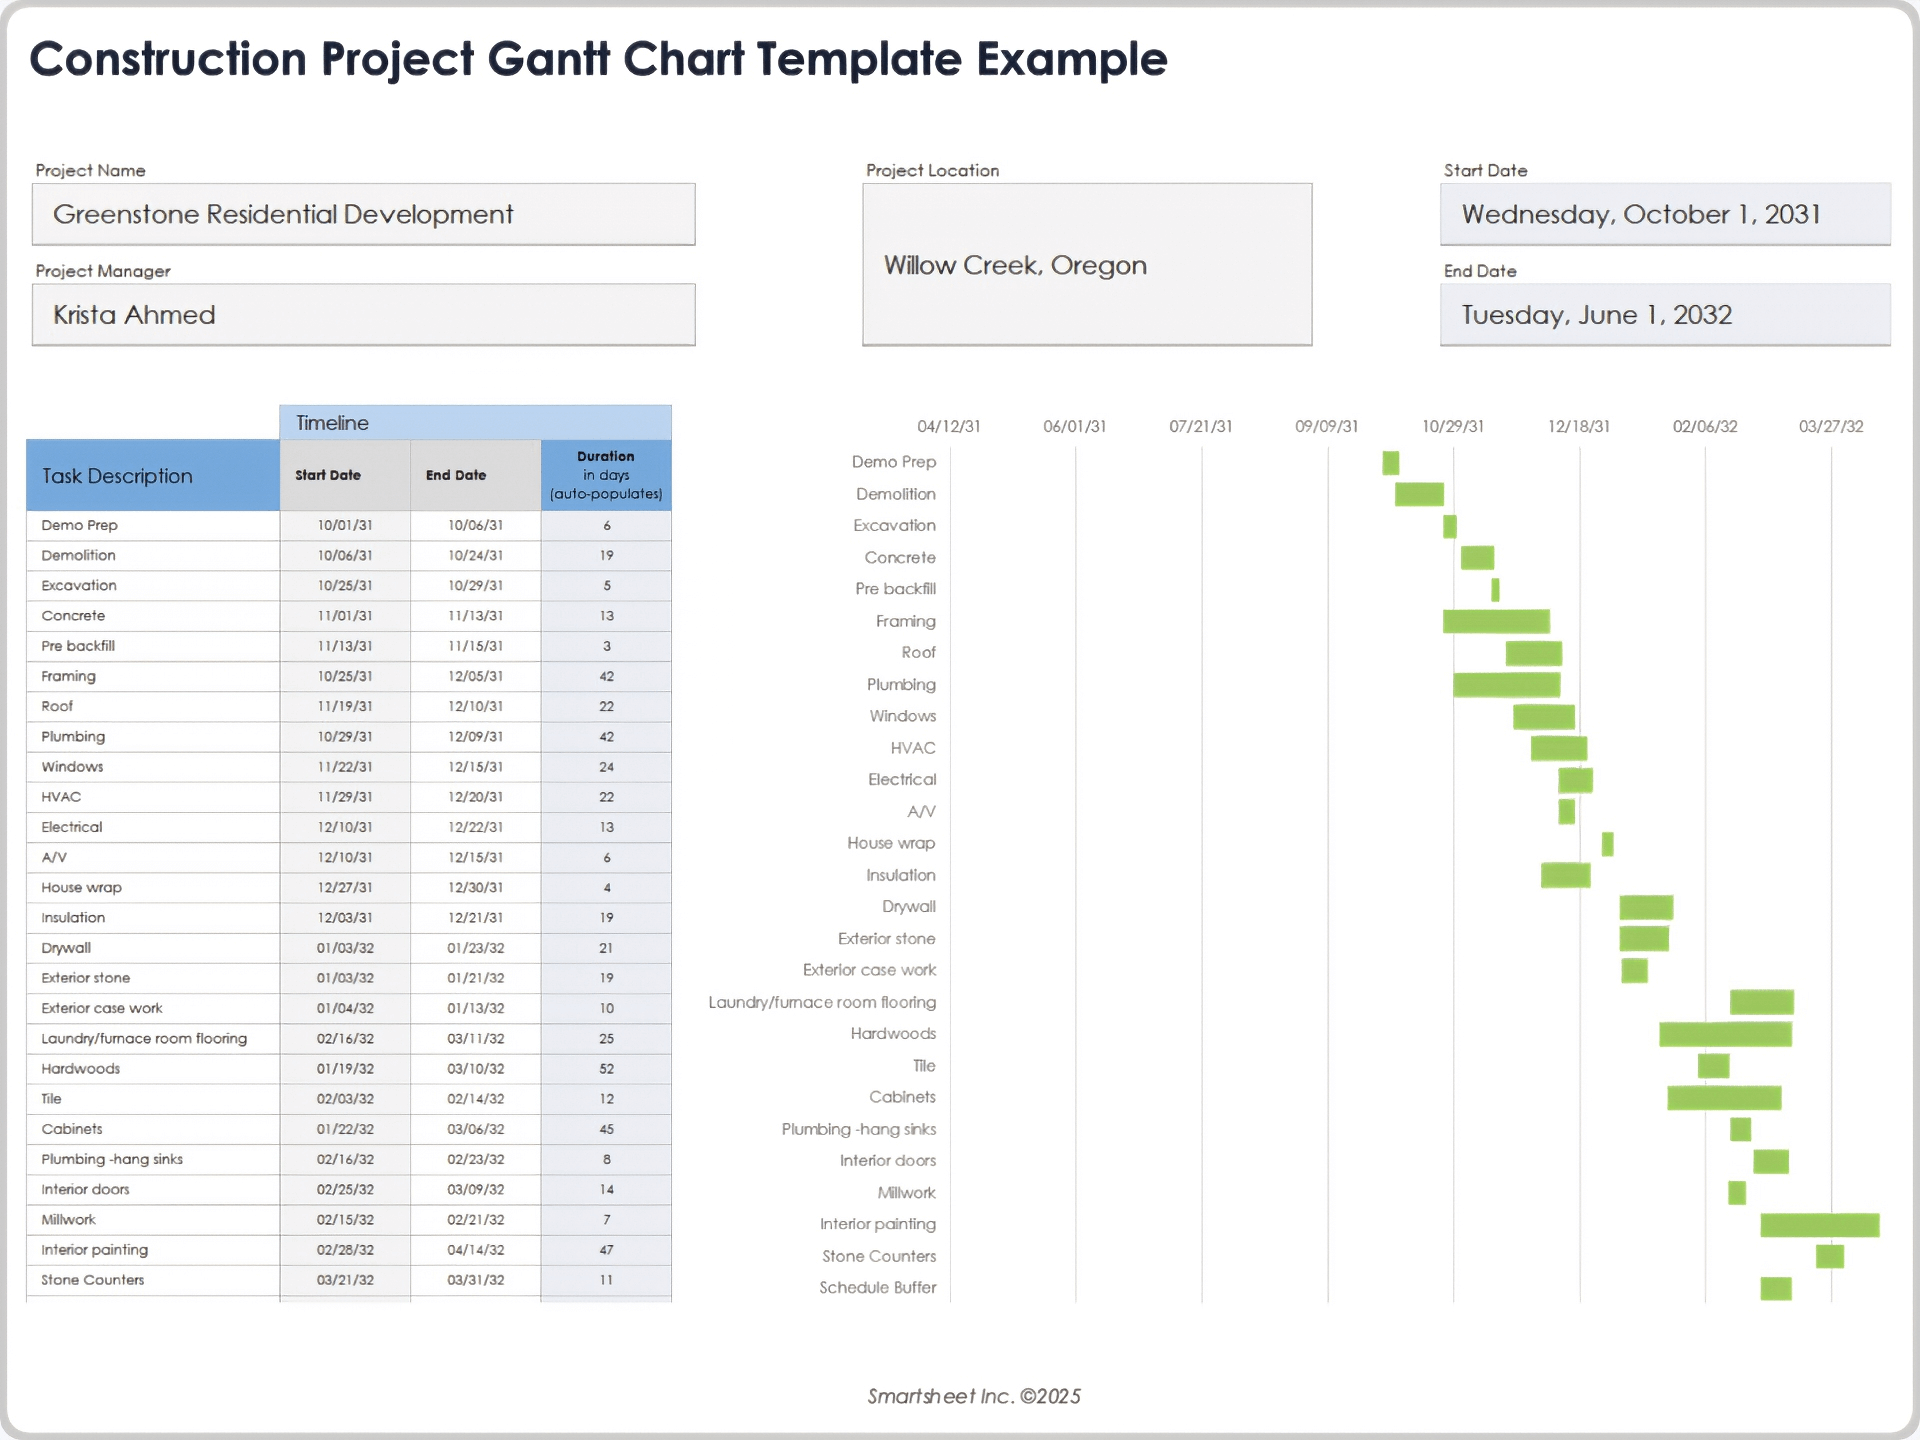
When to Use This Template: This template is ideal for scheduling and tracking construction project tasks. It helps you manage task overlaps and work delays.
Notable Template Features: This template features columns for tracking start dates, end dates, and duration for project tasks. The Gantt chart visualizes timeframes for each task with at-a-glance clarity.
Maximize platform features to meet your needs with this guide on how to create a Gantt chart in Smartsheet.
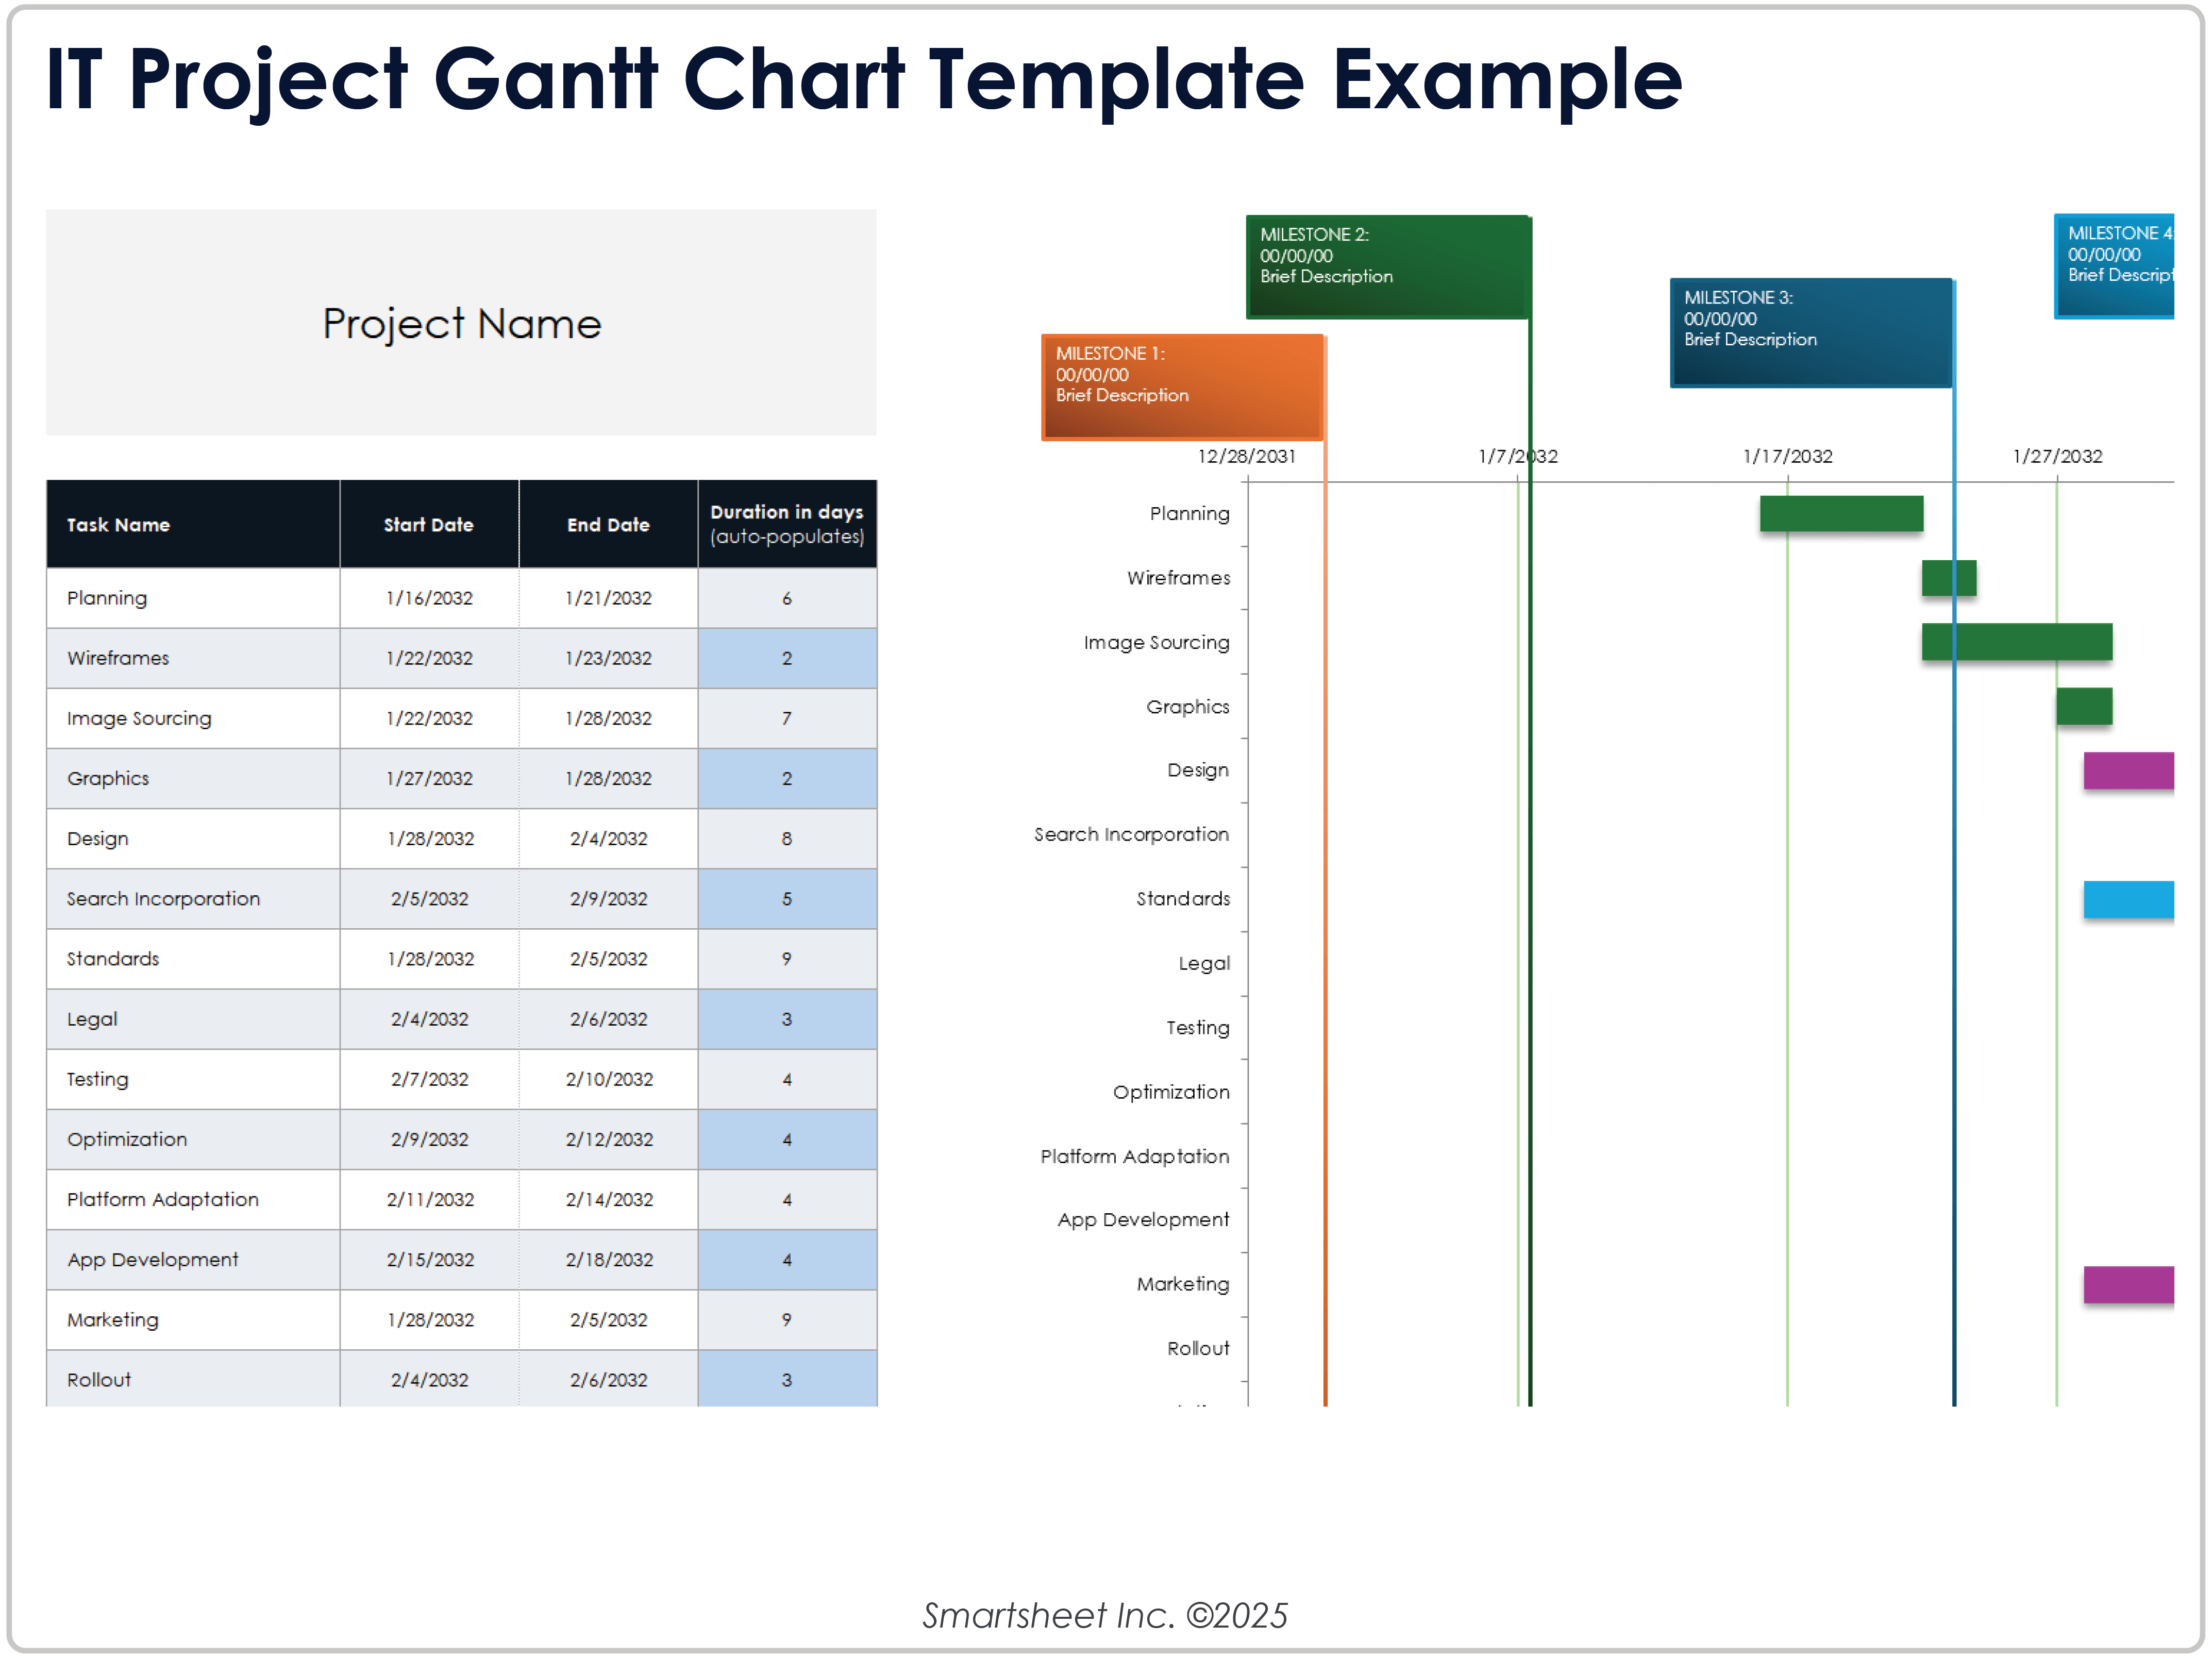
Google Sheets IT Project Gantt Chart Template
Download Blank and Sample Versions of the IT Project Gantt Chart Template for Google Sheets
When to Use This Template: This template is ideal for managing tasks and allocating resources for projects such as IT systems rollouts, infrastructure, and software upgrades.
Notable Template Features: The Gantt chart visualizes task durations across the timeline, and the color-coding aligns with milestone dates and descriptions. This template includes columns for task name, start date, end date, and task duration.
Check out this collection of free Gantt chart templates to help you plan, track, and manage project tasks.
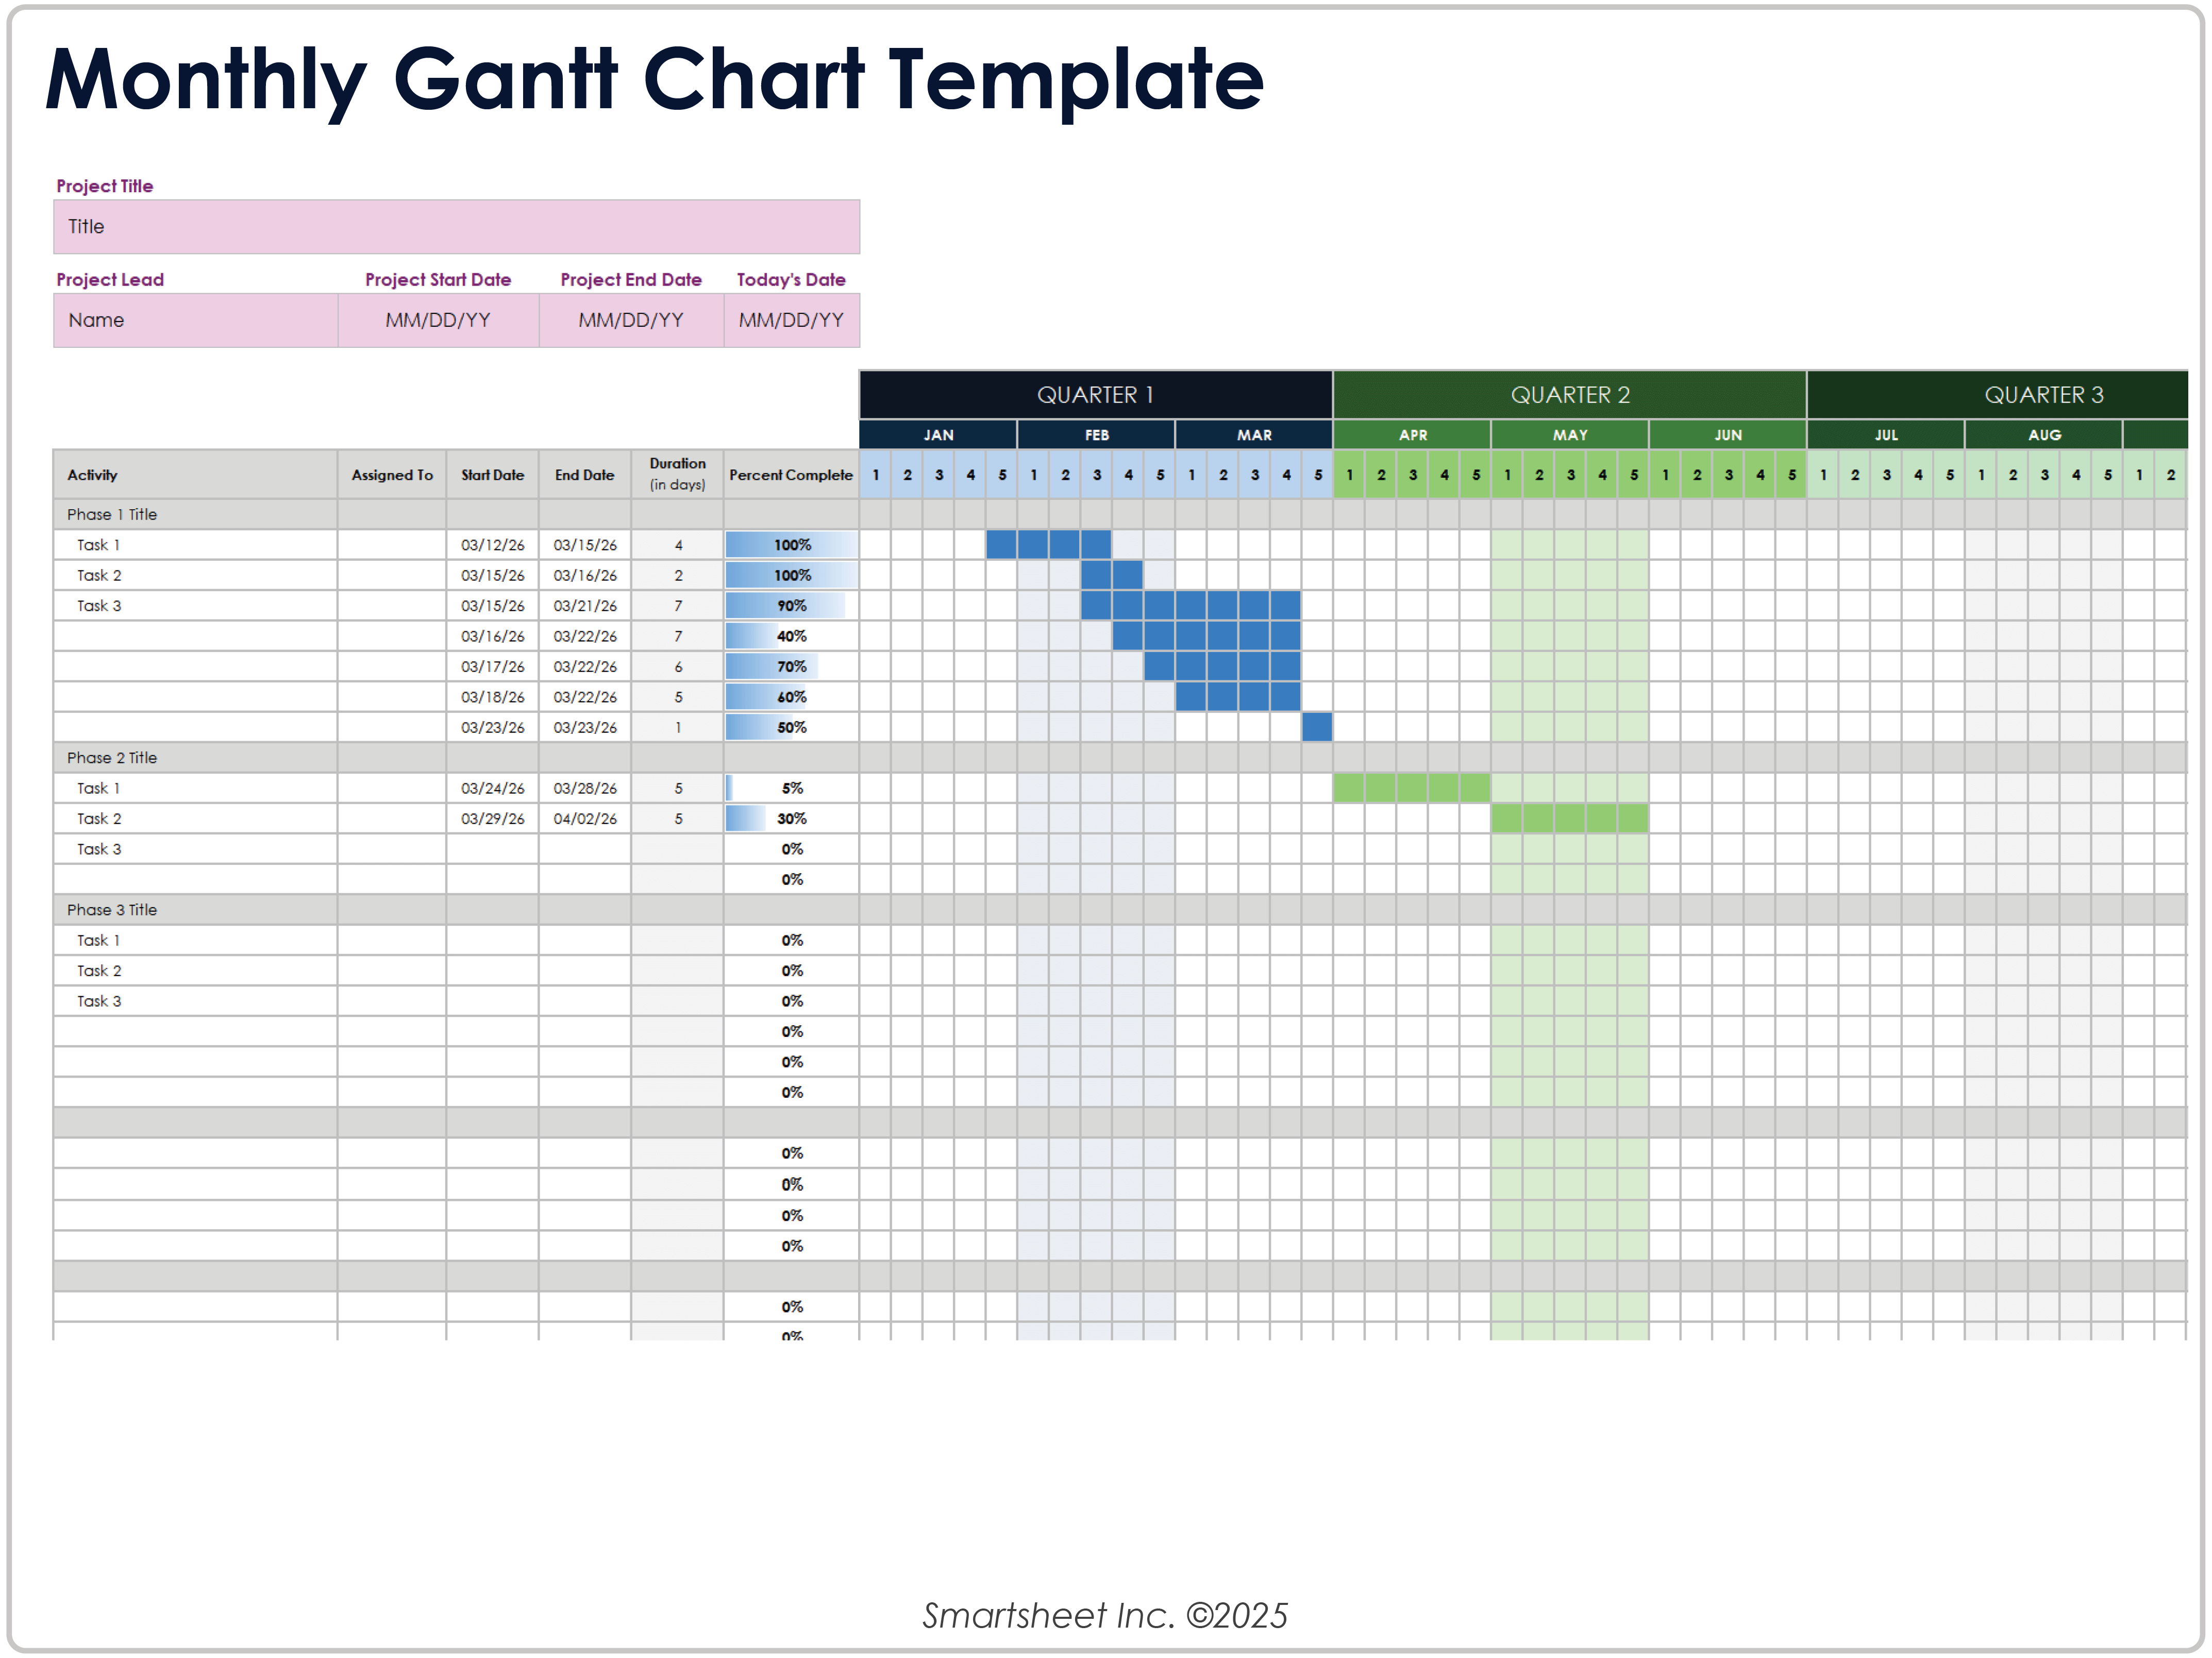
Google Sheets Monthly Gantt Chart Template
Download the Monthly Gantt Chart Template for Google Sheets
When to Use This Template: This Gantt chart template helps you plan and track project phases and tasks, visualize task durations, and outline overall project progress over the course of 12 months.
Notable Template Features: This template includes an Activity column for phases and tasks, along with columns for completion percentage, task assignment, start date, and end date. The chart features a monthly timeline divided into weeks.
Learn more about Gantt chart applications and benefits with this Gantt chart software resource.
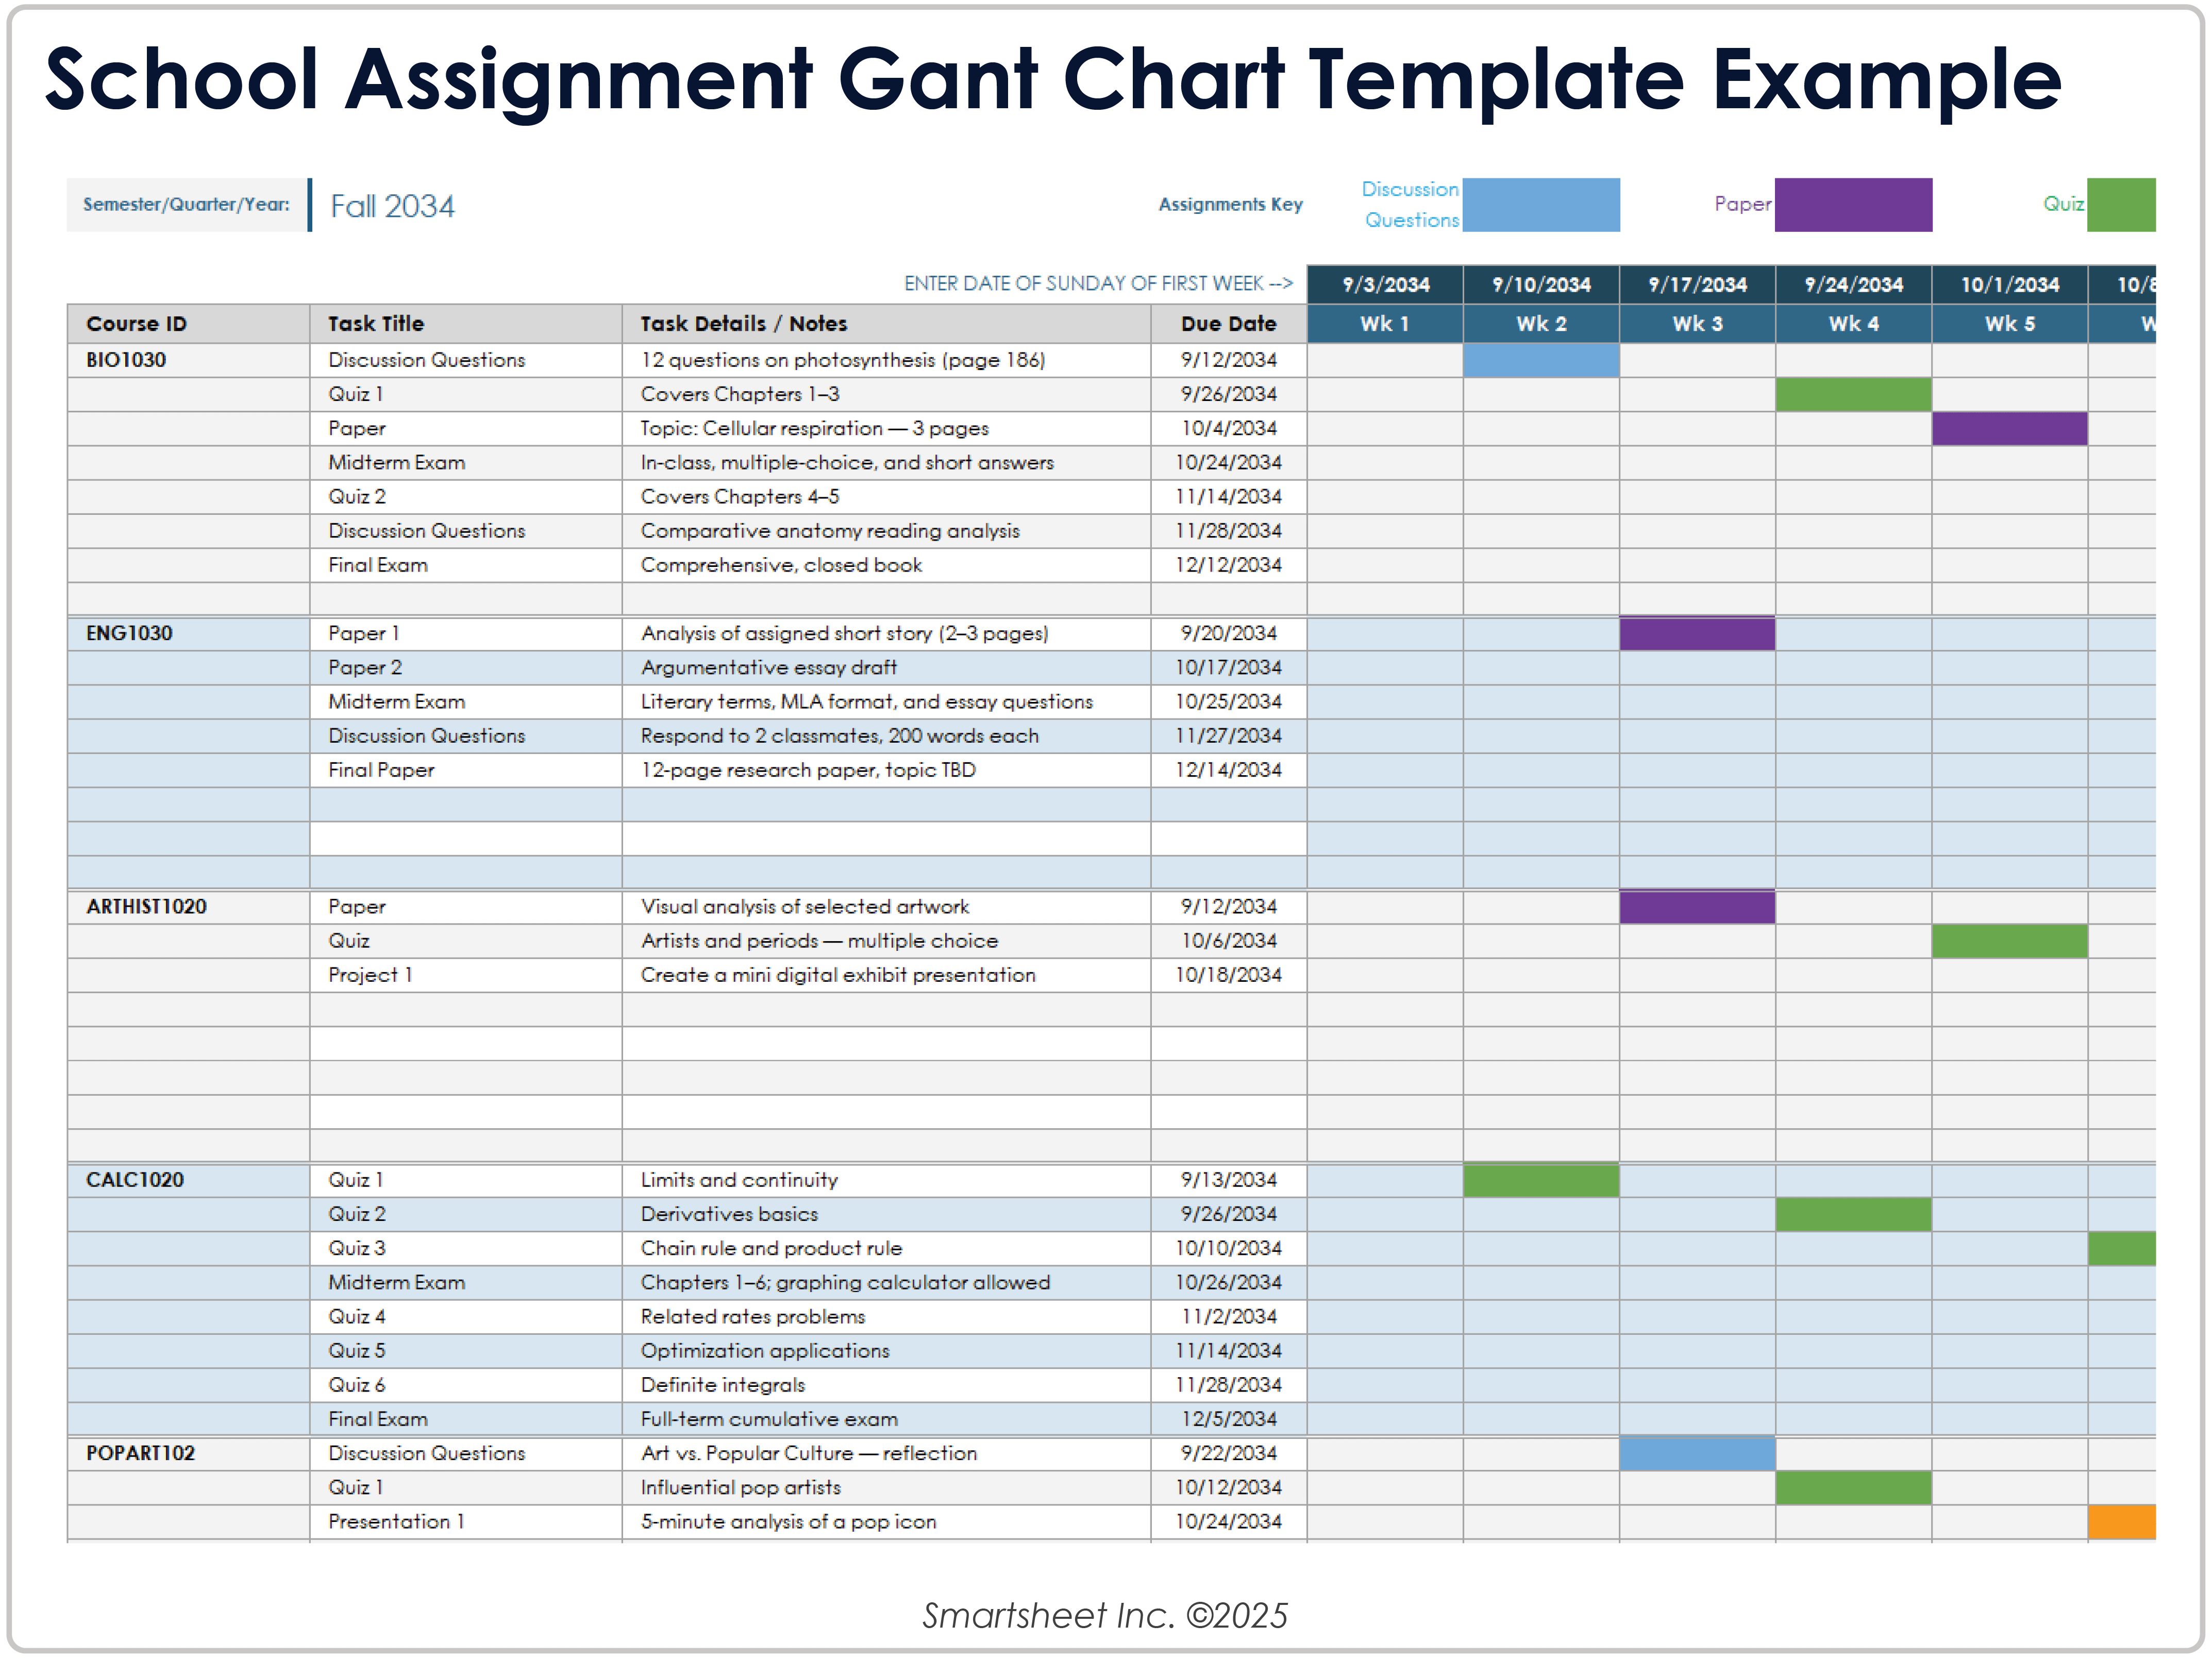
Google Sheets School Assignment Gantt Chart Template
Download Blank and Sample Versions of the School Assignment Gantt Chart Template for Google Sheets
When to Use This Template: Use this template to organize and manage school schedules and assignments, as well as track coursework, projects, and exams for a semester or quarter.
Notable Template Features: This template features columns for entering course ID, task title, details, notes, and due date information. The Gantt chart features color-coded assignments across a 15-week timeline to help track your progress.
Why Use a Google Sheets Gantt Chart Template
A Google Sheets Gantt chart template helps you plan, track, and share your project timeline without complex tools or apps. It updates in real time, simplifies teamwork, and gives you complete control over your data. With built-in tools and easy access, it’s a wise choice for short- and long-term projects.
Below are five key reasons to use a Gantt chart template in Google Sheets:
- Real-Time Collaboration: View and edit the same file simultaneously, reducing back-and-forth emails.
- Cost Savings: Use Google Sheets for free to keep your project on budget while managing timelines effectively.
- Customization: Tailor colors, columns, and formulas to match your workflow and reporting needs.
- Version Control: Track all changes automatically and restore past versions when needed.
- Easy Sharing: Share your chart with clients or partners through a simple link or tiered control access with view or edit rights.
Video: Create a Gantt with a Google Sheets Template

How to Add Content to a Google Sheets Gantt Chart Template
You can use a Gantt chart template in Google Sheets to break down project work into tasks, assign deadlines, and track weekly progress. Enter task details, assign owners, and update start and due dates to keep everyone on track. Colored bars help you see when work starts and ends across the timeline.
Follow these steps to add project content to this simple Google Sheets Gantt chart template:
- Open the simple Gantt chart template for Google Sheets.
- Enter the project title, manager, company, and date in the top-left fields.
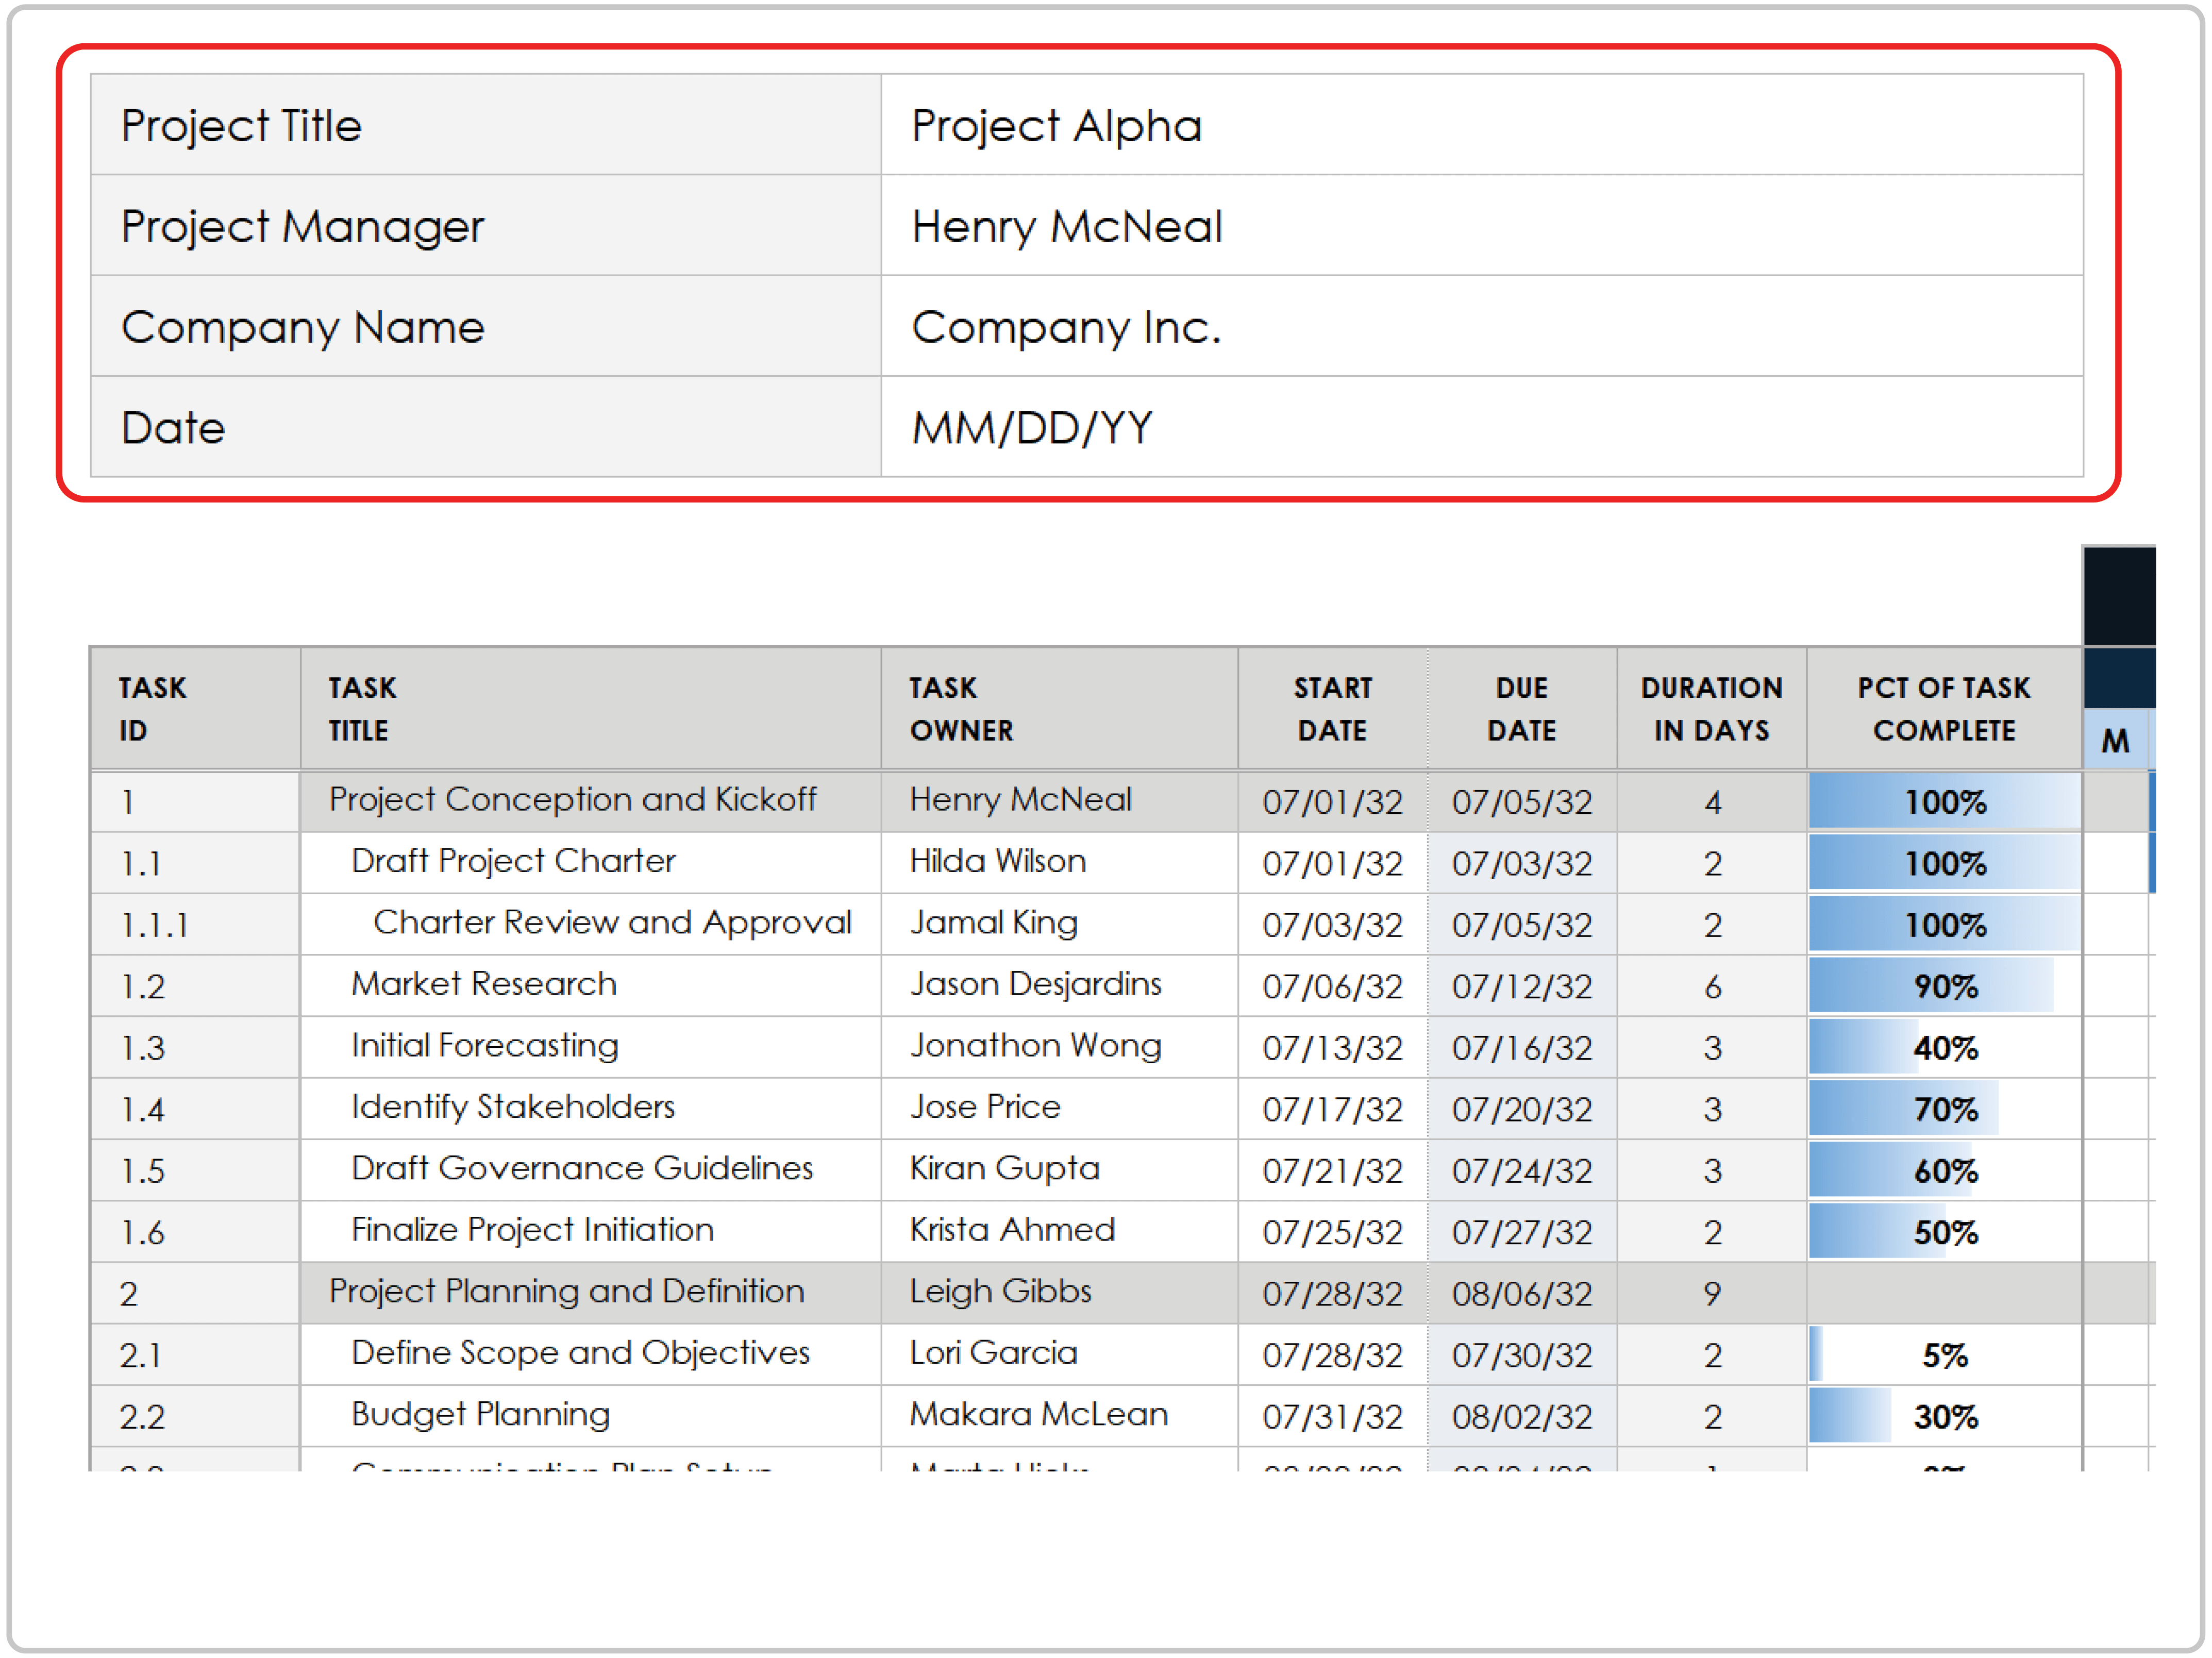
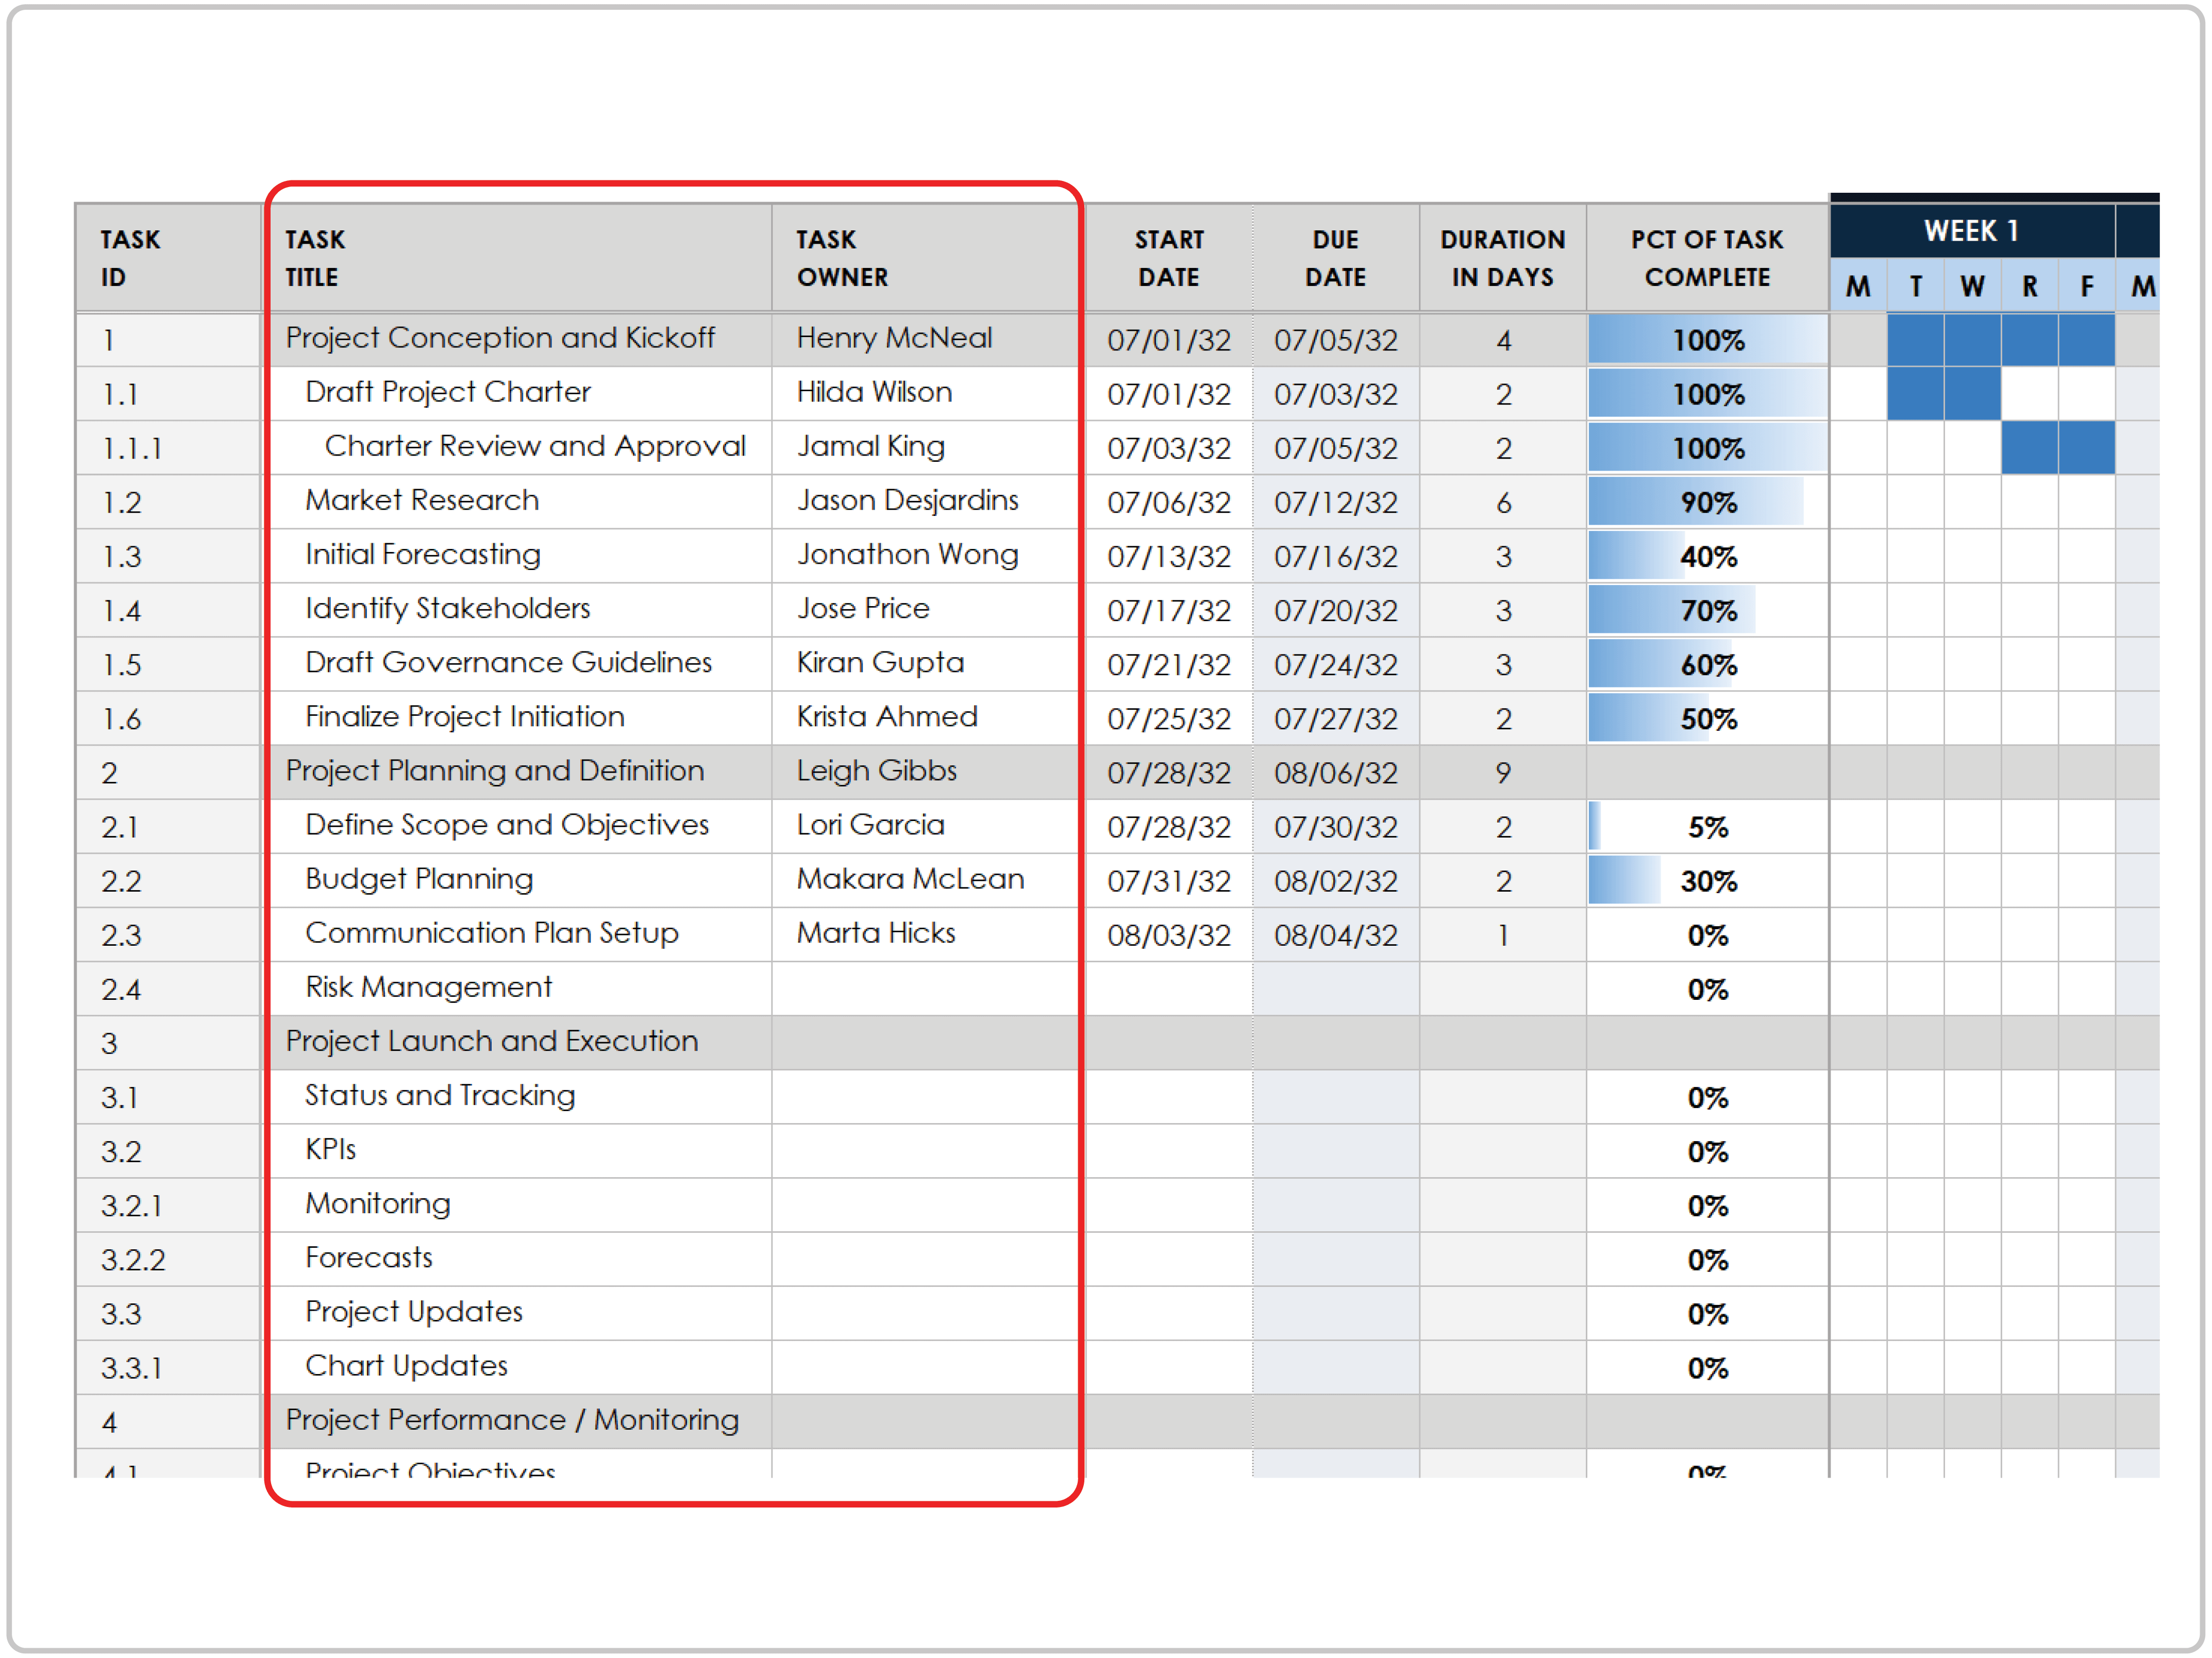
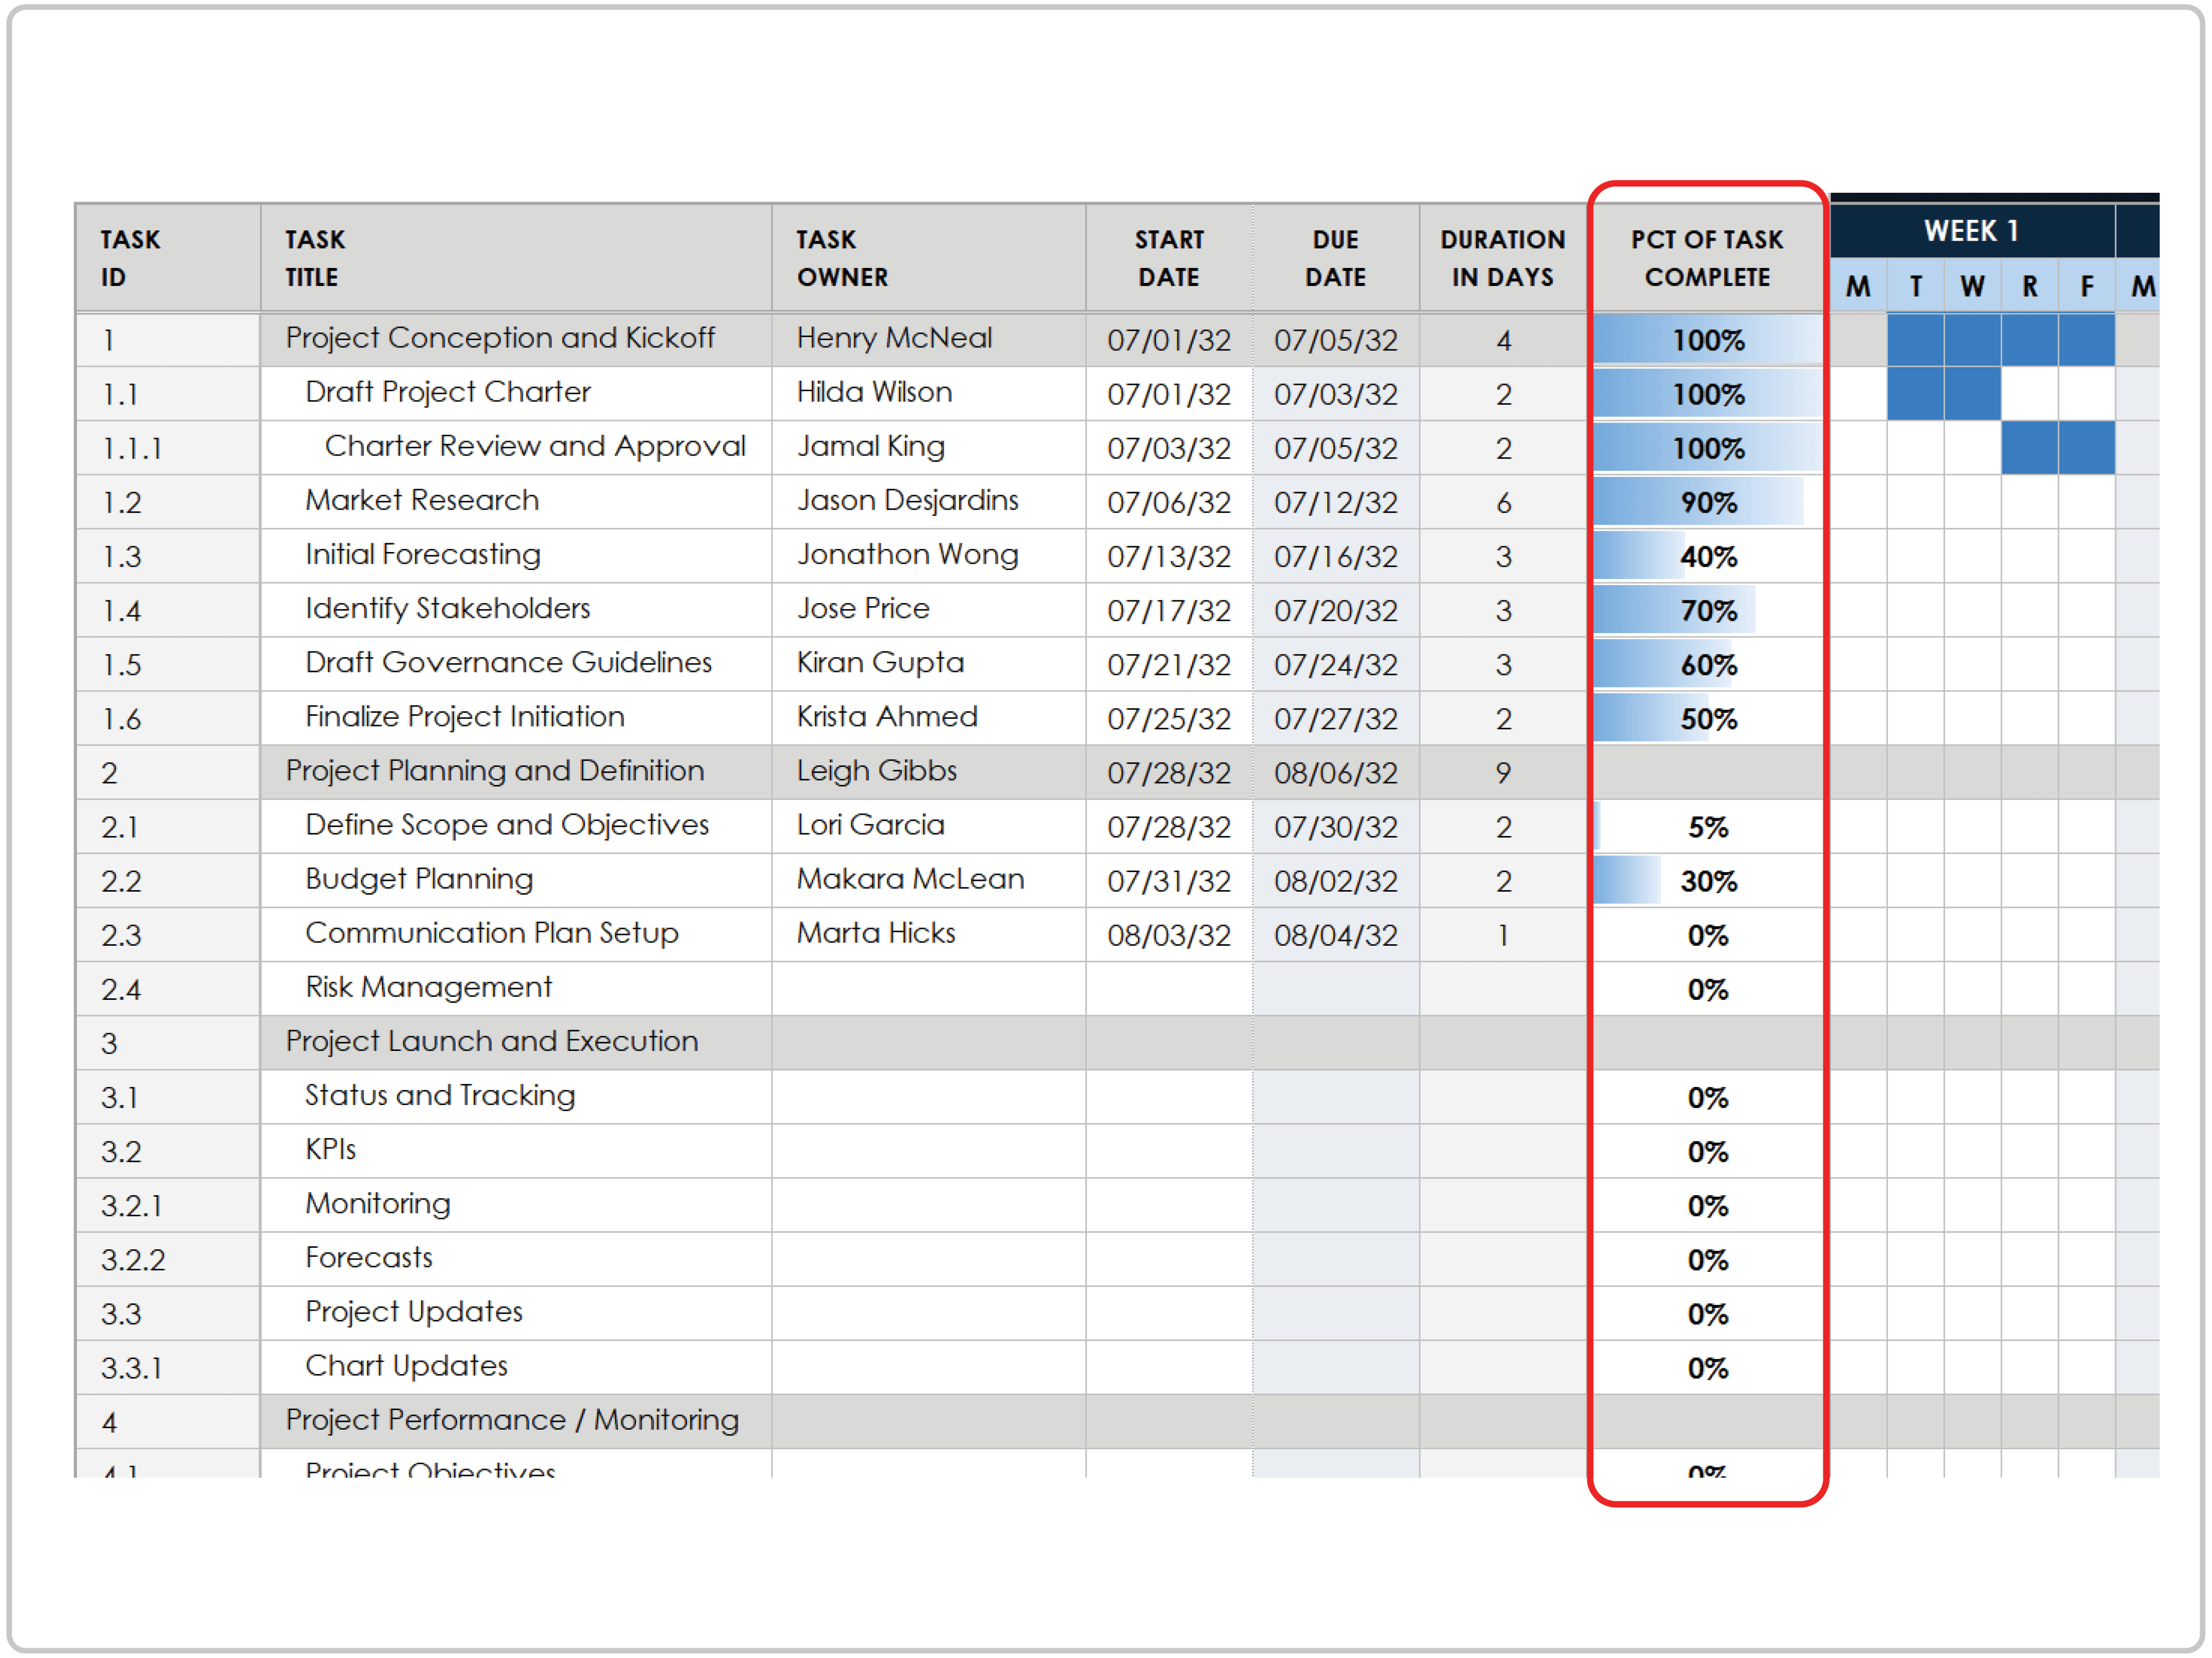
- Enter the task title and owner in the appropriate columns corresponding to each task ID.
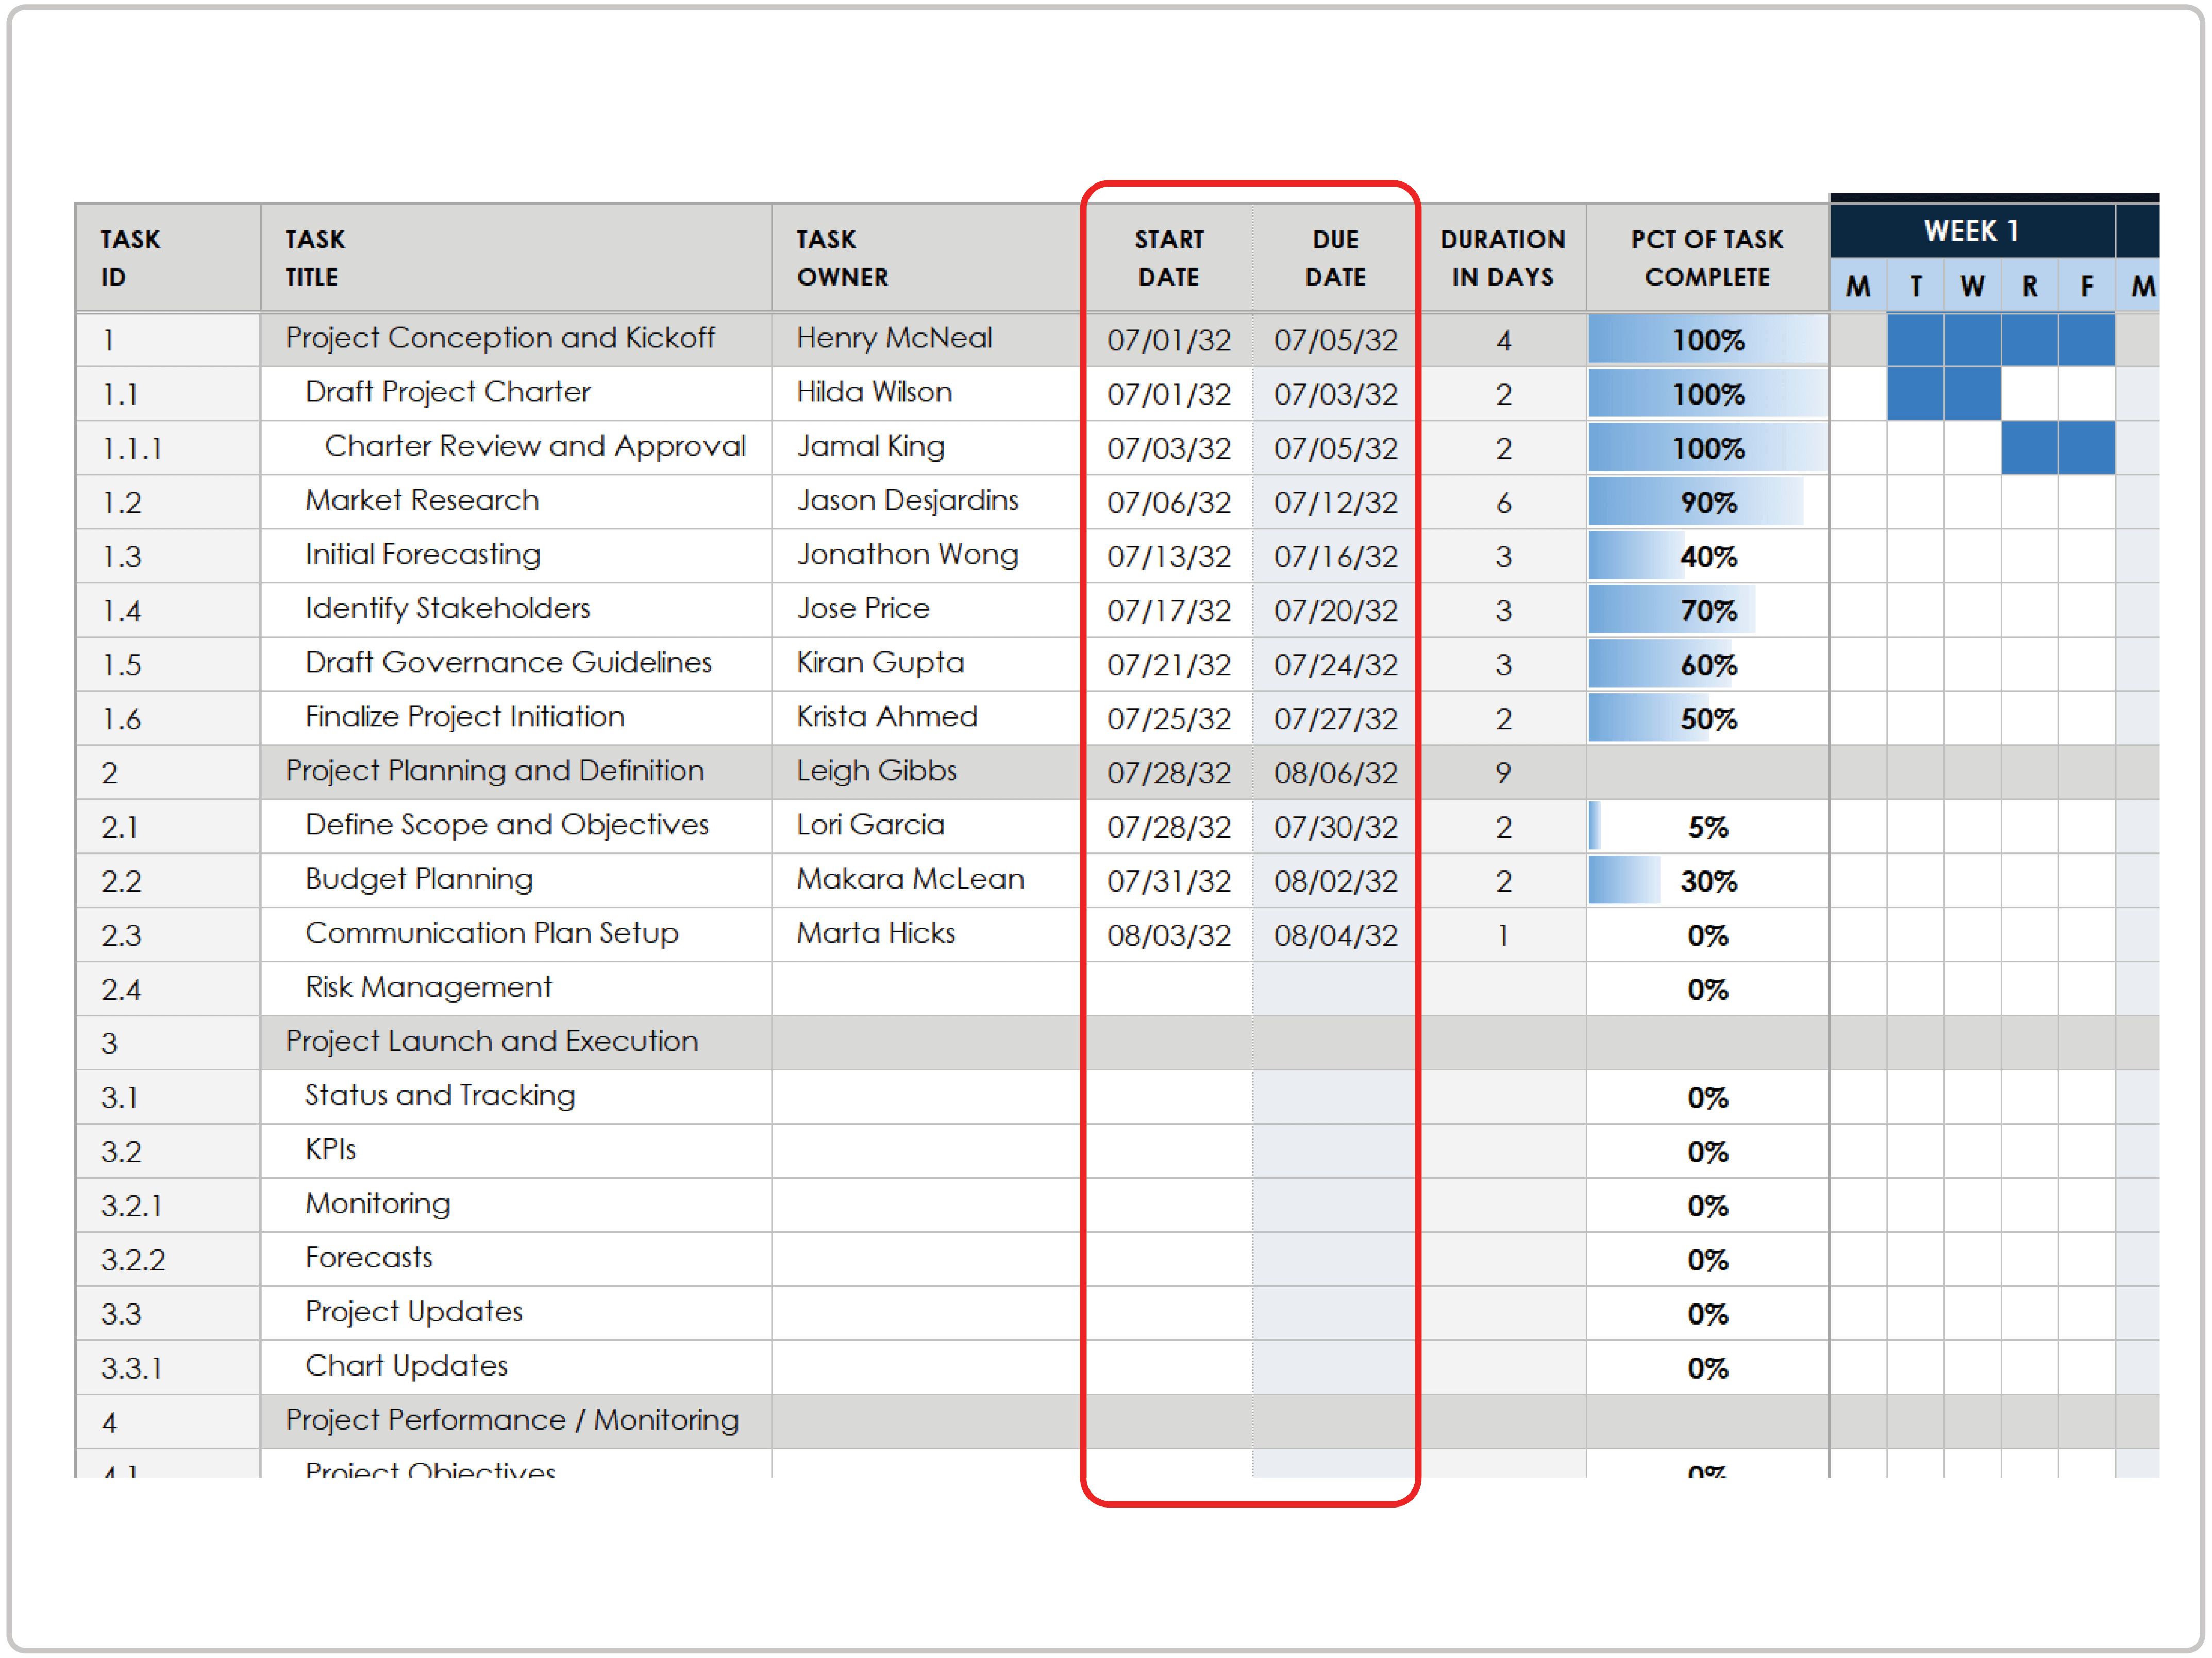
- Enter the start date and due date for each task to determine the length and placement of the Gantt bars.
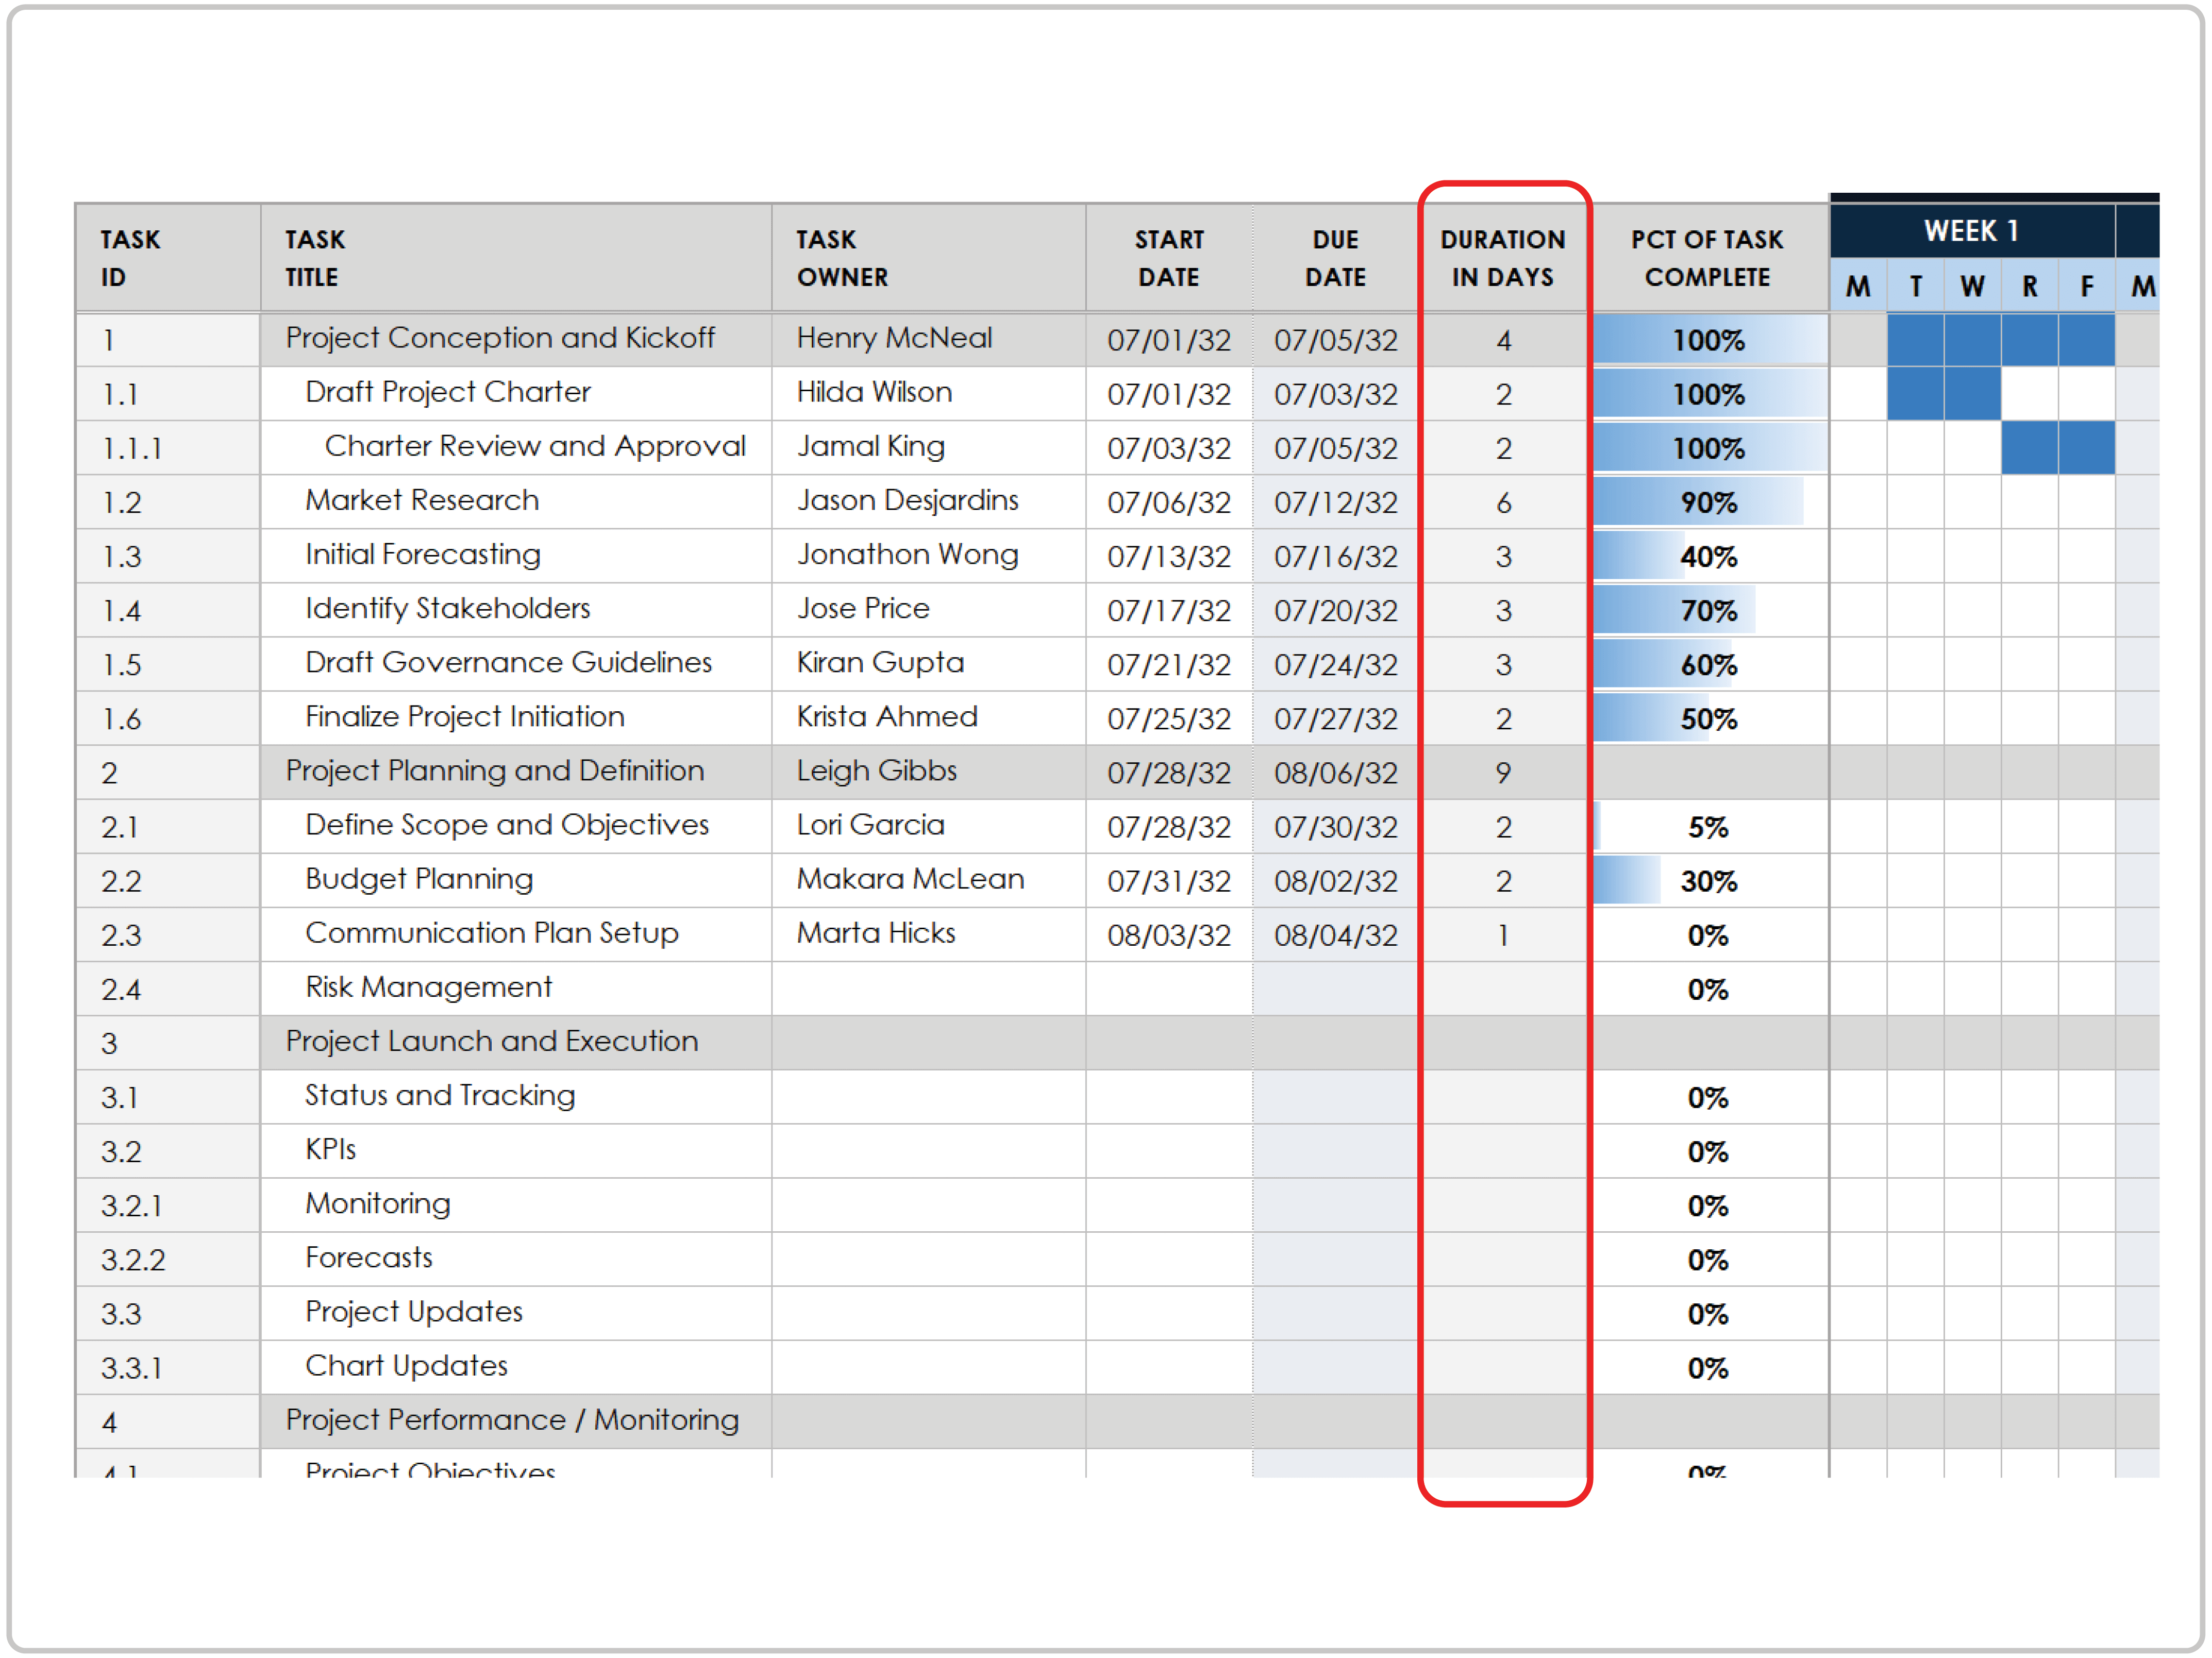
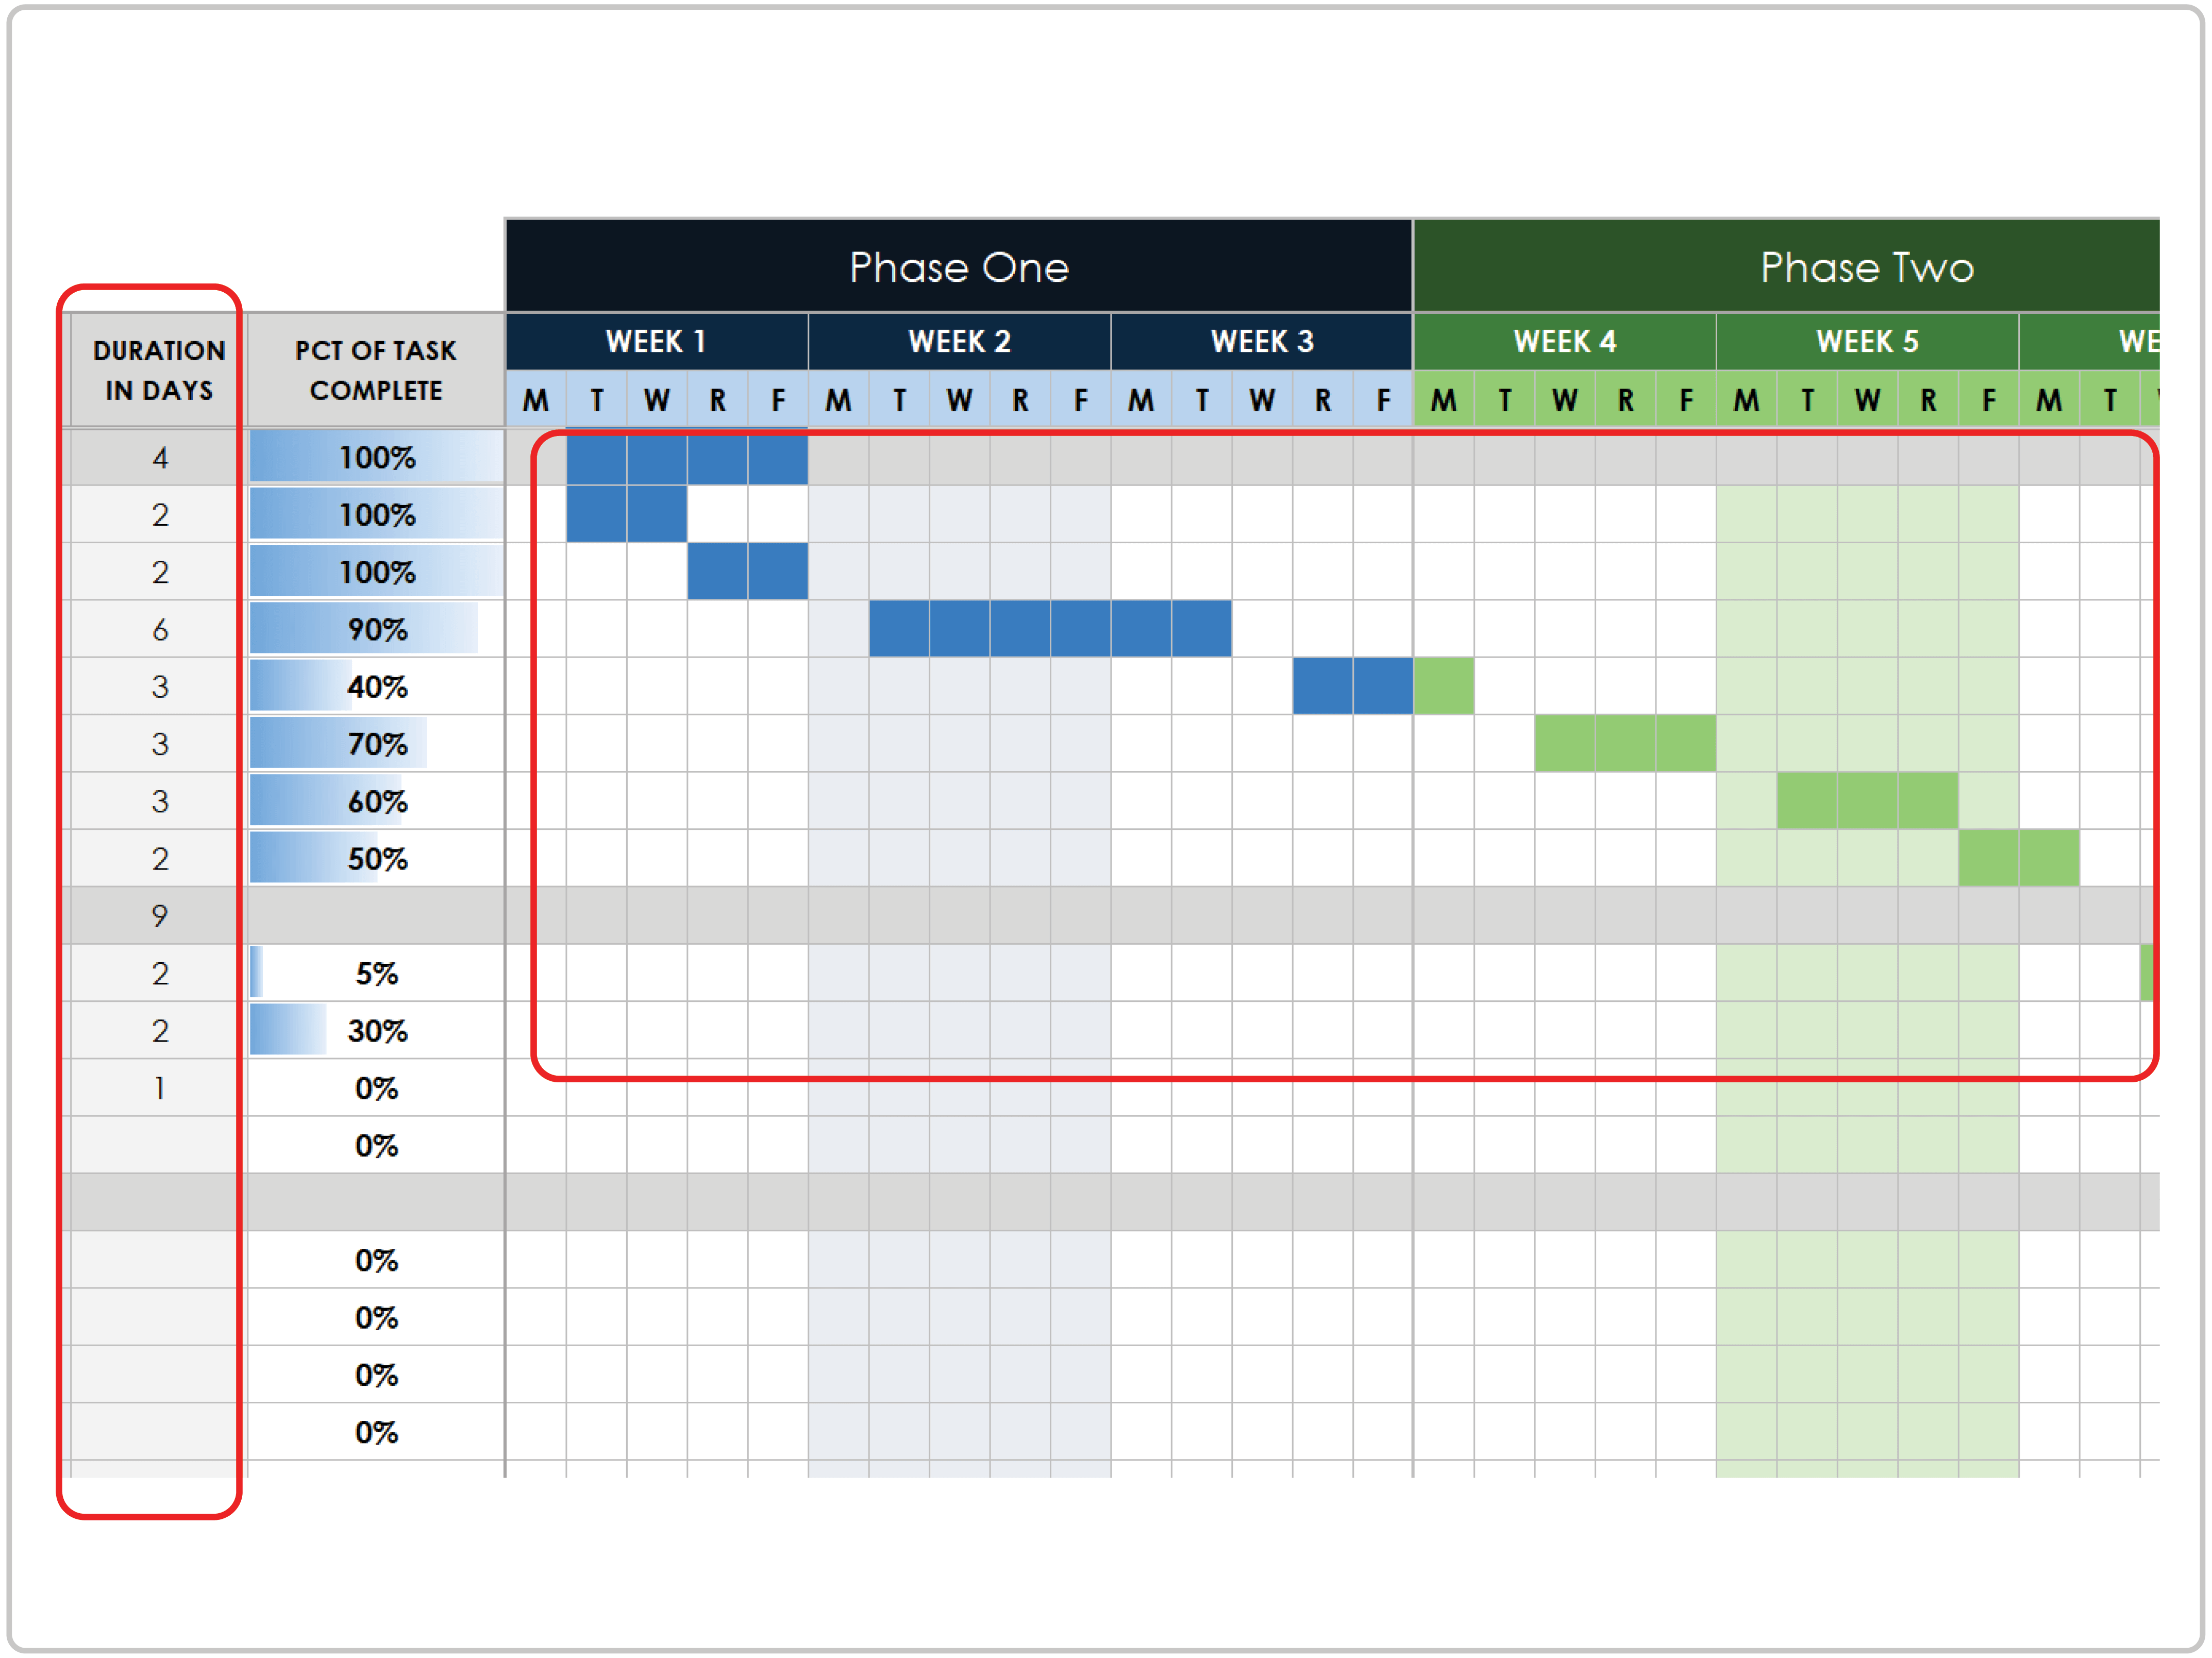
- The Duration in Days column calculates automatically. It uses your start and due dates to measure working time between them.
- Enter the completion percentage for each task.
- Manually match the duration in days to where they fall in the Gantt chart. These cells show the task duration across the 12-week chart divided into four project phases.
Quickly Create a Gantt Chart in Smartsheet
From simple task management and project planning to complex resource and portfolio management, Smartsheet helps you improve collaboration and increase work velocity -- empowering you to get more done.
The Smartsheet platform makes it easy to plan, capture, manage, and report on work from anywhere, helping your team be more effective and get more done. Report on key metrics and get real-time visibility into work as it happens with roll-up reports, dashboards, and automated workflows built to keep your team connected and informed.
When teams have clarity into the work getting done, there’s no telling how much more they can accomplish in the same amount of time. Try Smartsheet for free, today.