What Is a Human Resources Dashboard?
Human resources (HR) dashboards aggregate and present employee data in a meaningful way, and are designed to help make the most of everyone’s time, both within the HR team and throughout the entire organization. As a visual display of key metrics, HR dashboards simplify information gathering, and present data in a way that can be sorted, analyzed, and presented to management and executive teams.
Dashboards are also an efficient way to communicate with staff and stay abreast of what’s happening in your company. Here’s an example of what a clear and functional HR dashboard — in this case dedicated to hiring functions — can look like:
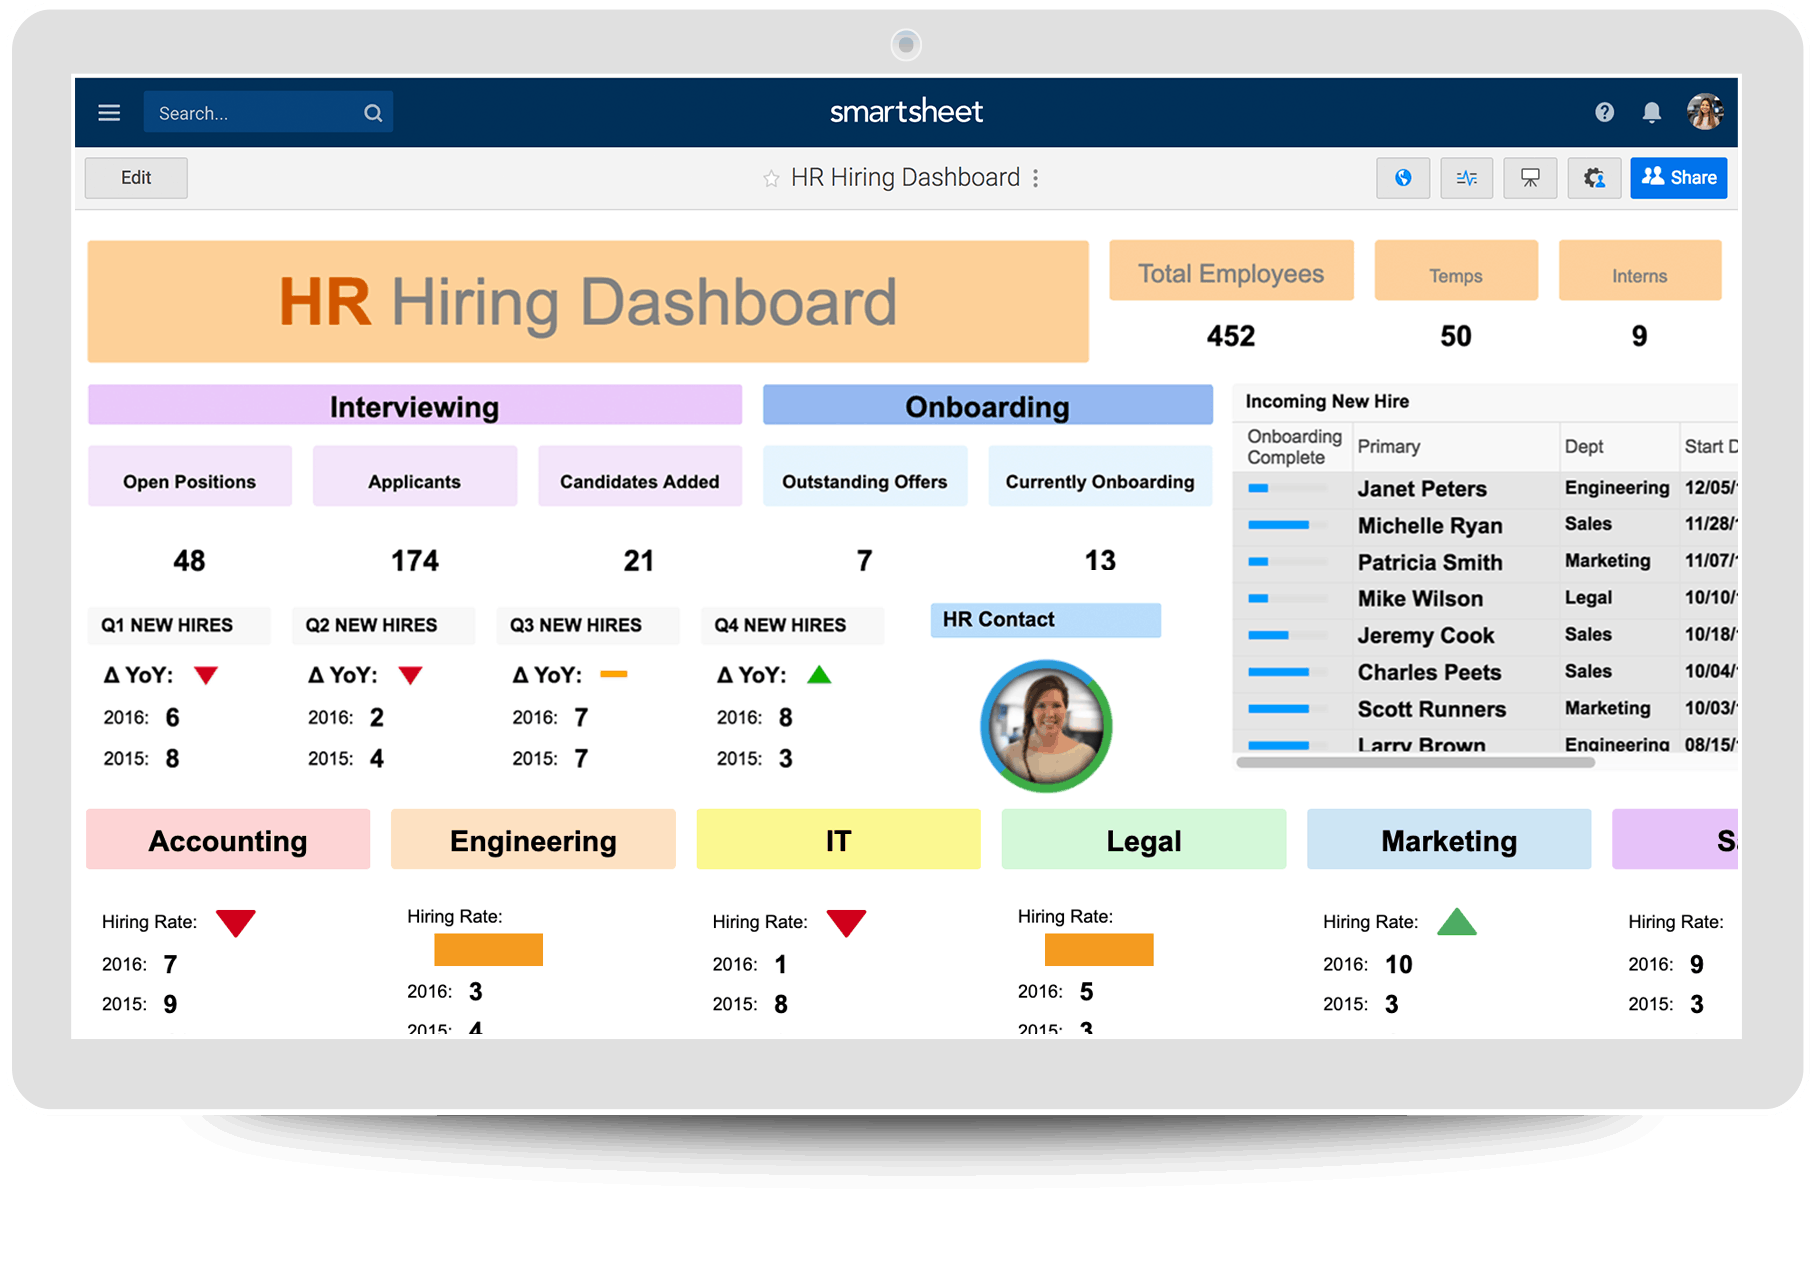

“A good dashboard should be simple to use and easy to understand,” notes Cornelia Gamlem, founder and President of the Gems Group, consultant, speaker, and author of four books, The Big Book of HR, The Essential Workplace Conflict Handbook, The Conflict Resolution Phrase Book, and The Manager’s Answer Book. “Being able to measure effectiveness and efficiency is critical in today’s business environment. Dashboards provide a platform to do that and to share the data as well. For example, HR can measure the effectiveness of recruitment processes or assess trends as part of its workforce planning activities and easily report to senior management.”
Dashboard Classifications
As you decide what will be most useful to support your HR efforts, consider how you’ll specifically use the dashboard. Dashboards are often classified as strategic, analytical, or operational. Many dashboards are hybrids that combine two or all three types:
-
Operational: Operational dashboards provide real-time alerts to any deviations from the norm. Professionals use this type of dashboard to monitor and analyze a company’s activities in a specific business area. Generally, departmental employees use operational dashboards often to highlight issues in real-time so they can correct a situation.
-
Strategic Dashboards: Also known as executive dashboards, this type of dashboard provides an overview of the data executives need to ascertain the health of the a department or the entire organization and identify opportunities for improvement.
-
Analytical: To understand trends and underlying causes, and compare variables and timeframes, users often rely on analytical dashboards. Analytical dashboards are more detailed than the other two dashboard types, and hold both operational and strategic data. They offer drill-down functionality to enable data exploration and gain insights from multiple sources.
Learn more about the design and utility of dashboards by reading Best Dashboard Apps by Category.
The Purpose and Benefits of Human Resources Dashboards

According to Dawn Cacciotti, founder of EngageHRnow®, human resources strategist, and contributor/co-author of Cultivating Culture, “HR has a profound ability to impact the results of an organization and the use of HR dashboards is essential for assisting organizations to accomplish their strategic plan. When well-designed, HR dashboards mirror the needs and pathways set by the strategic plan. They can also pinpoint a particular area within the organization that is either negatively impacting their growth or can focus on an area that the strategic plan showcases as the main area of future growth.”
A visually engaging way to track vital data, HR dashboards add value by measuring progress, nurturing relationships, and building culture and support:
-
Monitoring and Management: Regular reporting enables HR to accurately take the pulse of the organization by tracking key workforce metrics. HR pros can address emerging problems before they significantly impact the business and share victories as they occur.
-
Drill-Down Ability: Dig into data to uncover the root causes of issues like high turnover in specific departments, the cost of hiring for particular positions, or link retention of high performers to particular benefits or other factors
-
Data-Driven Decision Making: Spot trends and understand challenges and opportunities — based on real data — that you can share with management.
-
Improved Hiring Processes: Savvy recruitment analytics saves both time and money by helping managers make informed talent decisions or assess employees’ performance more objectively when evaluating staff for promotions.
-
Onboarding: Improve retention and productivity with an onboarding process strengthened by dashboards. Track the delivery of electronic documents, new hire orientation and compliance processes, and job-specific training or other important steps as you get new team members up to speed. Interested in exploring onboarding best practices? Look into Free Onboarding Checklists and Templates, and Employee Onboarding Processes: Plans, Best Practices and Flowcharts.
-
Engagement and Motivation: Darrin Murriner believes engagement is the key to both productivity and retention. Murriner is author of Corporate Bravery, a field guide to eliminating fear-based decisions and co-founder of Cloverleaf, a technology platform that helps business leaders and managers build thriving teams and culture. Murriner says that dashboards can be extremely useful in understanding the commitment and dedication of team members.

“Measuring ‘feeling’ levels through pulse surveys can be an effective approach to getting overall organizational sentiment and identifying where problems are growing or festering.” Murriner advises, “Information from surveys and related dashboards are most effective when managers get the information, but more importantly, have the will to be honest when engagement is declining and make the right corrective actions in a reasonable timeframe. For example, if unrealistic deadlines have been causing employee burnout, a manager can pull in additional resources or adjust unrealistic expectations of timelines to bring things back in line.”
- Retention: Gina Abudi, President of Abudi Consulting Group, LLC, author and business blogger, notes that her clients have benefitted from HR dashboards. “For example, a positive outcome for one of my clients was that the HR department was able to visualize and analyze shortfalls in their workforce planning, hiring, and onboarding practices.”

Abudi adds, “The HR team consequently improved retention rates, including providing a professional development program to increase retention and sharing valuable data with executives. They saved the organization money that would otherwise have been lost because of poor hiring practices and lack of sufficient training.”
If you’re interested in developing a more strategic approach to HR practice, find further expert information and free tools in Human Resource Management 101: Functions, Policies & Procedures.
What Do HR Dashboards Measure? All about Key Performance Indicators
A key performance indicator (KPI) is a metric that measures the performance of a particular activity or process. In HR, KPIs can measure efficiency, effectiveness, and organizational impact to surface deep information related to short and long term goals.

Amanda Haddaway is an author, managing director of a boutique human resources consultancy, HR Answerbox, director of the Maryland Society for Human Resource Management State Council, and Society for Human Resource Management trainer. She advises, “HR KPIs should provide awareness and measurement of how the organization is progressing on its goals, and KPI selection is dependent on the organization.”
Haddaway offers an example: “If senior-level employees are resigning at an unprecedented rapid rate, KPIs to review would be turnover rate and years of service/tenure to ascertain underlying causes.” The team can analyze those causes and outline steps to take for corrective action.
KPI Lagging and Leading Indicators
Another way to think about KPIs in the HR realm is in terms of past and future. Lagging indicators essentially analyze past results and which strategies have and have not worked in the past. Leading indicators look at your current strategies and how successfully they’re being executed. They look at the present and help plan for the future, but they don’t measure results, since the associated results are yet to be realized.
Let’s look at recruiting as an example. Actual hires would be a lagging indicator (people are already working in the organization) while current applications would be a leading indicator of where you are going in your recruiting efforts. In other words, the number of applicants is a leading indicator of where you are in your desired pipeline to measure progress toward your hiring goals.
Cacciotti of Engage HRNow stresses that meaningful KPIs mix overall strategy with organizational culture. “The right KPIs are selected based on understanding the organization’s overall strategic plan (where we are currently and where we need to accomplish the strategy) and having an informed pulse on the organization’s culture.” Cacciotti adds, “HR could have the greatest data, understand exactly what they need to do in order to move the strategic plan forward, but if the initiatives they want to implement of the strategy don’t fit the current culture, it won’t be successful.”
How to Select HR KPIs
Abudi has found that every organization has and needs different HR KPIs. “For example, an organization can be focused on employee retention, employee development, and employee satisfaction. So, you might want to maintain a KPI for each of those three areas.”
Abudi also says that frequent reviews of HR KPIs are necessary. “KPIs are based on what’s important to the organization and may change year over year. If you set a KPI one year to track and focus on employee retention and find that retention is improving, you may not focus on that KPI the following year, although you would keep an eye on it so you don’t lose ground.”
KPI Characteristics: How Many Are Too Many?
While they may change due to environmental conditions, all strong KPIs should be the following:
-
Tangible: Have a specific goal that supports company strategy.
-
Measurable: If you can’t measure the stated KPI, it doesn’t qualify.
-
Reachable: Be realistic when defining the KPIs that will determine your success.
-
Relevant: Monitor what matters. Don’t waste time with indicators that don’t contribute to your company.
Limiting the number of KPIs to track on dashboards is a best practice —and is often a challenge. Our experts suggest that a dashboard shouldn’t have more than 12 KPIs when tracking progress toward company short- and long-term goals. You can gauge whether your HR practices are positively impacting your business’s profitability by constantly measuring and tracking these metrics.
Need more ideas and best practices around KPI selection and tracking? Two resources for free tools and reference are The Essential Guide to Defining Business Dashboard Metrics and All About KPI Dashboards.
What Makes a Strong HR Dashboard?
A useful HR dashboard is concise and has an intuitive display of KPIs that is understandable, shareable, and actionable. As Abudi says, “A good HR dashboard is one you can react to and use — it displays information valuable to you as an HR professional. You want to avoid a pretty dashboard with tons of metrics that you can’t act upon or don’t even make sense for your company. Don’t be sold on looks alone!”
Regarding design, Gamlem concurs that simplicity is the objective and complexity is simply bad. “Remember, you want to share the information on your dashboard with others, so avoid clutter and anything that's not visually appealing, such as too much color or graphics that are too ornate. Also, don't display irrelevant data just for the sake of populating the dashboard,” she emphasizes.
What else makes for a good HR dashboard? “It includes usable data that tells a compelling story,” says Haddaway. “If I’m able to look at the dashboard and know right away that my company has a retention problem, that’s terrific. It’s easy to get overwhelmed by data, so I favor dashboards that are a little more simplistic and not overly complicated. I also like to have options to ‘slice and dice’ data as needed for various reports.”
The Importance of Real-Time Data in HR Dashboards
“Through the use of technology, HR is now able to take advantage of real time and big data,” says HR Answerbox’s Haddaway. “This data can tell a story about trends that occur in the entire employment lifecycle — from initial recruitment through employment and eventually, separation from the organization. I think of metrics as one data point and analytics as the intersection of multiple data points. I’m seeing some organizations starting to do really sophisticated analysis on the data they are collecting from the micro to the macro level.”
All of our experts stressed that data should be fresh and constantly updated with data feeds so the dashboard remains relevant. They also advised that dashboards and KPIs should be vetted on a regular basis, and reviewed for errors.
If you choose to buy an app, most systems will offer an easy way to import data. “An HR dashboard needs to be flexible. It should integrate with the organization’s HRIS (human resources information system) or other live data,” says Gamlem.
How to Bring Real-Time Data into Excel
In the next section, you’ll find HR dashboard Excel templates for you to download and modify as needed. (If you prefer to create your own dashboard in Excel, this tutorial can help.) Before you begin any work, however, identify the origin of your data. You can manually input data, but for best results, import data into Excel from an external data source, such as a database, a text file, or Online Analytical Processing (OLAP) cube. Connect the external data source to the workbook through a data connection. Once connected to the external data, you can automatically refresh your workbook from the original data source.
Stored in the workbook, connection information can also be stored in a connection file, such as a data source name file (.dsn) or an Office Data Connection (ODC) file (.odc). Many data sources also require an OLE DB provider or ODBC driver to coordinate the flow of data. For more detailed information, refer to Microsoft’s Overview of Connecting Data.
Download Free HR Dashboard Templates
HR dashboards that show progress through charts, gauges, and other visual devices help managers identify challenges and progress more clearly and assist in analyzing the ‘why’ of human performance. Is there a difference between metrics and analytics?
Gamlem of Gems Group says there is. “Metrics are the hard numbers, the data that is collected. Analytics is the interpretation of that data. Organizations use the analysis of data to evaluate performance against goals, assess trends that can be used in workforce planning so they can assure they have the necessary staff, and best utilize their peoples resources.”
Engage HRNow’s Cacciotti finds, “Dashboards have been extremely helpful to teams I’ve worked with to accomplish stated goals. [They have] united the team and improved the internal communication that is so necessary — and yet is often lacking — to accomplish desired results.”
In the following sections, you’ll find free, downloadable HR dashboard templates for Excel. Templates are grouped by KPI category, including compensation, employment, performance, and culture.
Templates for Compensation KPIs
These metrics help HR understand why and how much is being paid in wages, salaries, and benefits, and the ROI of human capital investment. Dashboard templates include the following:
-
Salary Competitiveness Ratio (SCR): This metric is increasingly important, particularly in competitive industries where demand for skilled employees is high and the pool of qualified candidates is low. To calculate this metric, divide the average salary in your organization by salary averages offered by your competitors or industry wide.
-
Health Care Expense per Current Employee: Healthcare costs have skyrocketed in the last decade. Determining how much your company is paying per employee can help you save money in this costly benefit area. The simplest calculation is to divide the total number of employees covered by company plan(s) against the total cost per year by the total cost of healthcare paid by your organization.
Healthcare Costs Per Employee Dashboard
Use this template for a basic view of both individual health benefit costs per employee and overall costs of the plan. This customizable dashboard provides a clear look into costs by month for medical, dental, and other healthcare expenses incurred by the employer, the total health care costs paid by the employer, and total health care costs paid per employee.
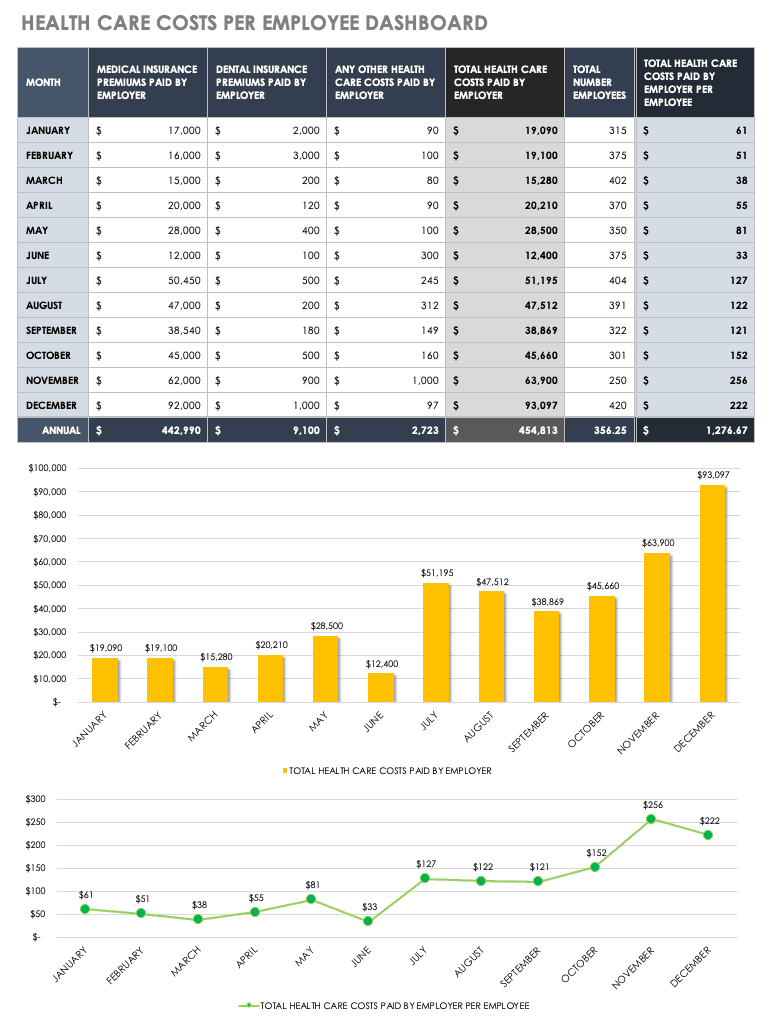
Download Healthcare Costs Per Employee Dashboard
-
Benefits Satisfaction: Using surveys, employees can weigh in on the degree of satisfaction with specific benefits to help design future benefit programs. The information can be helpful for designing employee retention plans.
-
Cost of Benefits: More detailed than healthcare benefits alone, this metric reveals the complete cost of employee benefits provided by the company to the employee and how much the employee is contributing to benefits. This metric is a useful recruitment tool if benefits like bonuses and flexible spending are attractive and competitive to other companies in your field.
Benefit Statement Dashboard
Use this template to show the total benefit package by employee for the year, and how much of the cost was picked up by the company. You’ll find detailed information for total health and welfare benefits, paid leave, state and federal mandated benefits, bonuses, and more. Adjust the numbers to reflect what your company offers. You can then aggregate the information for your employees into one dashboard to see total benefits utilization and costs.

Download Benefit Statement Dashboard
-
Revenue Per Full Time Employee (FTE): If you want to know the average contribution of each FTE to the company’s bottom line on a yearly basis, the calculation is simple: divide annual income by the number of employees.
Revenue Per Full Time Employee Dashboard
This easy-to-use template shows the revenue by FTE by the month and year. This is a basic measure of productivity used by most companies. This provides a general estimate. You can also modify the template to show the breakdown to examine productivity by department, division, or job description.
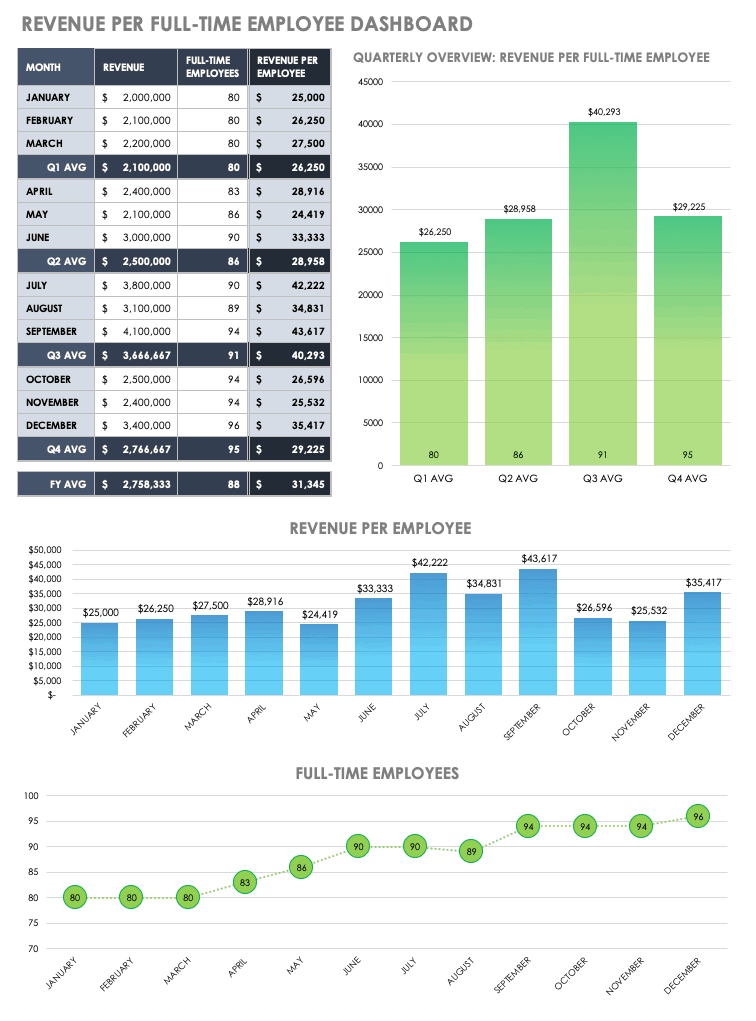
Download Revenue Per Full Time Employee Dashboard
Templates for Employment KPIs
Having a complete picture of how many employees you’re retaining, their attendance habits, and other data that you may need for legal purposes (like diversity rates) are easy to see with the right dashboards. Here are some sample employment KPIs and dashboards:
-
Absenteeism Rate: This KPI shows average absences from the job for both legitimate (illness) and illegitimate reasons (no-shows who don’t call in or provide an adequate reason). This KPI represents a significant cost to companies. The formula is relatively simple: Take the number of days off by any designated period, divide it by the total days worked by all employees over that designated period and multiply it by 100. You can also use the dashboard below.
Absenteeism Percentage Dashboard
Use this template to know the average rate of absenteeism by employees and customize it to suit your needs. This tool will help you record the number of absences by the number of employees by month and calculate the average absence rate by employee and the total for the year. If the percentage seems to high, you can take action by looking into underlying causes, set targets, provide a clearer policy, and institute rewards for excellent attendance.
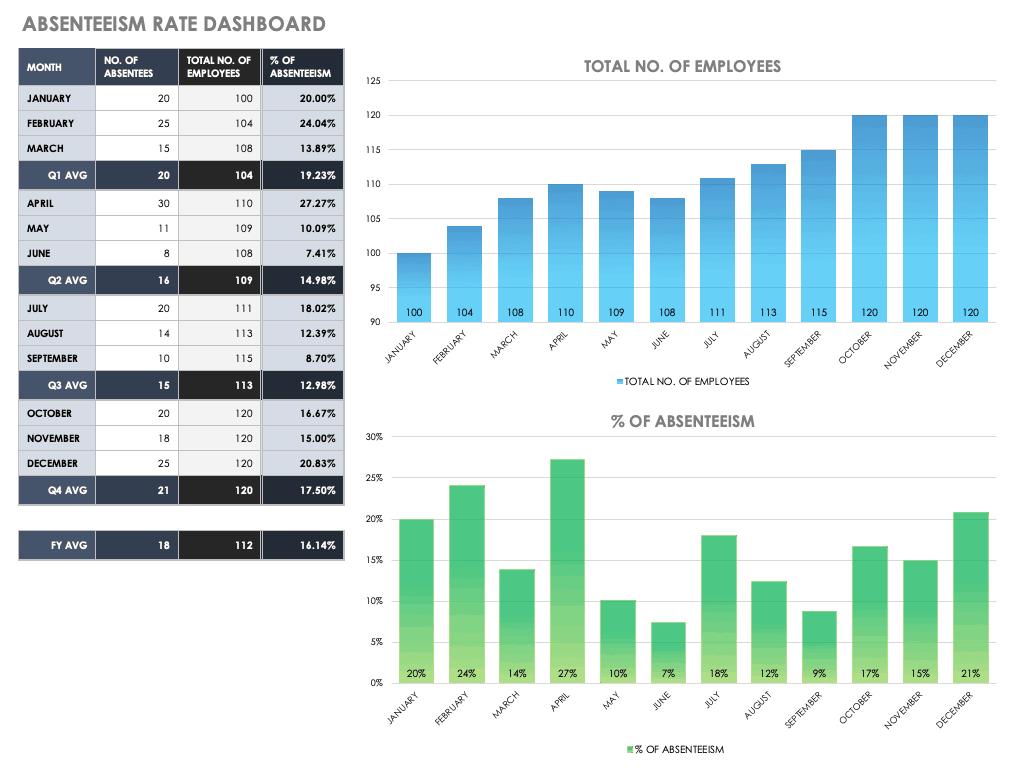
Download Absenteeism Rate Dashboard
-
Number of Full-Time Equivalents (FTE): The hours worked by one employee on a full-time (usually a 40-hour week) is a full-time equivalent. If there are many part-time workers, the FTE number is often lower than the total number of employees. FTE describes a reasonable measure of the total organizational workload.
FTE Calculation Dashboard
Use this template to calculate the number of full-time equivalents based on team members who work 40, 37.5, and 35 hours per week. Once you have the number of FTEs, you may decide to change the number of workers or the number or hours worked in your organization to assess trends and achieve revenue or employee satisfaction goals.
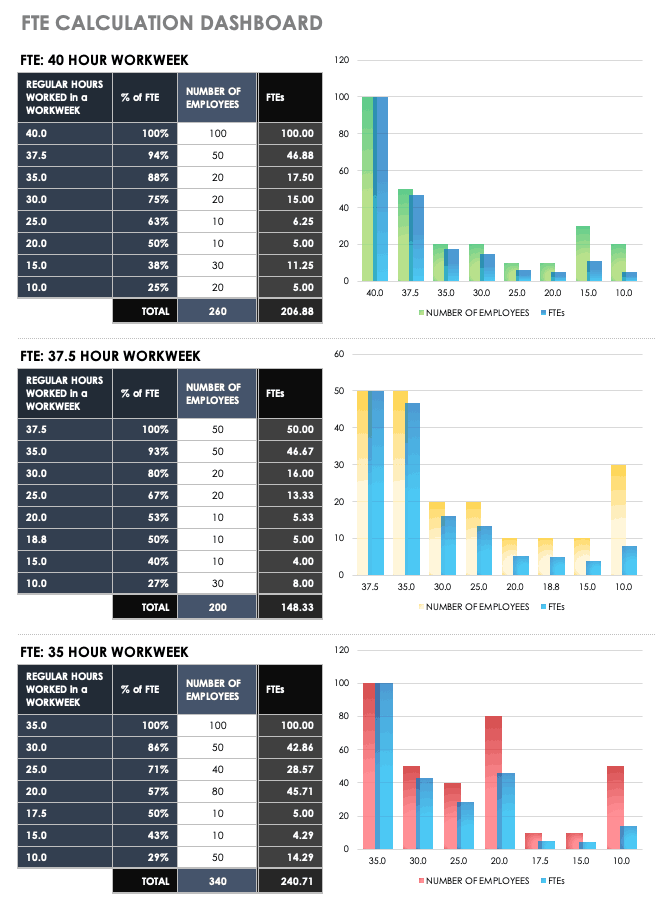
Download the FTE Calculation Dashboard
-
Contract Workers: Compare the number of contract workers to full-time workers to understand workforce needs and trends.
-
Average Tenure: The average length of time team members spends with the organization helps determine retention and satisfaction data.
-
Termination Rate - Voluntary: See how many employees are leaving by calculating the number of resignations over the total number of terminations in a given time period.
-
Termination Rate - Involuntary: Gain an understanding of how many employees are fired by taking the number of firings over the total number of terminations in a given time period.
-
Rate of Retirement: This KPI is necessary in the strategic workforce planning process. To calculate, review how many employees retired as a percentage of the total company headcount.
-
Average Retirement Age: Important for forecasting and planning for workforce replacement, divide all retiring employees by the number of retiring employees is the average age of retirement.
-
New Hire Three-Month Failure Rate: This number reveals talent acquisition effectiveness in finding the right personnel fit.
-
First Year Voluntary Termination Rate: A high quit rate may mean that the right hires are being made, but workers are not being properly onboarded or salaries may not be competitive.
-
Recruitment vs. Hires: Recruitment is the first step to adding new team members and finding qualified candidates; hiring is finding the right candidate, acceptance of an offer, and finally engaging services on a full time, temporary, or consulting basis.
Recruitment vs. Hires Dashboard
This template will provide you with the key to understanding the effectiveness of your recruitment process. This dashboard shows the number of applicants, the number of job offers, and how many people finally accepted an offer. If the ratio of offers to acceptance is low, it may be time to see how you can improve your process, or take a look at what your industry competitors are offering.
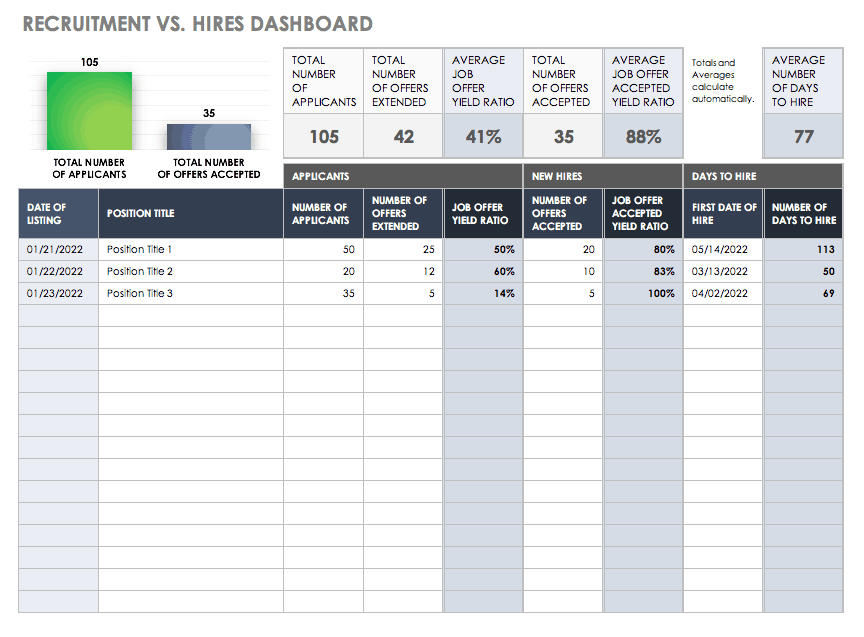
Download Recruitment vs. Hires Dashboard
-
Hiring Process Satisfaction Rate: Using a survey, discover the employee perspective on start-to-finish hiring procedures.
-
Cost per Hire: Research the cost of talent acquisition with this calculation. Average the total marketing, hiring process, and referral investment per hire to determine the final cost.
-
Training Effectiveness: Using a post-training survey, ascertain how comfortable new team members feel after training.
-
Employee Training Cost: Measure the investment in new hire onboarding by employee.
-
Percentage of Employees Trained: Find out how long it takes for new team members to be onboarded.
-
Diversity Rate: Keep track of whether or not the company fosters an accepting and open environment.
-
Number of Diversity and Inclusion Initiatives: Track your organization’s commitment to supporting inclusion and diversity.
-
Attrition Rate: This is a talent retention investigation to determine how long vacancies go unfilled, or if it is best to eliminate the position.
-
Turnover Rate: This KPI reveals how many workers leave the company yearly and is an important tool to help define retention strategies. When combined with another KPI — for example, performance — this metric can track the attrition rate difference between low and high performing employees.
Employee Turnover Dashboard
This template will provide you with a turnover calculation to see how often employees leave your company. You can track how many employees have left by the month, quarter, and year, the average number by month, and the ratio of turnover by month, quarter, and year. If turnover rates are high, it may be time to review company culture, salary, and benefits as well as conducting some employee satisfaction audits.
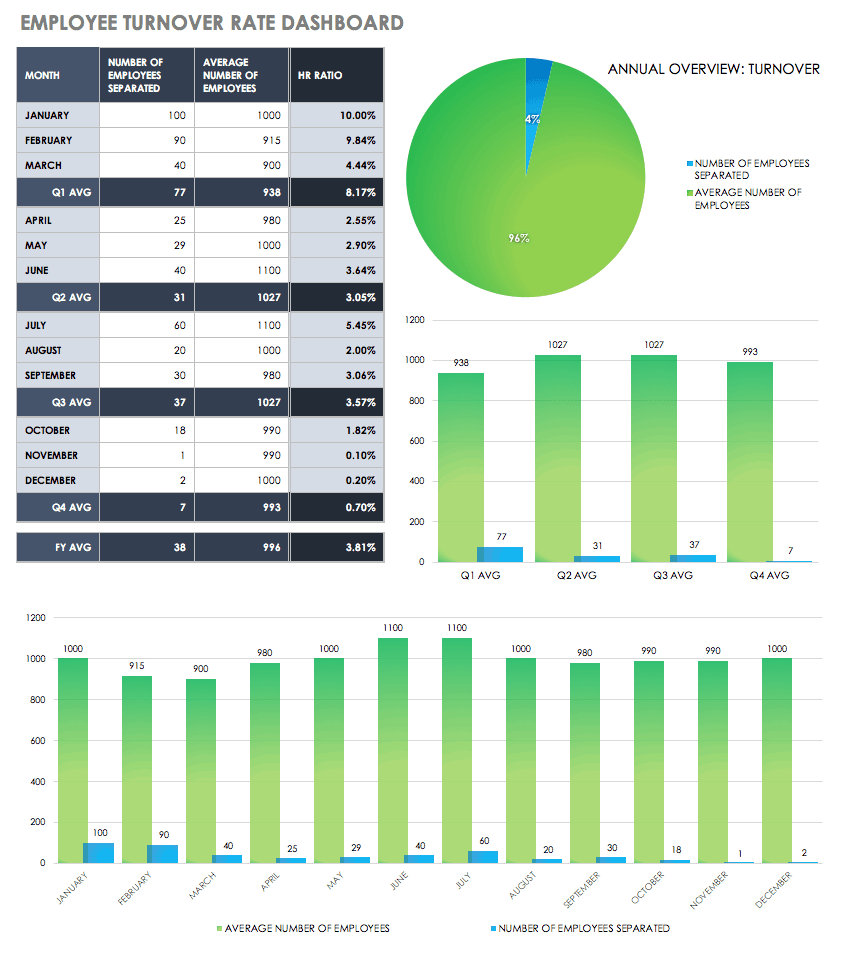
Download Employee Turnover Rate Dashboard
-
Average Time to Hire: Learn how efficient your hiring process is and where it may need improvement, particularly in roles that are hard to fill.
Time to Hire Dashboard
The hiring process can be frustrating and time consuming for companies and employees alike. The first step in streamlining the process is understanding how long it takes to put new team members in place. This template is designed for monthly monitoring and can be adapted to your needs. Track the types of positions you fill and departments, approval dates, acceptance dates, and more. Based on that information, the template will calculate the days to offer and days to fill.
Download Time to Hire Dashboard
-
Yield Percentage: Learn how many and what percentage of candidates are still viable after each round of hiring process elimination. A high percentage of candidates results in a greater number of qualified candidates, while a low percentage may require a change to the job posting.
-
Knowledge Achieved With Training: This information helps determine the effectiveness of training, rather than the cost by testing retained knowledge by pre- and post-testing.
Templates for Performance KPIs
How is your HR department doing? How long is your hire cycle? Are you hiring the right people? Dashboards can provide the answers:
-
Return on Investment (ROI): This metric is also called Human Capital ROI, or HCROI. The number shows how your investment in people stacks up against revenue. The formula to obtain this metric is revenue minus operating expenses divided by compensation plus benefit costs.
HR Return on Investment Dashboard
This template can provide a clear picture of the economic value provided by your team by month and by year. Capture revenue, operating expenses, compensation, and benefit costs by the month with this dashboard which will provide calculations and show you where you may need to make adjustments to achieve your company goals. While every company has different needs (depending on size and other factors), a benchmark for larger companies is one human resources staffer for every 100 employees.
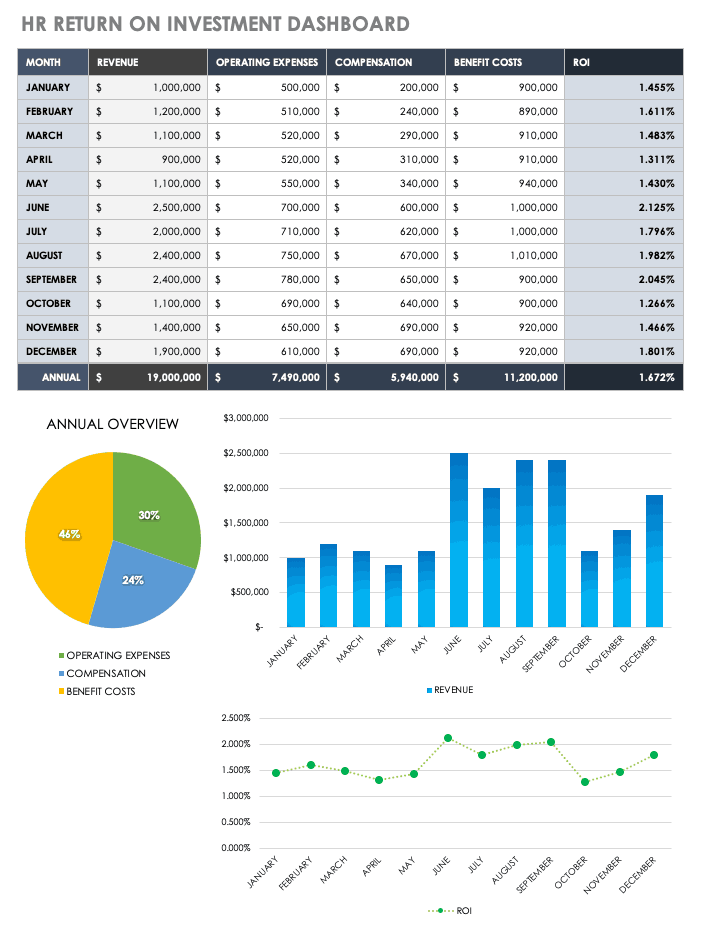
Download HR Return on Investment Dashboard
-
Human Resource Ratio: This metric helps determine the HR staff’s ability to support needed services. Larger organizations usually have a lower ratio of HR to other staff, but more HR employees overall than small businesses. Calculate the ratio by taking the total number of HR FTEs and dividing by the total number of full time employees.
Human Resource Ratio Dashboard
Need to track how many full time employees you have against the number of HR staff? Use this adjustable template to find the ratio of people you have to serve the needs of your company’s team. The template helps you follow the numbers by the month, quarter, and year.
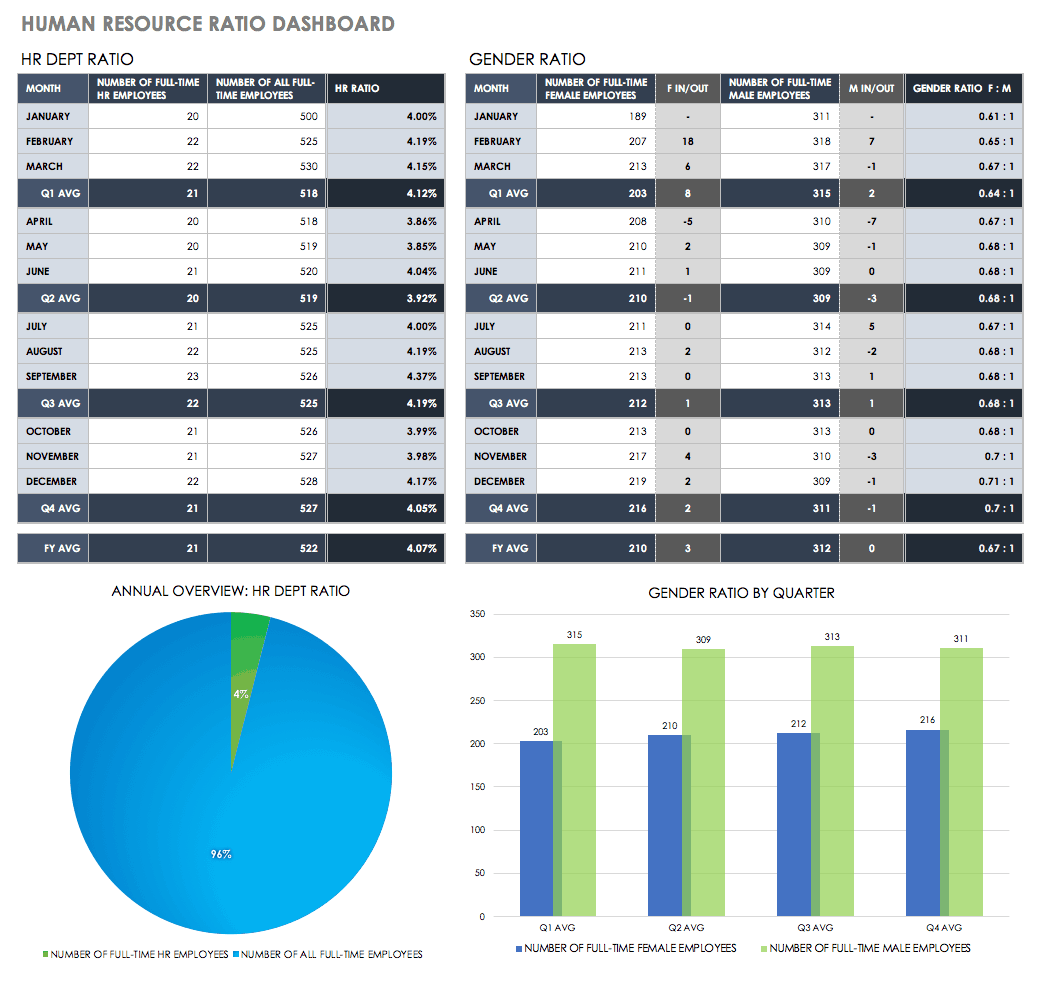
Download Human Resource Ration Dashboard
-
Candidate Percentage Who Meet Job Criteria: Gauge the validity of your recruiting efforts and analyze if changes are needed, should a high percentage of resumes fail to meet job criteria.
-
New Hire Performance: You can compare the performance of new hires to other employees and against the job description.
-
Internal Hire Rate: This number reveals organizational talent development effectiveness.
-
Internal Referral Hire Rate: This metric allows managers to see the value added when a qualified colleague is identified by a current employee for an open position and is subsequently hired.
-
Internal Promotion Rate: This metric is an indicator of positive growth and retention of top performers. To find the rate, divide the number of individuals promoted by the total number of team members.
-
Internal Promotions vs. External Hires: Particularly effective when looking at organizational succession planning, this KPI establishes how many existing employees are promoted against outside hires.
-
Employee Suggestions: Reflects on company openness to employee input and gauges engagement in business process improvement by staff.
-
Process Payroll Cycle Time: The total number of business days in the payroll process from start to finish. It shows process timeframes and projects if changes to the process are required.
-
Resolve Payroll Errors Cycle Time: This KPI represents how many business days it takes to resolve an employee reported payroll error. A high number of days suggests it’s time to update the payroll process.
-
Percentage of Workforce Below Performance Standards: This KPI notes the number of low-performers in the company.
Templates for Culture KPIs
Retention is the name of the game, particularly when the market for highly qualified employees tightens. In competitive industries like software, aerospace, and other technical fields, culture can be a make-or-break proposition. As is the case for every one of these KPI categories, you can adapt HR dashboards to effectively measure culture within your company.
HR Dashboard Template
This simple, clean, and flexible design provides an instant view into multiple metrics. You can customize this template to include the culture or some of the other culture KPIs described below that are most beneficial for your team or the executive suite, whether it’s a look into employee satisfaction, benefits, salaries, wages, or recruitment.
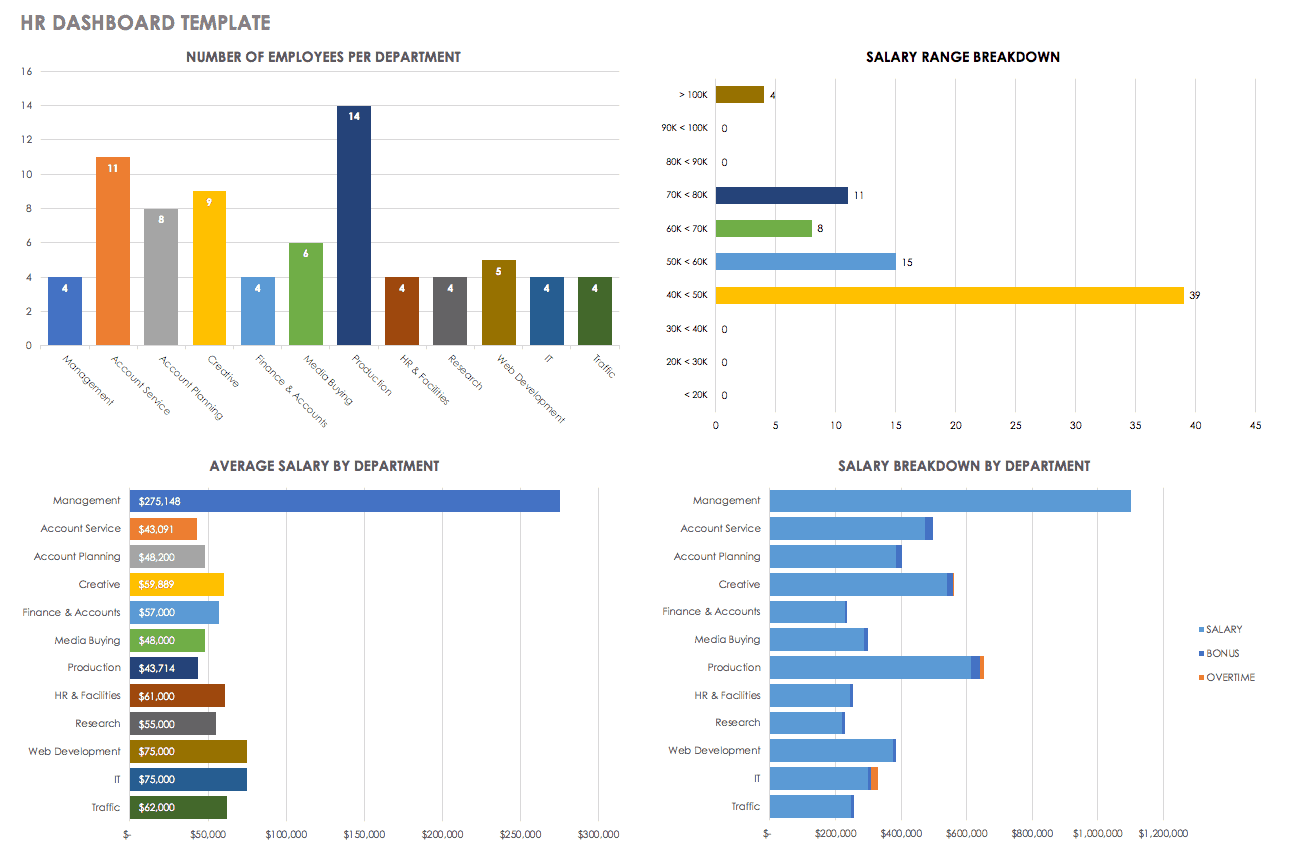
Download HR Dashboard Template
To ensure that employees are engaged, track satisfaction and other measures. Here are some of the KPIs you might use to gauge and track culture metrics:
-
Employee Satisfaction Index (ESI): Determine and track changes of in-house team member satisfaction with three easy, standard questions that are designed to fit any business:
-
How satisfied are you with your current workplace?
-
How well does your current workplace meet your expectations?
-
How close is your current workplace to the ideal one?
-
-
Employee Satisfaction Survey Number: This metric shows how much effort is being put into maintaining and improving employee contentment.
-
Number of Employees Trained in Company Culture: Evaluates the importance and understanding of disseminating and living the organizational culture.
-
Vacation Days Utilization: Work-life balance is important to employee satisfaction and retention. This metric compares the number of available vacation days used to those unused by each employee.
-
Net Promoter Score Measures: Calculate how likely an employee is to recommend their organization as a place to work. This metric is determined by the difference in percentage of promoters and detractors.
-
Engagement: A productive workforce is an engaged workforce. Engaged staffers tend to be perform better and perceive challenges as exciting. Engagement is an important metric for a team manager’s success since it improves retention.
Onboarding: Onboarding ensures that new team members complete required paperwork, understand company rules and protocols, understand the culture, and feel comfortable in their new role. The onboarding process can take up to a year, depending on the role and organizational needs. Learn more by reading Employee Onboarding Processes: Plans, Best Practices and Flowcharts and The Complete Guide to Employee Onboarding from HR Experts.
How Do You Evaluate Employee Performance?
Evaluating employee performance begins with establishing a performance measurement system. The system should provide standards for performance so team members understand what and how work needs to be accomplished in their particular role, and also individual goals, which are goals tailored to the employee based on their strengths and weaknesses.
Once overall performance standards and individual goals have been determined for each position and team member, they should be documented and distributed to employees so they understand expectations and have objectives for a positive evaluation in their next review. This performance data should be reviewed prior to a formal review, and the manager’s conclusions should be written down and compiled using evaluations from other managers (if that is company practice), and any other evaluations by colleagues and self-evaluations. This documentation should be shared and discussed during the face-to-face performance review so the manager and individual are on the same page and can set up for future success.
What Is a Performance Review?
A performance review, also known as a performance appraisal, is a fair, balanced, and formal discussion of an employee's development and performance. It’s also a planning procedure where you discuss job performance, set professional development goals, and establish objectives and expectations to contribute to company goals. An important aspect of a meaningful performance review is tracking data to establish if goals and expectations have been met.
Learn more by reading The Secrets to an Effective Performance Review: Examples, Samples, and Forms.
How Do You Conduct a Performance Review?
Dashboards can simplify performance reviews by providing clear communication around work responsibilities and objectives, illuminating ways to align individual and organizational goals, identifying training needs, and encouraging positive relationships between employees and management. Since dashboards enable managers and employees to see how individual performance compares to pre-set goals and peers, you can pinpoint areas that require feedback and foster an open dialogue.
For example, data surfaced in a dashboard that relates to a single employee can include how long it took from application to hire data, history of promotions within the company, total days of vacation and sick days taken, a history of all performance reviews, and recommendations made.
While annual performance reviews have been the norm in the past, today’s best practices recommend that you conduct reviews more often, particularly in fast paced technology businesses. Using HR dashboards makes it easier for direct managers to provide in-the-moment feedback, whether for praise or if there’s a challenge that needs attention. Conducting informal frequent reviews keeps management informed as it fosters positive relationships. Having more frequent reviews also takes some of the pressure off the formal biannual or annual reviews and promotes a more connected, more responsive culture.
Employee Evaluation Template
Useful for annual reviews, you can customize this template for every type of timing cadence. You’ll find sections for weighted, measurable objectives and evaluations, and an area to make note for follow-up tasks. Other sections include employee self-evaluation, employee skills assessment, and the employee’s evaluation of the manager. At the end of the template, there is a dedicated area for professional development suggestions.
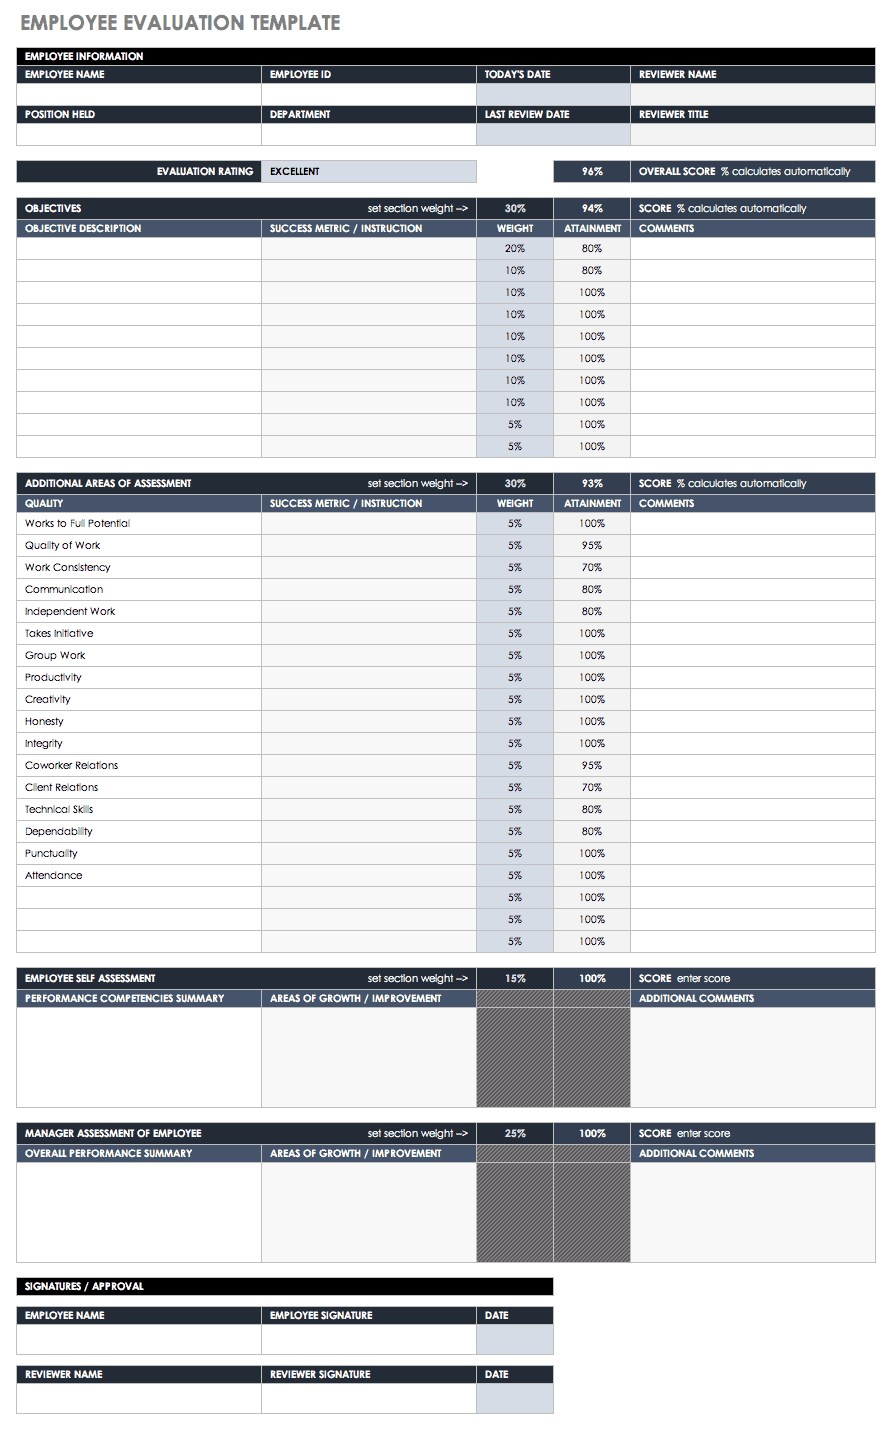
Download Employee Evaluation Template
Group Evaluation Form
This customizable template supports multiple competency ratings, and then automatically calculates totals scores to assess the performance of organizational groups. Identify the strengths and weaknesses of any team at a glance. Ratings assigned to individuals can be exported from other performance reviews or self-evaluation forms.
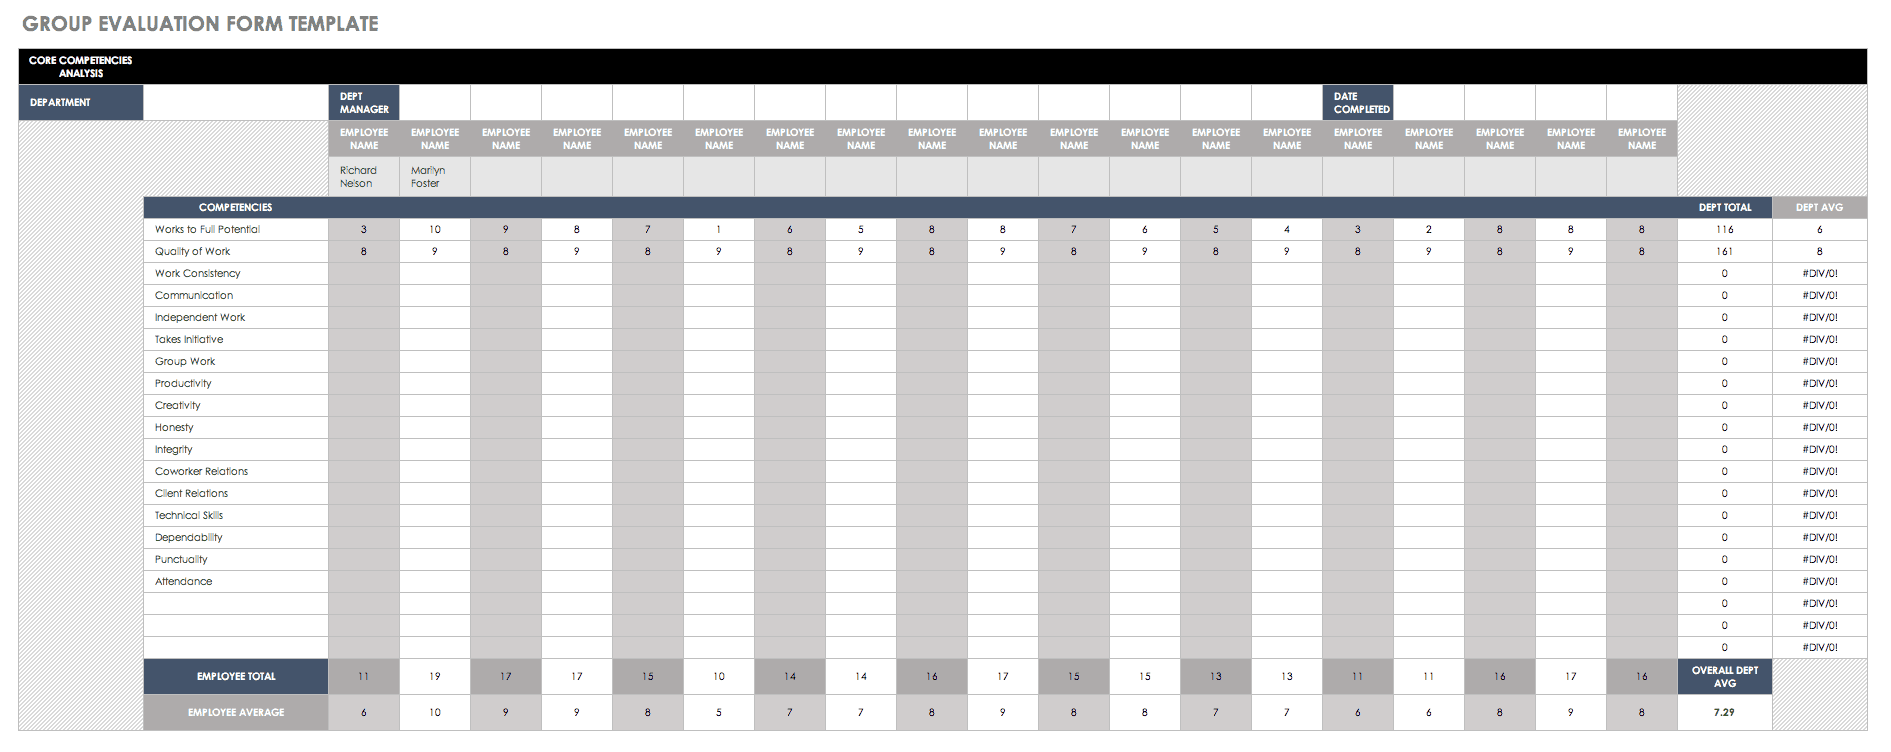
Download Group Evaluation Template
For performance review tips from experts, more frameworks and free templates, read Performance Review Examples and Tools.
How to Encourage HR Dashboard Adoption in Your Organization
How do you encourage HR dashboard adoption in an organization? Point out the benefits, be organized, keep the design simple, and focus on engagement and retention.
-
Take a Change Management Approach: “I approach it [dashboards] from a change management perspective,” says Abudi. “I focus on the value and benefit of the HR dashboard for the individuals whom I want to adopt it. I want to move beyond why it is good for the organization and focus on why it is good for individuals within the organization. [Using dashboards is] simply to drive better performance, engage, and retain top talent and meet goals.”
-
Present a Plan: A planning phase with input from key stakeholders, followed by a documented action plan that provides examples, benefits, and a timeline improve the possibility of adoption. Abudi says, “I engage individual managers by asking them: Wouldn’t you like a tool that will enable you to track talent performance? Wouldn’t you like a tool that allows you to measure against metrics and not just guesswork (thereby making the performance review processes easier)?”
-
Impress the Executives: Gamlem stresses that executives are looking for data and that she has seen HR dashboards make an impression — and raise HR’s profile. “I have a client who used a dashboard to track relevant HR information. When she was asked to make a presentation to the board one year, she had an easy time developing her presentation using the dashboard. The board was so impressed, she was invited back to present at every one of their future meetings,” shares Gamlem.
-
Drive Toward Engagement: Cloverleaf’s Murriner says that he foresees steady adoption of HR dashboards to foster engagement. “The next evolution of HR sentiment surveys and dashboards is taking a more bottom-up approach to preventing issues from manifesting in the first place. The future is to head off the greatest causes of disengagement with technology and tools built to assist teams in avoiding unnecessary conflict, setting more realistic expectations, and doing work that is optimal for them at their current career placement.”
HR Dashboard Resources
The following resources help make using dashboards to improve your practice easier for both novices and experienced HR professionals:
Articles
These articles feature the latest thinking about dashboarding in human performance strategic management:
-
Can Technology Drive Organizational Culture?, HR Dive, 2018, by Pamela DeLoatch
-
Developing the Dashboard: Real time Visibility in HR, 2018, HR Technologist, by Amber Lloyd
-
The Board Needs Culture Dashboards: A Q&A With KPMG’s Dennis Whalen, 2018, FEI, by Olivia Berkman
Books
Here are three recent books that specifically cover dashboard design and utilization:
-
The Big Book of Dashboards: Visualizing Your Data Using Real-World Business Scenarios by Steve Wexler, Jeffrey Shaffer, and Andy Cotgreave
-
Business Dashboards: A Visual Catalog for Design and Deployment, Nils H. Rasmussen, Manish Bansal, and Claire Y. Chen
-
Information Dashboard Design: The Effective Visual Communication of Data 1st Edition by Stephen Few
Glossaries
Human resources is a wide-ranging discipline that requires a large vocabulary to manage people and processes. Take advantage of these comprehensive terms listings:
Organizations
All of the following non-profit organizations provide a wealth of resources for its members, including coursework, certifications, books, periodicals, and mentorship:
Master HR Dashboards with Smartsheet for Human Resources
Empower your people to go above and beyond with a flexible platform designed to match the needs of your team — and adapt as those needs change.
The Smartsheet platform makes it easy to plan, capture, manage, and report on work from anywhere, helping your team be more effective and get more done. Report on key metrics and get real-time visibility into work as it happens with roll-up reports, dashboards, and automated workflows built to keep your team connected and informed.
When teams have clarity into the work getting done, there’s no telling how much more they can accomplish in the same amount of time. Try Smartsheet for free, today.