How to Make a Gantt Chart in Word with Microsoft Word 2018 and Later
To make a Gantt chart in all versions of Microsoft Word 2018 and later, follow our step-by-step instructions. They also work for creating Gantt charts in Microsoft Word 2016 and some earlier versions. Refer to the images for guidance.
Prepare the Word Document
- Open a new Word document.
- Click the Layout tab on the navigation bar.
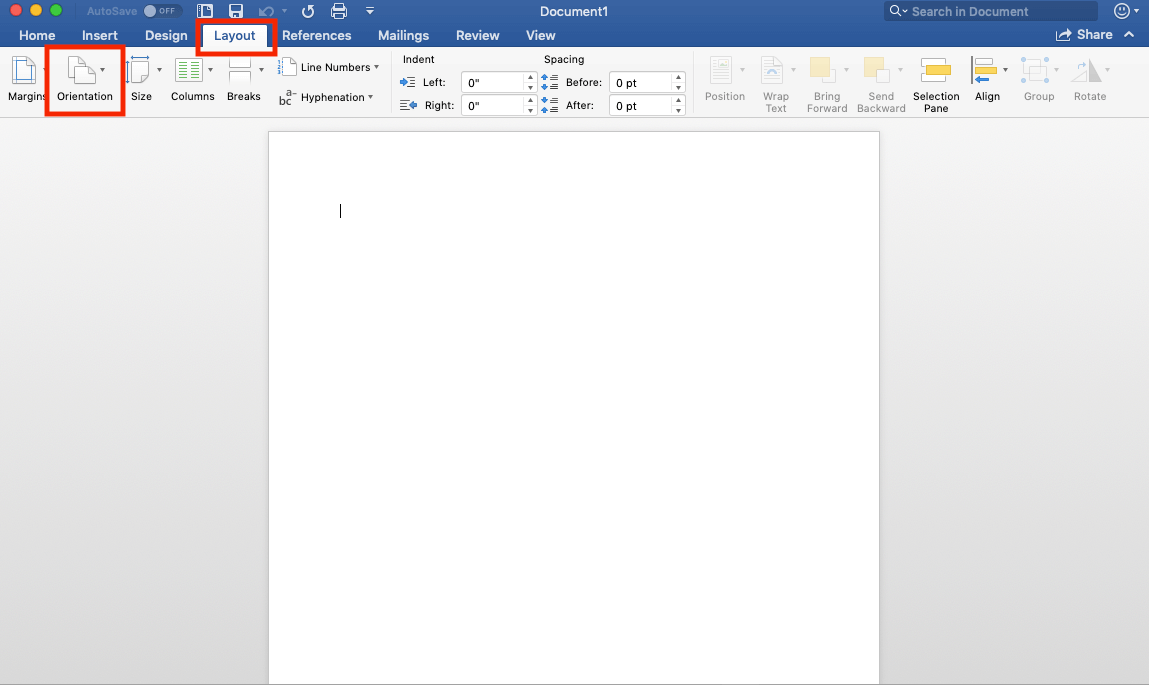
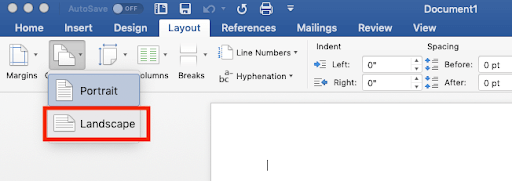
- Click Orientation, then click Landscape.
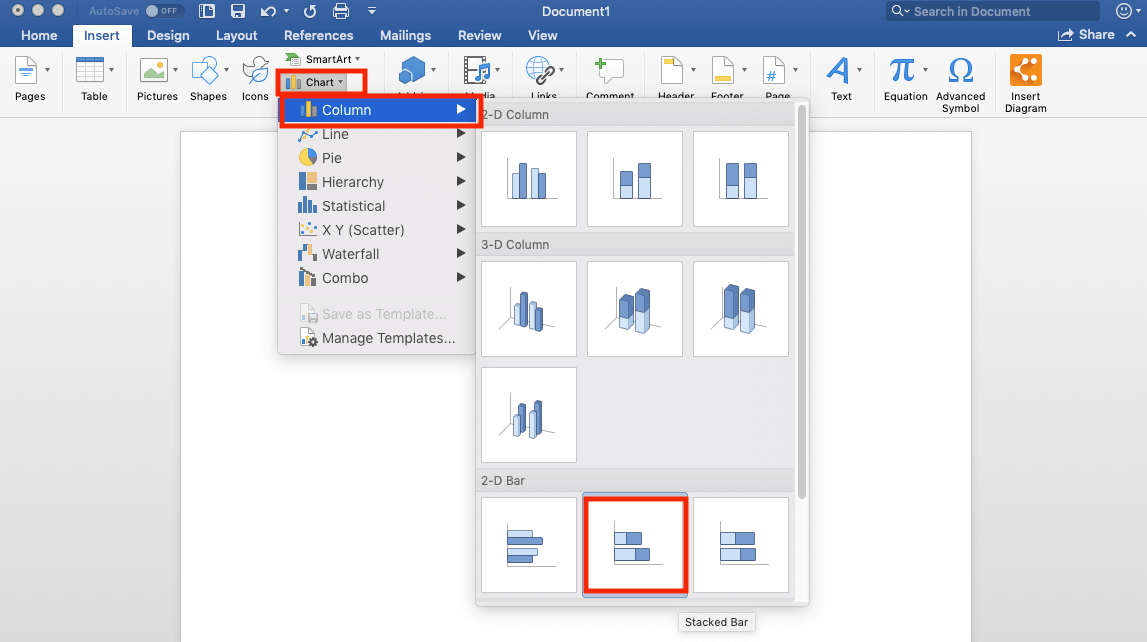
Build a Stacked Bar Graphic
- Click the Insert tab, then click Chart.
- In the popup window or the dropdown menu that appears, click the Column category, then click Stacked Bar for the type of graph.
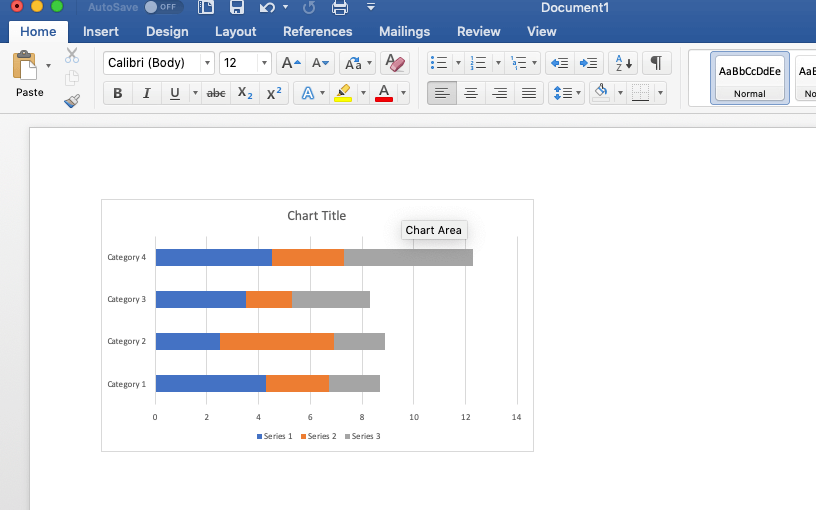
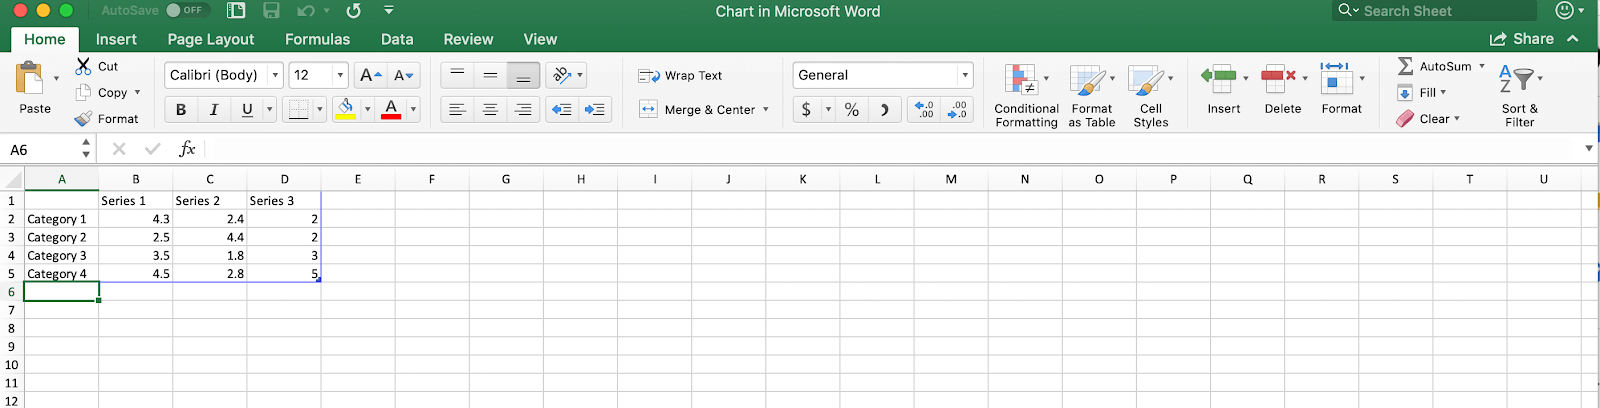
Word generates a standard bar chart graph on the document. Microsoft Excel automatically opens with a data table for inputting project information.
Add Project Schedule Data to Chart
Enter the data for your project in the Excel sheet to populate the stacked bar chart in Word.
- Input your project information in the corresponding Excel chart.
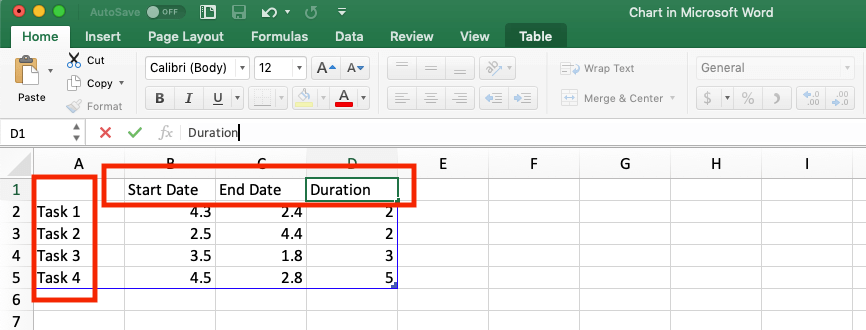
Pro Tip: If the Excel sheet disappears, in the Chart Design tab of the Word document, click Edit Data in Excel. - In Column A of the Excel table, list each project task name.
- Rename columns B, C, and D of the Excel table as follows:
- Cell B1: Start Date
- Cell C1: End Date
- Cell D1: Duration
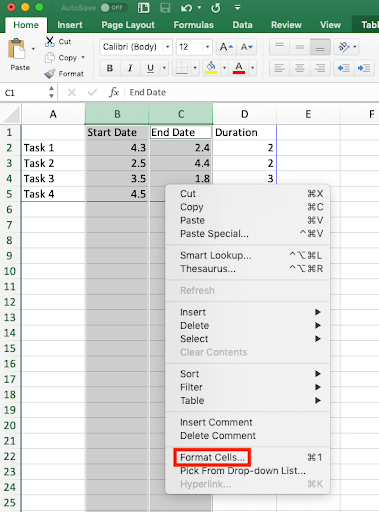
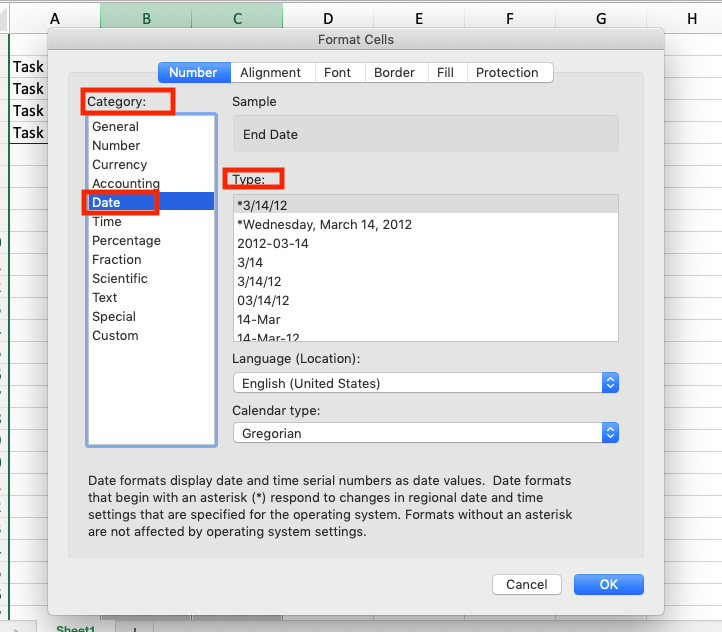
- Format the start and end date columns to display the correct data.
Select column B and C. Right-click, and click Format Cells. In the popup window, in the Number section and Category list, click Date. Scroll through the Type menu and click the desired date format. Click OK.
- Insert the start and end dates for each task in your project.
- Calculate the duration of your first task.
Click Cell D2 and type the following formula: =C2-$B2
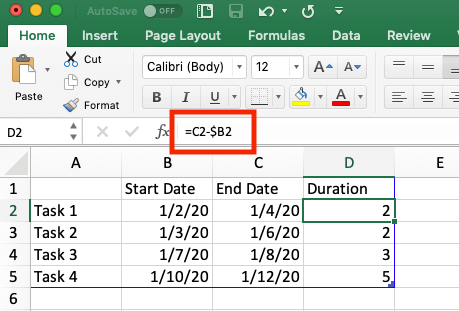
- Duplicate the formula for the remaining cells in column D.
Click Cell D2. Click the small box in the bottom-right corner of the cell, and drag it down column D until you reach the last task in the column.

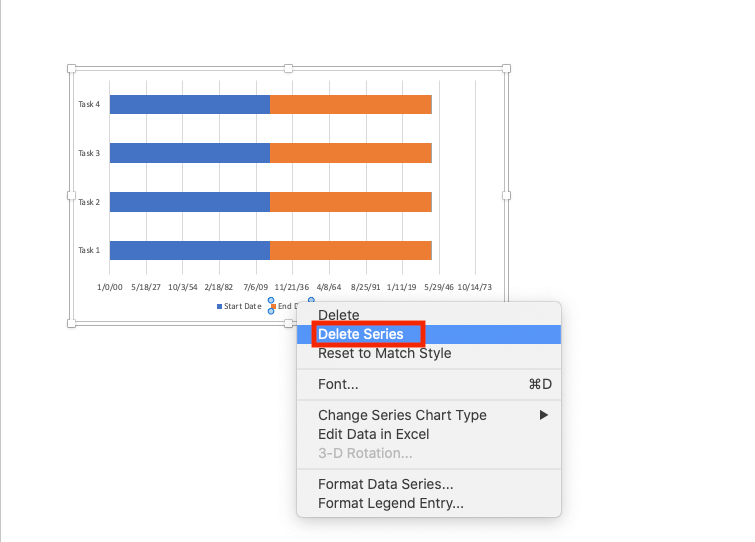
- Verify and edit the chart.
Return to the chart in Microsoft Word. You will see that the data from the Excel sheet now appears in the stacked bar chart. Select End Date in the legend at the bottom of your chart, right-click, and click Delete Series.
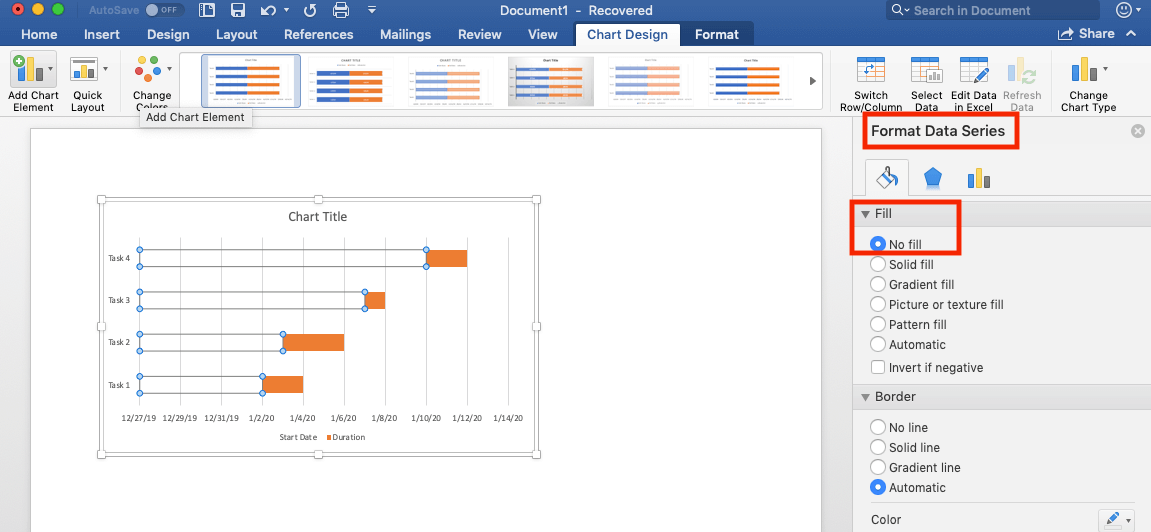
Turn Your Stacked Bar Chart into a Gantt Chart
- Click any of the blue bars on your chart.
The Chart Format menu will appear on the right. - Click on the paint bucket icon. Click the Fill button, then click No Fill.
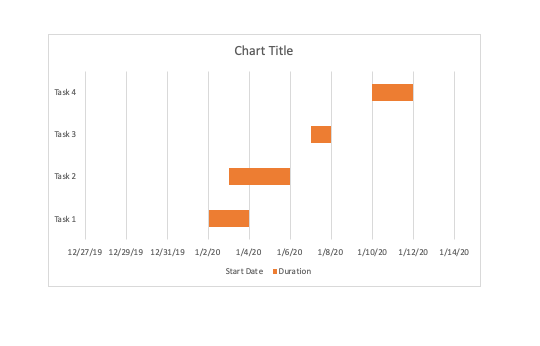
- Once you unfill the series, your bar chart will resemble a Gantt chart.
Interested in creating a Gantt chart in Microsoft Excel instead of Word? Visit this article for step-by-step instructions on how to build a similar Gantt chart in Excel.
How to Customize a Gantt Chart in Microsoft Word 2018 and Later
When you customize a Gantt chart, you make it even easier to view your project and track progress. Learn how to color-code and reorder tasks or make other adjustments by following the steps below.
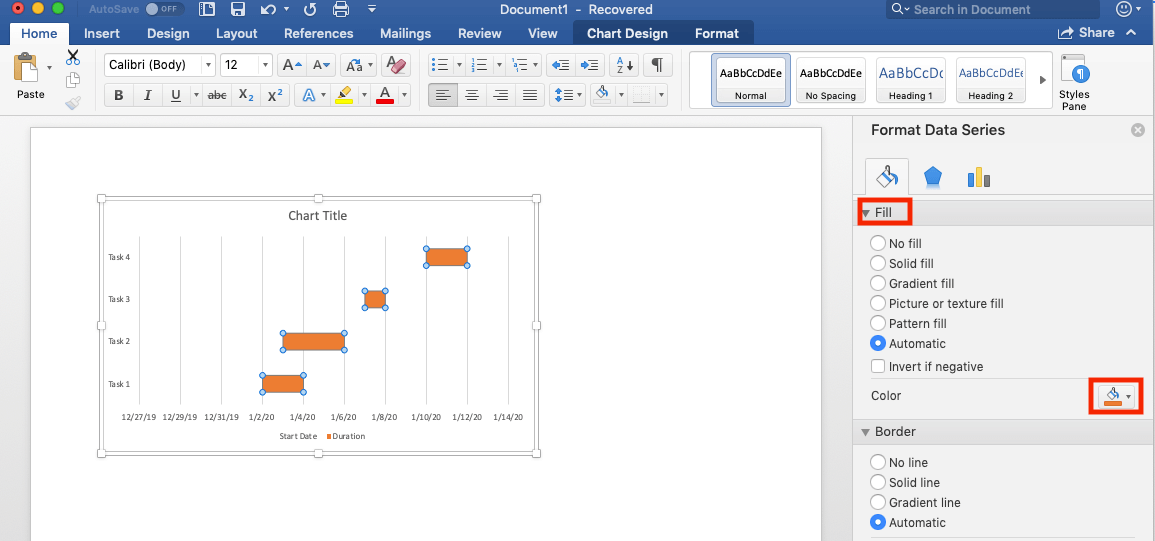
Customize Task Bar Colors
- Change the color of task bars.
Click on any of the task bars in the Gantt chart. Click Fill from the Format Data toolbar. Click the paint bucket, then click a color.
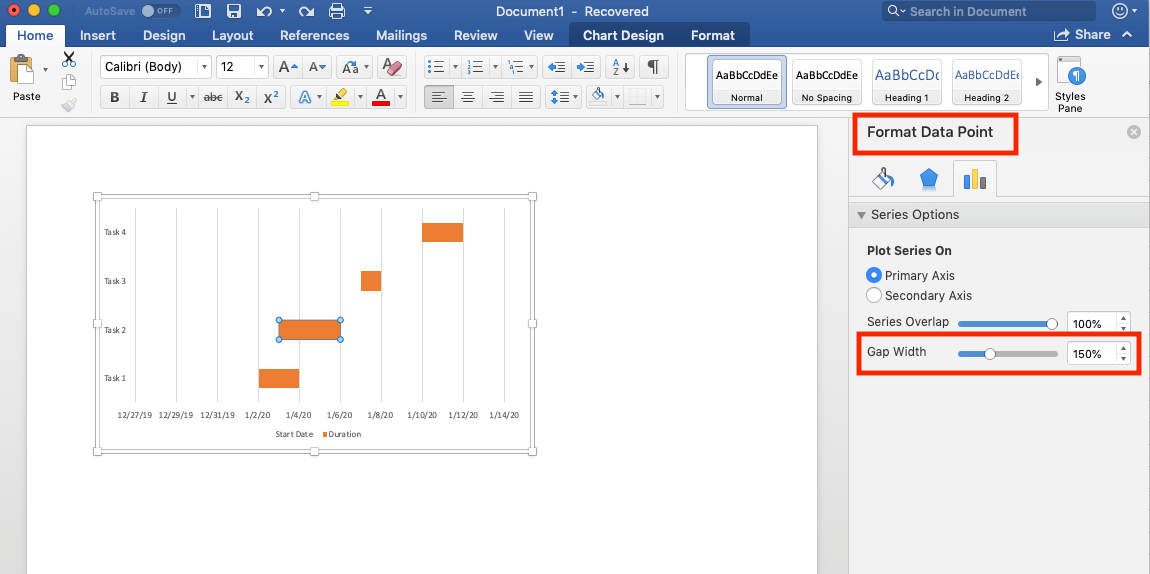
Reformat Task Bars on Axis
- Double-click on any bar in the chart.
You will see the Format Data Point menu and the Series Option tab on the right. - Click on the scroll bar for Gap Width.
Slide the button left or right to adjust the amount of space that appears between the bars on the chart. You can also enter a percentage in the corresponding box.
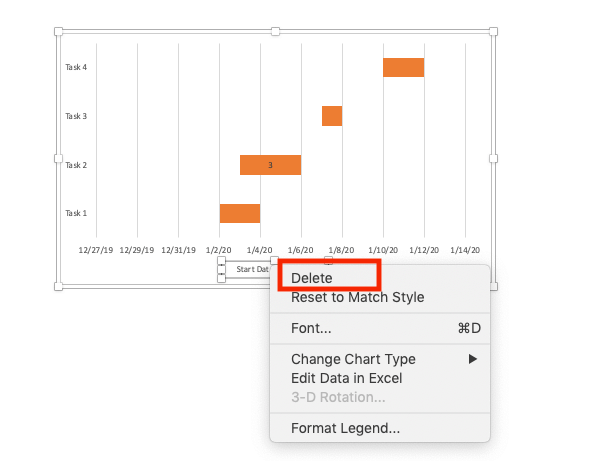
Remove the Legend from the Gantt Chart
- Click the chart legend.
Right-click and click Delete from the dropdown menu. You can also click on the legend and press Delete on your keyboard.
Download Gantt Chart Templates in Word
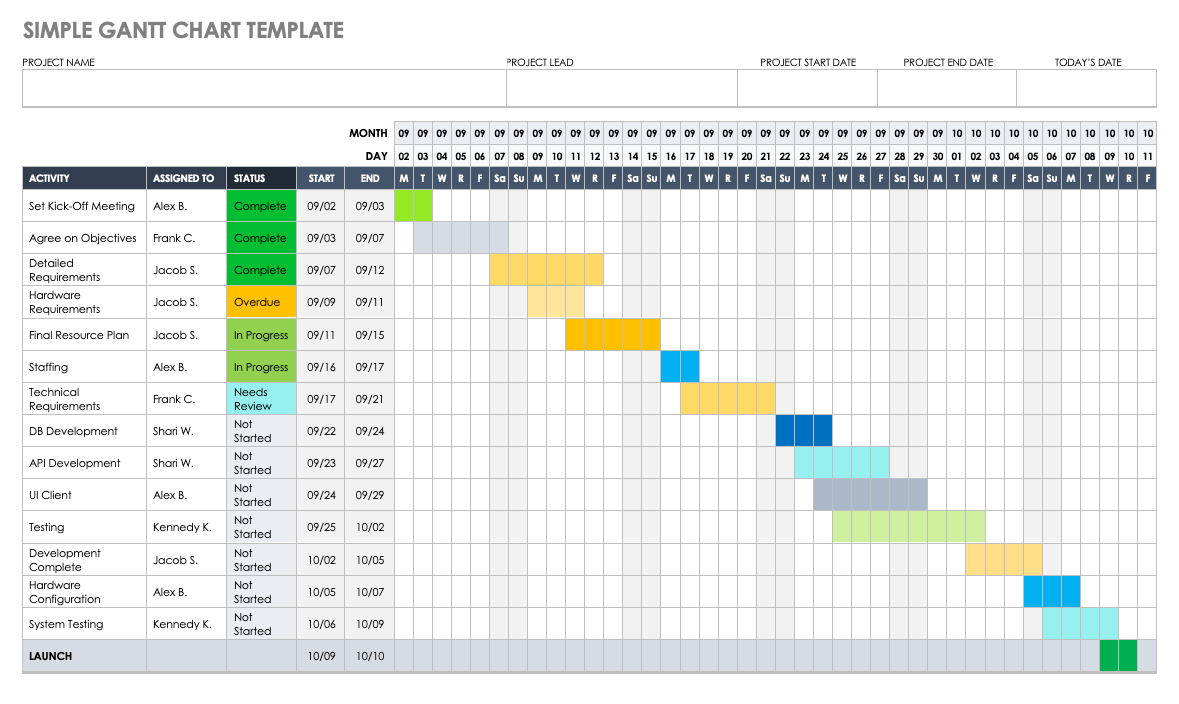
Prefer to avoid all the formatting and setup tasks? Use this simple Gantt chart template to track all project tasks. It includes space to note all project details, such as project owner, deliverables, and start and end dates.
Get the Most Out of Your Gantt Charts with Smartsheet
Empower your people to go above and beyond with a flexible platform designed to match the needs of your team — and adapt as those needs change.
The Smartsheet platform makes it easy to plan, capture, manage, and report on work from anywhere, helping your team be more effective and get more done. Report on key metrics and get real-time visibility into work as it happens with roll-up reports, dashboards, and automated workflows built to keep your team connected and informed.
When teams have clarity into the work getting done, there’s no telling how much more they can accomplish in the same amount of time. Try Smartsheet for free, today.
