What Is Scoring OKRs?
The terms scoring OKRs or grading OKRs refer to the practice of setting criteria for evaluating success — critical to the OKR process. When scoring or grading an OKR, you declare the level of completion for each key result.
One aim that companies have with OKRs is to focus everyone on essential goals. By aligning company-wide efforts, OKR grading provides accountability and tracking for those goals, unlike traditional goal-setting, which can get lost in the buzz of daily activities and problem solving. You can use regular reviews and OKR scoring or grading to highlight objectives that teams can keep top of mind and invite conversation about why work is progressing or stagnating.
How to Grade OKRs
You grade OKRs on a scale, usually from 0.0 to 1.0, where 1.0 means complete. Increments along the scale indicate levels of completion. Usually, you grade each key result individually, then average the scores to grade the OKR.
You also weight key results based on which results play a crucial part in completing the objective, then take that weighting into consideration when scoring key results. Let’s say your objective is to expand your jewelry business across the southwest. One key result might be to open five stores. Another key result might be to hire an amazing ring designer. If you open only two stores but have an incredible artist on your team, you might say you accomplished your objective. Word-of-mouth from happy engaged couples and others can bolster your company’s bottom line equally as well as new stores would.
Ideally, you grade your progress throughout your cadence period, which refers to the duration of time that you work on key results (for most companies, this is a quarter). Many companies conduct a weekly OKR review in which teams provide an interim grade for each key result; other companies evaluate OKRs only at midterm.
Frequent reviews help you and your colleagues track progress and gauge the likelihood of completing key results. Routine grading also shows which items you can’t complete, so teams can focus their energy on the viable key results. Learn more about cadences in our guide to writing OKRs.
No matter how often you review OKRs, you will assign final grades at the end of each quarter. Start determining the final score two weeks before the end of the cadence period— the earlier you understand what work you completed, the sooner you can set new OKRs, reset existing OKRs that you didn’t complete (but that are valuable), and plan for the next quarter.
You can use several methods to grade OKRs. Regardless of the method you choose, you’ll need to determine at the outset what scale to use, what each increment represents, and how to define progress. For example, if your key result is to win 20 new memberships, will winning 10 memberships score an 0.5, or will 14 memberships score an 0.7? In addition, each key result needs its own scoring criteria. The whole team must clearly understand the scale for each key result they will work on.
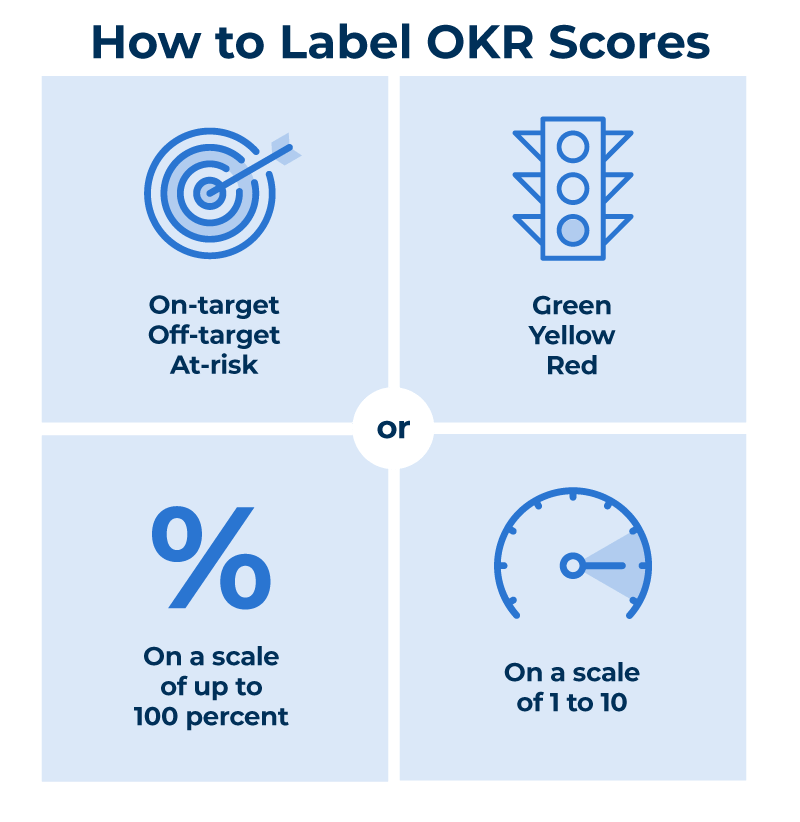
In your meetings and your tracking reports, you can label scores one or more of the following ways:
- On-target
- Off-target
- At-risk
Or
- Green
- Yellow
- Red
Or
- On a scale of up to 100 percent
Or
- On a scale of 1 to 10
Some experts suggest that if a key result is activity-based (something that you either do or don't do), you should assign only a binary score (either a one/zero or yes/no). Some experts also recommend this scoring approach for committed OKRs, which are critical goals that the team must complete. To learn more about committed OKRs, see our guide on writing OKRs.
By setting the scoring scale as you create OKRs, you also encourage discussion on whether goals are realistic for your team with the given time and resources. Tracking OKRs over the course of a year or more helps you estimate levels of effort and capabilities; you’ll also likely improve your OKR-setting skills.
Google OKR Grading Scale
The Google OKR grading scale ranges from 0.0 to 1.0, where 1.0 indicates 100 percent completion. In this system, you grade each key result, then average the results to grade the overall objective.
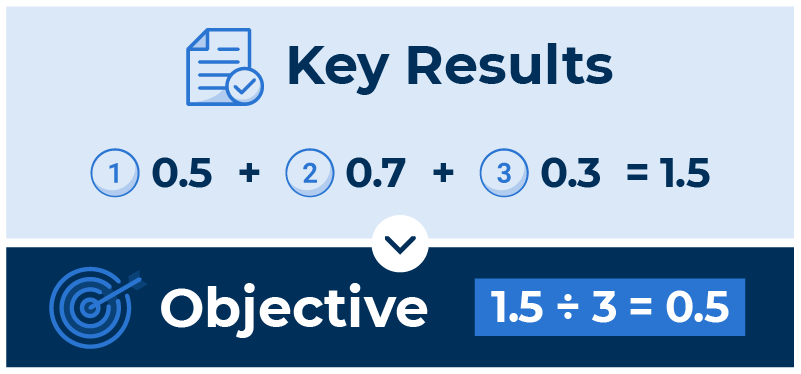
Averaging an OKR looks like this:
Key result #1: 0.5
Key result #2: 0.7
Key result #3: 0.3
Objective: 1.5 ÷ 3 = 0.5
In the Google approach, you complete an objective when you accomplish 70 to 75 percent of each key result. For aspirational objectives, consider scores of 0.6 or 0.7 as successful. Read our article on writing OKRs to learn more about the difference between aspirational and committed goals.
You can also expand your knowledge by reading our articles about the differences between OKRs and KPIs and OKRs and smart goals.
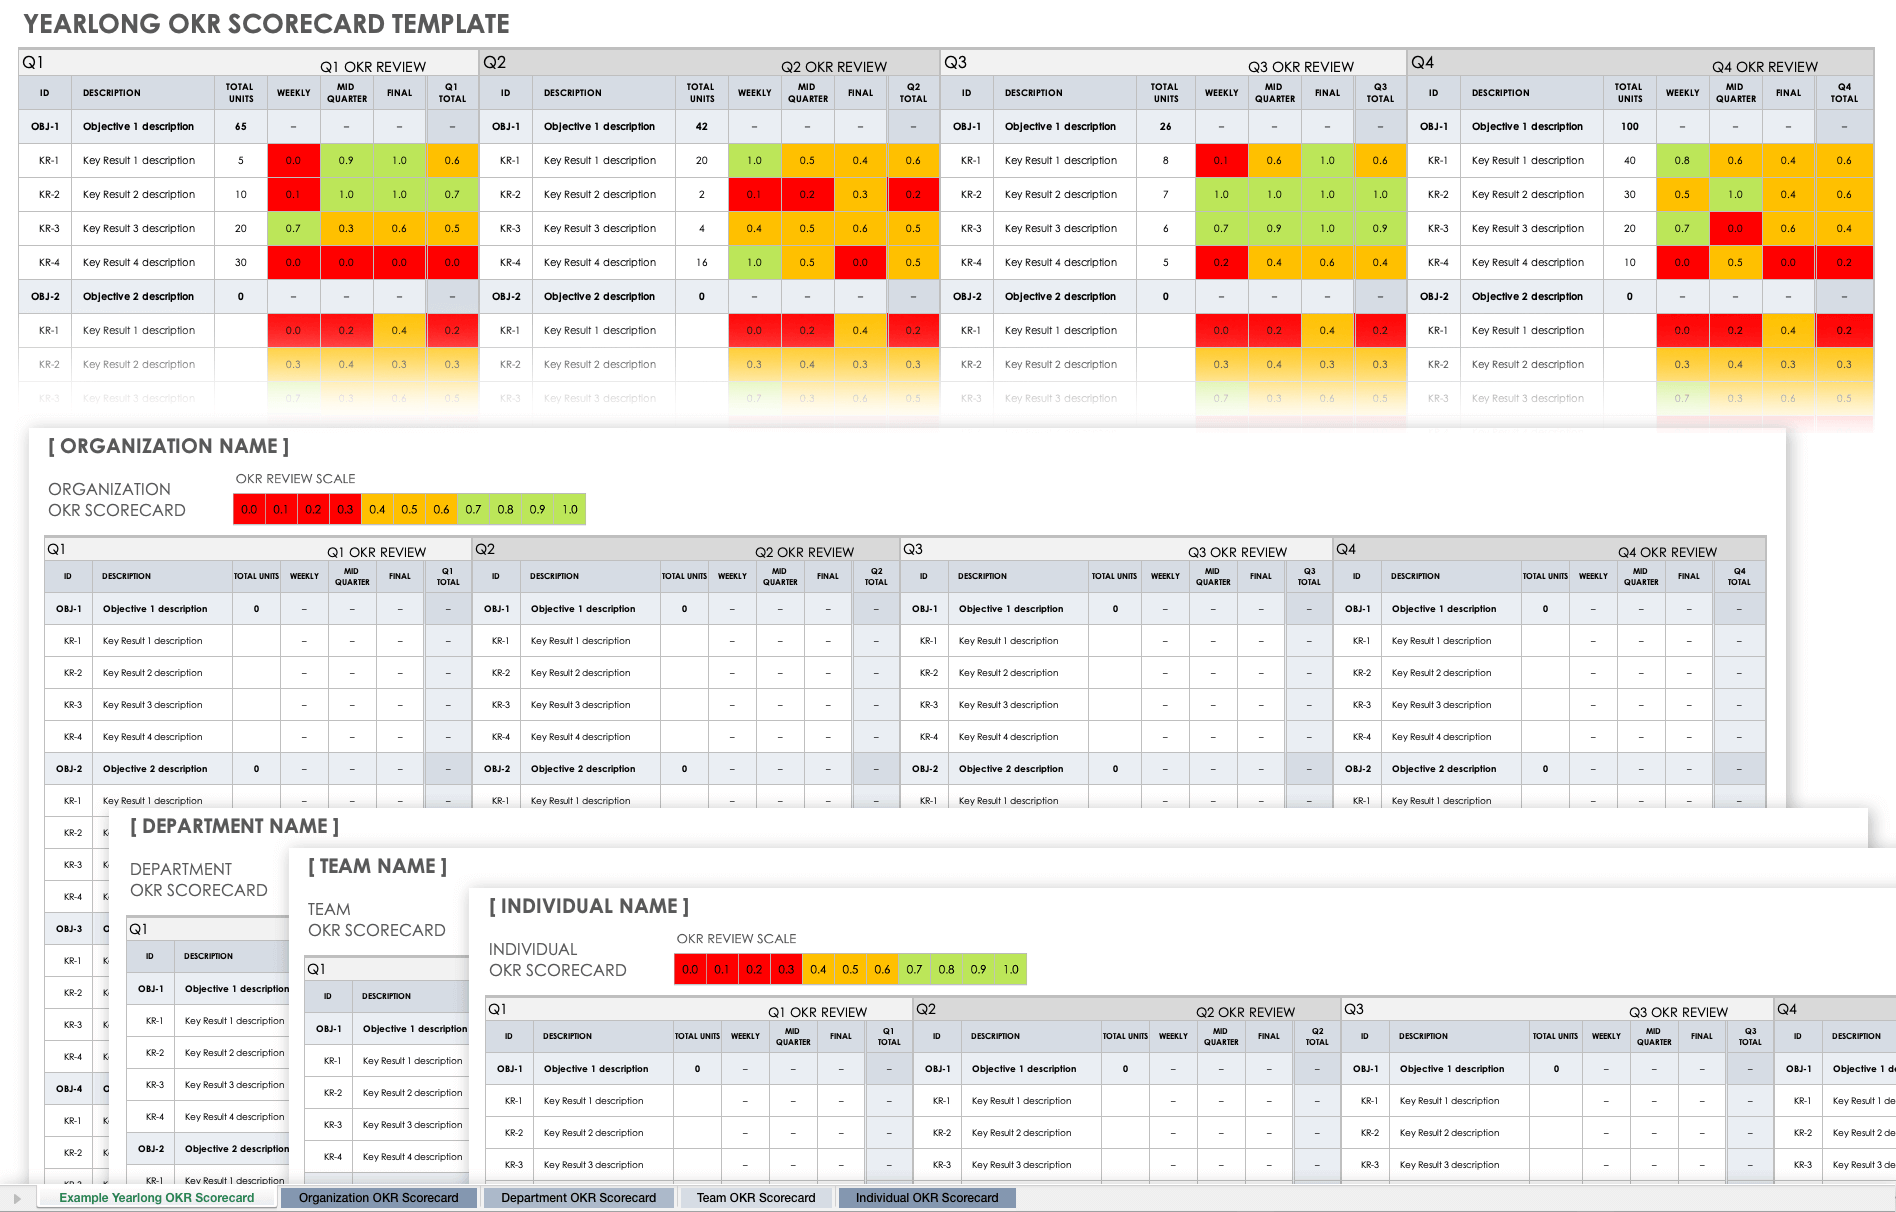
Year-Long OKR Scorecard Template
This year-long scorecard includes a space for you to link to your organization’s vision statement, so you can keep the big picture in mind as you create and work toward your OKRs. The template also provides space for you to track quarterly OKRs for the organization, department, or team. Track the scores weekly, at the midterm, and for the final grade.
Download Year-Long OKR Scorecard Template
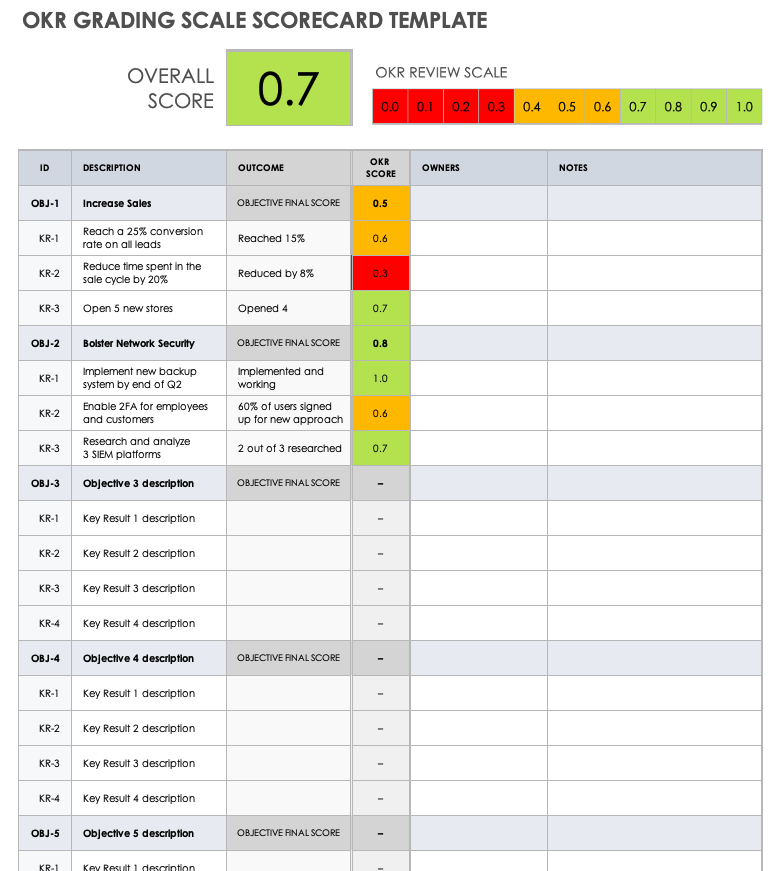
OKR Grading Scorecard Template
Use this downloadable OKR grading template to track team or individual OKRs. The template includes an example of how to grade your key results. It also offers an example OKR scale to guide you in assigning scores.
Download OKR Grading Scorecard Template
The Andy Grove Method (AKA the Binary Method)
The binary scoring method, which has an advocate in the so-called founder of OKRs, Intel’s Andy Grove, is a yes-or-no approach — either you built the garage, or you didn’t. If you have a partially finished product — e.g., a well-constructed garage that only lacks paint on the trim — you still fail.
While this approach can further motivate the team to execute, it can also be demoralizing. Individuals, teams, and managers should still consider the wider context of how people’s efforts contribute to the advancement of the organization, even if they didn’t complete goals.
Predictive or Confidence Scoring
Predictive scoring, also called confidence scoring, is an alternative to historical scoring. Using this method, you gauge what you have already accomplished; doing so warns the team if you aren’t on track to achieve a key result (and if you likely won’t).
For example, suppose your software counts citrus fruit. The goal is to sell 12 software licenses, but you sell only 5 before a frost blights an orange crop. Because customers might or might not need more licenses, you communicate to the company that you doubt you can meet the goal. Colleagues can then manage the outcomes for their department or for the company.
To score using this method, teams or managers describe their confidence level on a scale of 1 to 10, or as a percentage. The team lead sets a confidence level at the start of the quarter (usually 50 percent), and at each weekly OKR meeting, team representatives indicate whether their confidence has grown or waned. Confidence levels can fluctuate at the start of the quarter but should settle by midterm.
Because the predictive method helps build forecasting and planning skills, it is well-suited to smaller groups or teams that are new to OKRs. The process also works well for organizations that must pivot quickly to change priorities.
In general, the value of this method is that the sooner teams can identify which OKRs succeeded, the sooner they can begin planning for the next quarter. And if confidence levels drop, teams have an opportunity to discuss priorities and switch focus.
Grading on Key Results Type
Although many practitioners promote metric and target-based key results, some key results describe activities or outputs that are binary: Either teams complete them, or they don’t. One method is to identify which key results fit in each bucket, and grade metric key results as a percentage complete and binary key results with a score of 1 or 0. That said, your company or team might need to devise its own approach to grading key results.
The No-Grade Approach
Grading can be a subjective process, where scoring is weighted based on particular circumstances. Because key results frequently include metrics, some suggest that it’s easier and more objective to use the same metrics to gauge achievement, rather than assign a separate grade on a 0-to-1.0 scale.
Scoring Method Comparison Chart
This chart summarizes different scoring methods, with information on how to use each method, as well as when, why, and who uses them.
| Method | How? | Why? | Who? | When? |
|---|---|---|---|---|
| Binary Method | Assign each key result a 1.0 for completion or a 0 for incompletion, or a yes or no. | This method is ideal for key results that you either accomplish or don’t. | Anyone | Use this scoring method at the end of the cycle. |
| Google Method | Assign each key result a score on a scale between 0 and 1.0, with 0 representing a failed or never started item, and 1.0 representing successful completion. A score below 0.6 is poor, and 0.6 to 0.7 is acceptable. The scores of each key result contribute to an approximate average for the OKR score. Key results might have different weights. | The score presents an agreed-upon method for judging progress toward growing value and creating impact. | Company, teams, individuals | Use this method annually, at the end of the quarter, and in periodic reviews throughout the quarter. |
| No Score | Use metrics within key results to measure progress and achievement. |
Some people consider other scoring methods subjective and complicated. |
Anyone |
Use this method throughout the cadence cycle and at the end of the cycle. |
| Predictive or Confidence Level | Predict how likely you are to finish a key result. Start at 50 percent and adjust at weekly meetings over time. | When you assess progress throughout the cadence period, you can anticipate problems, notify team members, and prioritize work that the team can or must finish. This helps you change direction if needed. | Teams that are new to OKRs should use this method. It also works well for small teams, or teams that must pivot to meet new challenges, such as startups. | Use this method weekly or at midcycle OKR review meetings. |
Considerations when Grading OKRs
Ideally, OKR scores fall between 0.6 to 0.7 (60 to 70 percent). If scoring below 0.6, your team is underperforming. If consistently scoring above 0.7 or completing 100 percent of the results, your goals might be insufficiently ambitious.
Consistently high scores might indicate that teams are sandbagging, or setting goals they know they can achieve. This often happens when people fear that their performance on OKRs is tied to performance reviews and bonuses or raises. Grading OKRs is not a personal judgment on performance. OKRs should detach performance reviews from scores to encourage risk, potential failure, and thereby, growth without fear of professional penalties.
Problems with OKR Scoring
Sometimes implementation problems surface when organizations adopt OKRs. Scoring can present unique difficulties, such as confusion and frustration over the meaning of scoring ranges.
“You get people blaming other people when things don't happen, or they'll want to take credit when it works really well,” explains Daniel Montgomery, Founder and Managing Director of Agile Strategies and author of Start Less Finish More: Building Strategic Agility with OKRs. “The big change in the culture that OKRs should offer is people working together toward a stretch goal and learning with each other along the way.”
According to Darrel Whiteley, Master Black Belt, Lean Master, and Kaizen expert with Firefly Consulting, a disconnect can sometimes appear between key result scores and OKR completion. “If an objective is not met, and a team ends up with high scores on their key results, then they didn’t have the correct OKRs. In other words, they didn’t communicate well. This gets back to picking out the linkages between OKRs at different levels and driving them from the top to the bottom of the organization.”
Furthermore, teams sometimes lose sight of the big picture as they focus on completing key results. “That is where I have seen the biggest issue. Teams will hit all of the key results, and the objective is not even close to being met. Or they will hit three out of four, fail miserably on the fourth, claim success, and never consider the objective the key results were addressing.”
What Is OKR Tracking?
OKR tracking measures progress toward goals, known as objectives. OKR tracking includes weekly status meetings where teams measure how much they have accomplished toward the goal or how confident they are of achieving the goal.
With OKRs, teams have a greater chance of completing objectives because they must periodically assess their progress. Status meetings and OKR scoring focus the team on goals, so they can’t forget OKRs in the distractions of everyday business.
Tips for Grading OKRs
Make your OKR grading process as simple as possible, and adjust OKR scoring to suit your company or team. The following are tips for getting the best experience with OKR grading:
- Include scoring criteria for each key result upon initial creation. Determine the definition of each increment in the scoring system.
- Score key results, not objectives.
- Set OKRs quarterly, and review them weekly or monthly.
- Consider looking at your objective data subjectively. For example, you might have a key result to sell 40 cakes, and you sell only 25. But an ongoing weekly order for pastries might offset that objective “failure.”
- Publicly grade organizational OKRs. You can do this with meetings, posters, or online platforms. When you display this kind of transparency, you motivate people to strive for progress that they can share with the company.
- Use the scores from one cadence period to adjust and redefine OKRs for the next period.
- Don’t be afraid of low-scoring OKRs — learn from them.
- Be honest with your grading. OKR scoring is not a performance assessment.
- Use OKR software to record and track your OKRs and their scores.
- Use grading time to reflect on what went well and what to do differently in the future.
Benefits of Grading OKRs
Grading OKRs provides an internal benchmark (successes and shortcomings), so teams know what achievement level to target. The process enables teams to consider why work is off track, how to get key results on track, and whether to refocus on salvageable key results.
Track and Manage OKR Scoring with Real-Time Work Management in Smartsheet
Empower your people to go above and beyond with a flexible platform designed to match the needs of your team — and adapt as those needs change.
The Smartsheet platform makes it easy to plan, capture, manage, and report on work from anywhere, helping your team be more effective and get more done. Report on key metrics and get real-time visibility into work as it happens with roll-up reports, dashboards, and automated workflows built to keep your team connected and informed.
When teams have clarity into the work getting done, there’s no telling how much more they can accomplish in the same amount of time. Try Smartsheet for free, today.


