What Is a Workflow Diagram?
A workflow diagram is a start-to-finish visual representation of a workflow, business process, or any set of steps you take to achieve a result. Diagrams show resource flows and hand-offs between roles, as well as task dependencies and ownership.

“A workflow diagram helps people understand how a team performs activities and achieves results,” explains Giles Johnston, Director and Co-Creator of Fraction ERP. “Because a workflow diagram highlights individual steps, it can help reduce cycle time [in production] and defects. Ultimately, a diagram can help raise productivity.”
A workflow diagram doesn’t have to be complicated — a quick sketch on paper or a whiteboard will suffice. You can also create a sophisticated drawing with specialized symbols drawn in a purpose-built workflow platform.
A workflow diagram is often called a flowchart, a process flowchart, a process map, a process flow diagram, or a process workflow diagram, among other names. Some people consider a workflow diagram to be a high-level overview of systems, but they can also include greater detail.
Many industries and businesses can benefit from workflow diagrams, including chemical, manufacturing, and other engineering specializations, to show the flow of materials and the relationships among major pieces of equipment. Workflow diagrams also serve as operating unit and system overviews for new employees.
What Is the Purpose of a Workflow Diagram?
A workflow diagram helps you visualize the process that underlies a larger project. Workflow templates showcase sequential steps, which helps the end user more easily understand, follow, and analyze each step.
Additionally, workflow diagrams describe the order in which steps must be completed and help to determine specific activities in a structured, easy-to-follow format. These diagrams help you to easily identify and make changes within a process for greater efficiency. Ultimately, a workflow diagram prompts you to capture, visualize, and build process requirements unique to any business process or vertical, from project management to healthcare to construction.
Components of a Workflow Diagram
The components of a workflow diagram convey information about what happens in a workflow. All workflows include inputs, transformations, and outputs. Boxes, lines, arrows, and other symbols represent these components in a workflow diagram.
- Inputs: Inputs are the resources required to complete a step or a process. You can also think of an input as the catalyst for a workflow step. Inputs include materials, staff, money, machinery, or data, and information.
- Transformations: Transformations represent how the inputs change to produce an output. You can think of transformations as triggers for the next step in the workflow. Transformations include such acts as forwarding an insurance claim for approval, building a lawnmower, or applying an algorithm to raw data.
- Outputs: Outputs are the result of transformations of inputs. Depending on the circumstance, an output can be an end product, such as a finished lawnmower, or the input for another process, such as an approved insurance claim that staff forwards to accounting to start the payout process.
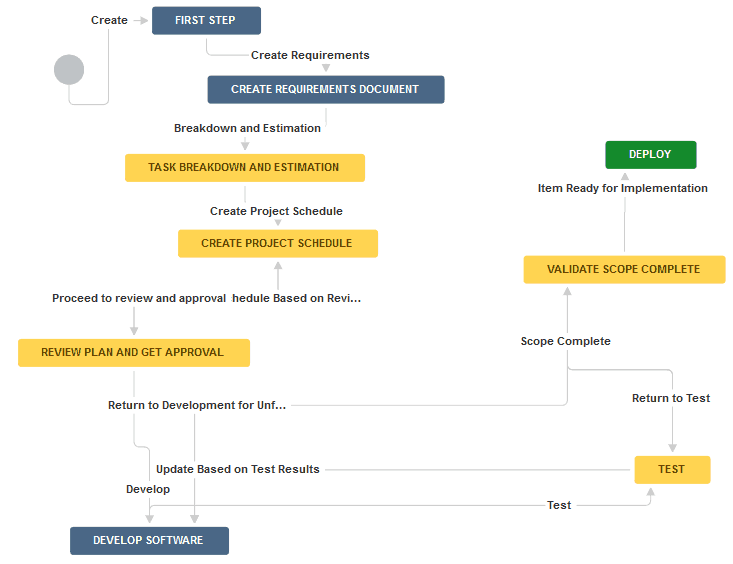
Complex workflow diagrams depict tasks, task sequences, decision points, and process flows, and they map alternative paths and rework loops or points at which the workflow returns to a previous step. It’s critical to include ownership of tasks or processes in your workflow.
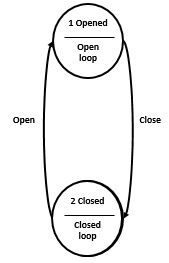
Below is a diagram of a workflow rendered in Atlassian JIRA. The colored rectangles represent steps in the workflow, the lines and arrows represent the potential paths, and the text describes the type of transition between stages.
Workflow Symbols and Shapes
Use workflow symbols and shapes representing different states or actions to build your diagram. While you don’t need to use every unique symbol available, specific shapes might make it easier to understand a complex process at a glance.
Depending on your industry, your workflow graphic might include specialized symbols, or you might only use boxes and connecting arrows to chart the flow. Most teams use around five symbols, but two or three might suffice.
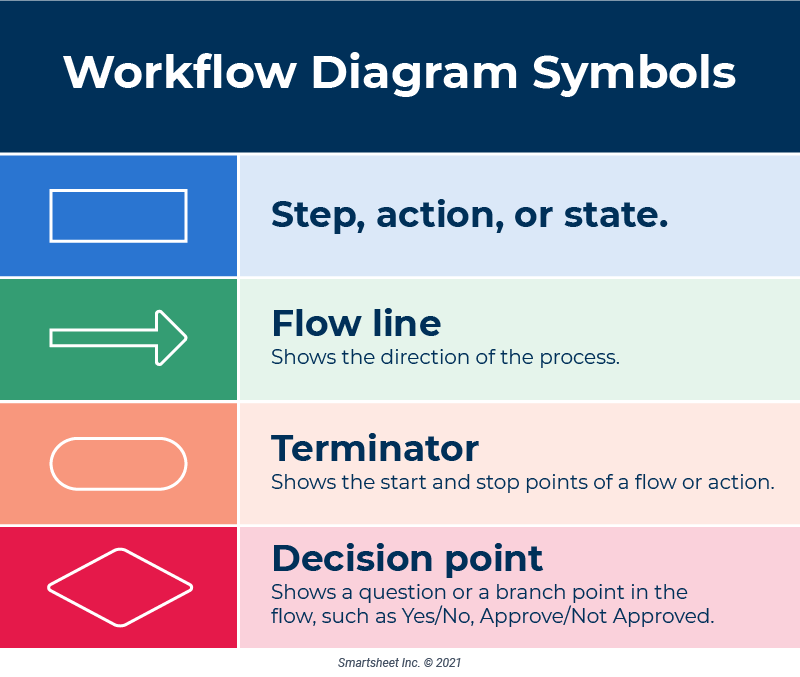
The following symbols are frequently used:
- Oval: Use this symbol to mark a process start or endpoint.
- Rectangle: This typically marks a step in a process.
- Arrow: Arrows indicate the directional flow of a process path or the process itself.
- Diamond or Rhombus: These symbols mark a decision point.
- Document: A document symbol indicates that the output or input is a document or report. Examples include completing and submitting a form, writing a memo, or creating a report.
Organizations may use a business workflow diagram across business functions and levels. As such, for clarity, you should establish a standard notation system that everyone uses, even if you customize symbols and shapes.
How Do You Read a Workflow Diagram?
To read a workflow diagram, first identify the diagram title, symbol key, and component ID numbers (for more complex drawings). Next, find the beginning of the process and follow the logical sequence indicated by the arrows.
Many industries format diagrams to read from left to right. When you approach a new workflow diagram, orient yourself with the specific layout convention of that field.
Once you understand the flow direction, read the symbols (see our discussion of symbols below). Consult the International Standards Organization (ISO), ANSI, or ASME symbol standards for your field to see specialized symbols.
How to Create a Workflow Diagram
You can create a workflow diagram in a few simple steps. First, decide on a key process to map. Next, make a simple sketch. You don’t need software — a pen (to draw symbols) and paper work fine.
“Don’t worry about having the right symbols,” says Johnston. “It’s more important that you capture the steps in the most minute detail as you can, warts and all. Worrying about notation can turn people off and can be intimidating. Instead, draw some boxes with arrows. It’s much more important to engage and feel comfortable with the diagramming process than it is to worry about whether you need a diamond or a box with a slanting side or a wavy line at the bottom.”
When your team agrees on a final draft, if you need a formal version, you can transfer the workflow diagram to drawing software or a workflow automation platform.
Follow these steps to learn how to draw a workflow diagram:
- Select Your Process: Understand the process and why you are diagramming it.
- Name the Process: The name should be active and start with a verb.
- Define Start and Endpoint: Set boundaries on the process. According to Johnston, “A lot of businesses make the mistake of mapping random process parts.”
- List Each Task or Step: Make sure to list each step in order, and note who owns it. Create a quick sketch that can serve as a tool for discussion and gaining team consensus. You may also consider adding cycle time and utilization into this initial sketch. Johnston also suggests including the little steps rather than one big box because you lose the opportunity for improvement without the detail.
- Include the Following in Your Drawing:
- At least one start node, because processes don’t happen midstream.
- At least two task nodes, because you need activities to make a process.
- At least one stop node, because nothing goes on forever. A stop node also helps users gauge if they achieved the result or output.
- Decision nodes, because not all workflows are linear. Workflows often contain yes/no choices and alternative paths.
- Connectors, if you can jump between different process sections.
- Interface nodes for when the output of one process becomes the input for another.
- Labels for all items.
- Explanatory notes where appropriate.
- Draw the Formal Workflow Diagram in Your Workflow Platform or Graphics Program:
- Consider who will use the diagram and the level of detail and presentation they require.
- If external stakeholders will see the document, avoid adding confidential information.
- For complex processes and system diagrams, make major process lines dark and minor process lines light.
- In complex diagrams, major workflow items are often numbered.
Types of Workflow Diagrams
A few types of workflow diagrams are available, including workflow diagrams, process maps, and flowcharts. Some people use these terms interchangeably, but they are distinct. Some formats work better for displaying different information or revealing specific insights.
Consider these different approaches when you’re deciding how to diagram a workflow process:
- Activity Diagram: An activity diagram shows the necessary component steps to create a result or product. These diagrams sometimes use unified modeling language (UML), but can also use simple notation.
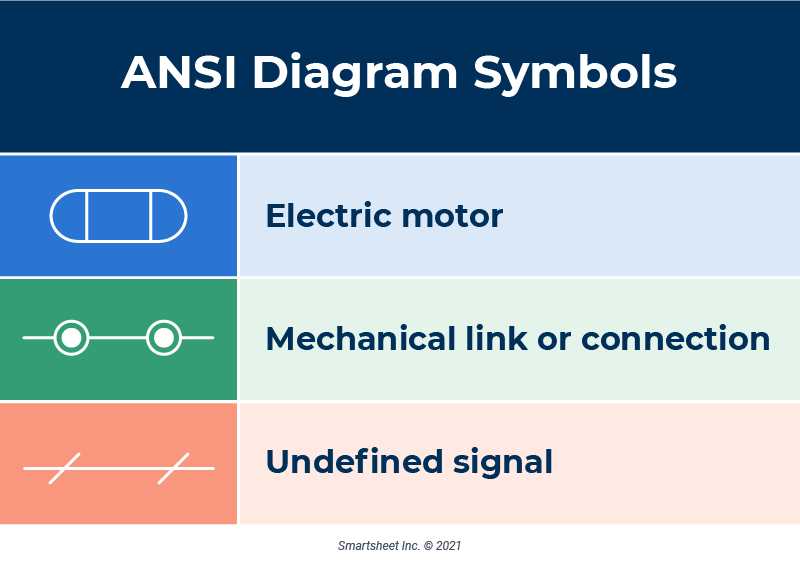
- American National Standards Institute (ANSI) Diagram: An ANSI diagram comprises symbols based on the ANSI workflow guidelines. ANSI notation was the first common language for workflows that depict engineering, utility, mechanical, software, piping and instrumentation (P&ID), and general process flows. The basic symbols are similar to other symbol sets, but include special symbols for such items as transportation, data transmission through faxes or phone calls, switches, and more.
- Basic Flow Diagram: Use this type of diagram to show simple or speculative processes, or to understand the chronological order of steps. This type of diagram may use only a few basic symbols.
- Business Process Model and Notation (BPMN): BPMN depicts high-level processes, data flows, and systems. BPMN uses formal symbols and layouts to make processes intelligible across teams and organizations, whether for technical or business users.
- Data Flow Diagram (DFD): A data flow diagram shows the data or information flow through a process or system. These diagrams do not include decision points.
- Process Flow Diagram: A process flow diagram shows chemical, manufacturing, or other processes to indicate key equipment and the flow of materials. Process flow diagrams also depict basic organizational processes or provide context for activities. These diagrams may be simple workflows, but are sometimes formal documents in BPMN.
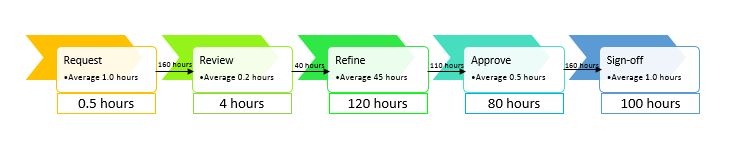
- Suppliers, Inputs, Process, Outputs, Customers (SIPOC) Diagram: A SIPOC diagram shows critical steps in a workflow and the relationships among process owners, inputs, and outputs. To understand handoffs and cadence, add a timeline to a SIPOC, which can help depict the scheduling expectations versus actual work being done.
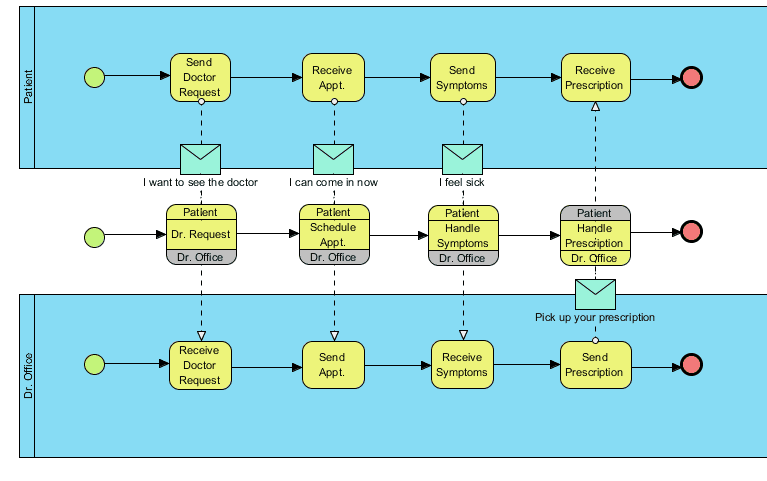
- Swimlane or Cross-Functional Diagram: A swimlane diagram (also called a cross-functional diagram) shows how roles function in a process and how a process moves between different departments. Swimlane diagrams can show redundant roles and steps, as well as reveal any tasks and processes that departments share. These diagrams help to identify bottlenecks or cases in which you should transfer ownership of a process to another role.
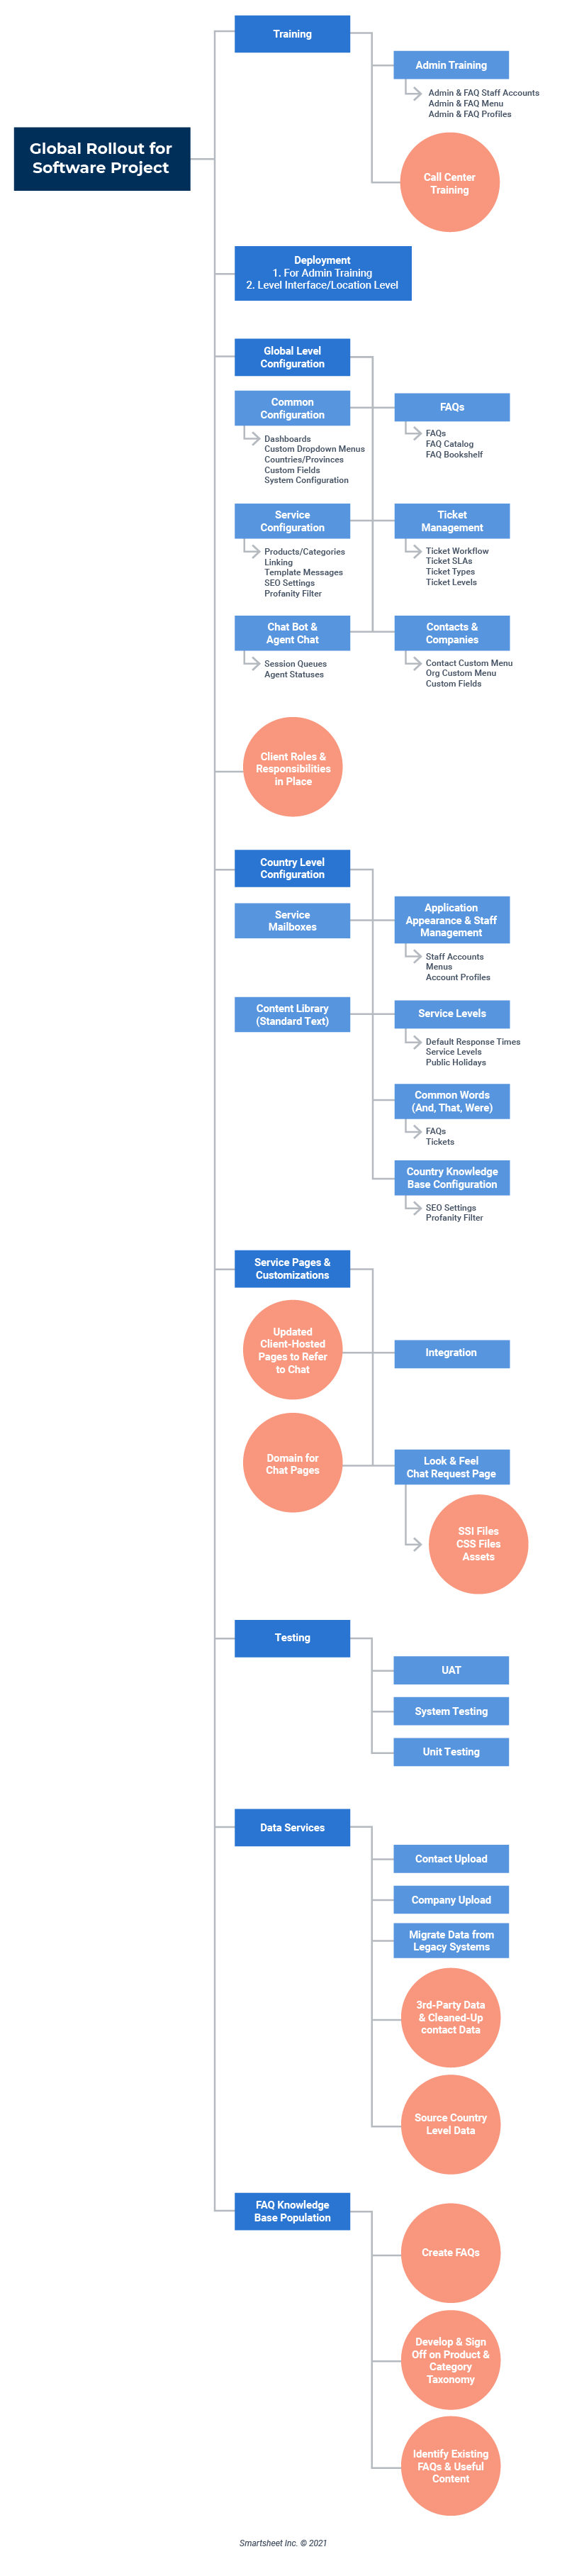
- Top-Down Diagram: A top-down diagram details only major steps and is often complemented by a detailed flowchart.
- Unified Modeling Language (UML) Diagram: A UML diagram is often used in computer architecture. UML diagrams have nine variants, each of which has a particular focus, such as interactions, objects, or sequences.
- Value Stream Diagram: A value stream map shows how goods or information flow to create a product or add value for a customer. These diagrams are tools for finding waste and bottlenecks in a process.
Workflow Diagram Examples
Workflow diagrams can depict a hiring process, the stages of a plan, or the user path for an app. As the following workflow chart examples show, almost any industry or endeavor can benefit from workflow diagrams.
- App Developer: An app developer workflow highlights the steps a developer uses to create a product. In our example, a workflow diagram details how a software feature works.
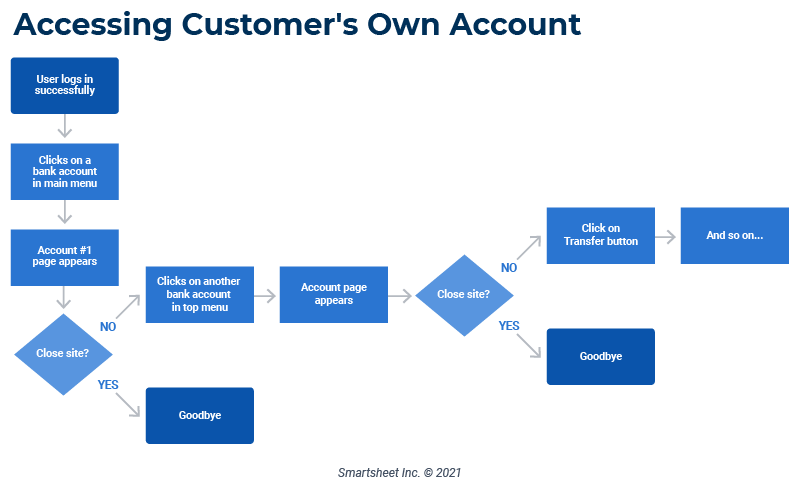
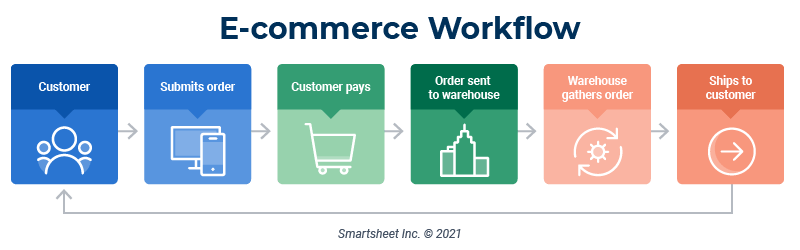
- E-commerce: An e-commerce workflow diagram shows how a customer requests and receives an order. This workflow includes two paths for online or phone orders and a path for fulfillment.
- Education: This education example shows the process for registering a student. It is a swimlane diagram that displays the activities for each role.
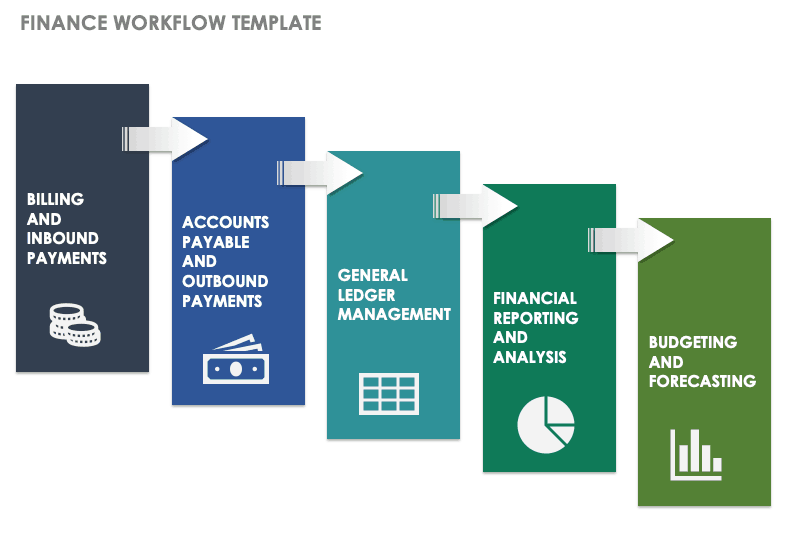
- Finance: This example of a finance workflow demonstrates how an employee submits a request for a new purchase. It uses the document symbol when a form is created and shows decision points and alternate paths.
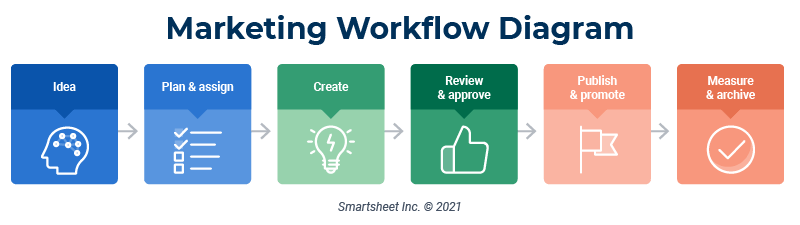
- Marketing: This overview workflow diagram walks you through the high-level steps of creating and implementing a marketing plan.
- Medical: This medical workflow diagram is a colorful depiction of steps in a patient intake and discharge experience.
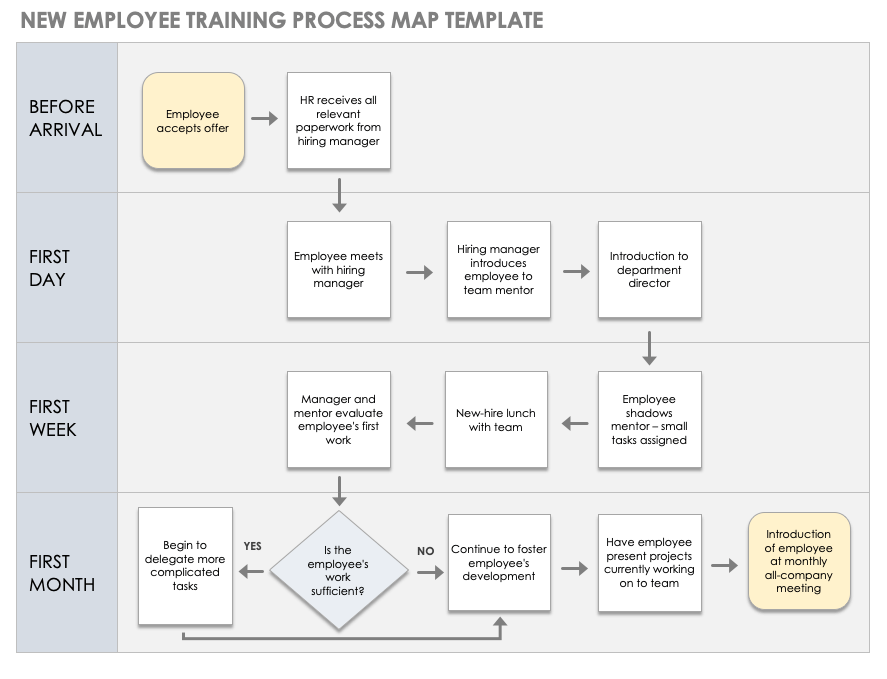
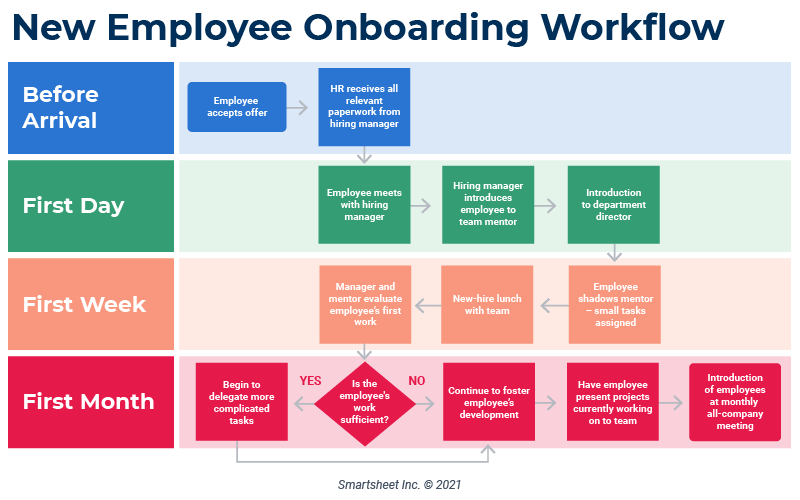
- Onboarding: In this example, swimlanes represent a timeline for onboarding activities. The diagram steps users through the required activities, describes task owners, and shows the task sequence.
Why Is a Workflow Diagram Necessary?
A workflow diagram can seem superfluous in a business process, as it outlines and details the simplest of tasks. However, workflow diagrams are an extremely helpful resource in identifying key details, such as the following:
- Appropriate team members for each process
- Areas for improvement or a process that could increase efficiency
- Data collection or monitoring
- Approval processes and key stakeholders who provide approval
- Team alignment on planned process steps
Additionally, workflow diagrams can make even the most complex, detailed processes more understandable, clear, and concise. Workflow diagrams can also help businesses and their team members do the following:
- Show the flow between steps.
- Define, analyze, and discuss any part of the process.
- Standardize a process, and find and identify any gaps in the process.
- Identify problems, and eliminate any processes that don’t add value to the business.
- Facilitate communication and teamwork among team members.
- Keep everyone on the same page about a process and its ensuing processes.
- Provide a clear understanding of a process, why you continue to carry it out, and its business value.
People may veer away from using workflows for a variety of reasons. They may be hesitant to disrupt an existing process, want to maintain complete control over a process, or want to construct their own process that doesn’t follow a preformatted structure.
However, workflow diagrams help provide consistency and efficiency for all unique processes, which increases overall control and effectiveness of processes as team members carry them out.
Benefits of a Workflow Diagram
The benefits of a workflow diagram include efficiency and lower costs. Workflow diagrams help companies reduce waste and streamline processes. This efficiency leads to higher productivity, which translates to more revenue (which companies can further reinvest in improving processes).
In addition to positively impacting a company’s bottom line, the specific benefits of a workflow diagram are as follows:
- Helps you define steps and sequences
- Simplifies complex processes
- Improves efficiency
- Increases repeatability (this is important for measurability and continuous improvement)
- Reduces redundancy and waste
- Lowers costs
- Automates processes
- Helps you to respond quickly to problems
- Enables you to share process overviews and complicated steps quickly and easily
When to Use a Workflow Diagram
You can use workflow diagrams to get an overview of processes, as well as predict and prevent problems. Detailed workflow diagrams can help you complete tasks and ensure that work is on track. Workflows can also explain roles and responsibilities.
Additionally, a workflow diagram process aids workflow improvement by helping you anticipate and avoid defects and delays that can reduce productivity. Diagrams also surface shadow processes that should be eliminated or standardized.
What Are Workflow Diagrams Useful For?
Workflow diagrams are useful in several ways. Diagrams help create efficient approval processes and show where to assign resources and participants in a process.
In addition to the aforementioned benefits, workflow diagrams can help you in the following ways:
- Workflow diagrams specify the frequency of tasks and the ideal amount of time it should take to complete each task.
- Diagrams include task instructions for each process or an individual step in the process.
- Initiate the workflow after preceding steps, either automatically or manually.
- Send documents to key stakeholders for approval after step or process completion, and create one-time reviews for time efficiency.
- Set approval status and ensure steps are carried out only after approval is granted.
- Pause or stop the workflow at a specific point or until a specified date.
- Set the workflow status and send updates to any involved resources.
- Update steps directly within the workflow to increase efficiency.
- Track processes and deadlines and owners
- Capture “tribal knowledge” and support onboarding and training.
- Process analysis and improvement.
How to Analyze Workflow Diagrams
You can analyze workflow diagrams to identify bottlenecks and waste in processes. To do so, look for unnecessary steps and missing steps. For proposed workflows, ensure that all actions and flow directions are correct.
Johnston notes how analysis can help with process improvement. “I’ve seen people map out mammoth charts, and they realize that several steps are in the wrong place once they step back and look at it. That’s the real power of having a workflow diagram: being able to step back and say, ‘That no longer makes any sense.’“

“Before I would really start cementing my processes in place with formal workflows and workflow managers I think I would spend a lot more time with process diagramming,” says Scott Chaiken, Lean Program Manager at the Michigan Manufacturing Technology Center. “If I'm manufacturing and I'm looking at a shop floor, I might spend time with a Lean approach like value stream mapping. You’ve got to figure out how to consolidate. Ask yourself, ‘Why is there this double check here? Why am I having two signatures on this?’ Value stream mapping is going to take away a lot of transactions. You might rid the workflow of waste before you cement it in place.”
When analyzing existing processes, look for mismatched expectations among staff members. People may have different approaches to work, and some problems and improvements might appear obvious. In addition, consider why you created the diagram — the key takeaways may be different than if you look for general improvements.
Try the following steps to review your workflow chart systematically:
- Timing: People might disagree about how long steps or processes take. “If you go around and ask people, ‘When does the clock start?’ you’re going to get all kinds of bizarre answers,” says Chaiken. Review each process segment to anticipate problems.
- Logic: Are events misordered? Ask yourself how the steps should flow.
- Delays: Value stream maps are good tools for showing delays and waits. But time wasted may appear on other flows, too.
- Gaps and Breakdowns: Problems in a workflow appear as bottlenecks, incomplete inputs or outputs, steps done in a sequence that could happen in parallel, unnecessary dependencies, or inconsistent workloads.
- Missing Information: A step or the process itself may need documentation or work instructions.
- Missing Owners: Process and step owners keep the flow going to achieve the output. Responsibility is important information in a workflow. As Johnson explains, “It’s quite staggering the people who do these elaborate diagrams but still do not understand who is responsible for the different bits of a workflow.”
Learn more about analyzing workflows in this workflow analysis article.
Workflow Analysis Cheat Sheet
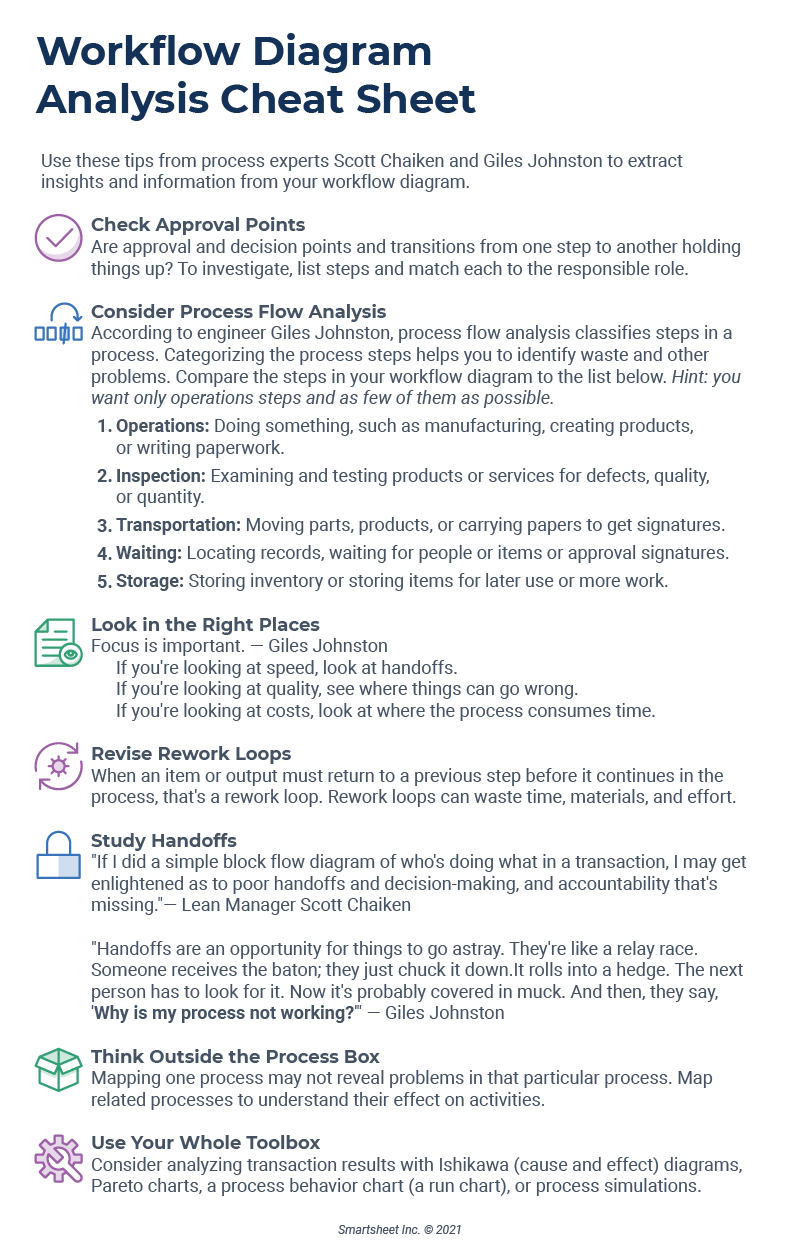
You can gain insights through the act of drawing and reviewing a workflow diagram. That said, you can discern even more if you look at components such as handoffs and approvals, and understand how to classify steps.
This free downloadable cheat sheet contains workflow diagram analysis tips from our experts Johnston and Chaiken. They show you where in your diagram to look, what to look for, and how you can investigate your drawing results further.
Workflow Diagram vs. Flowchart vs. Data Flow Diagram
Workflow diagrams, flowcharts, and data flow diagrams look similar, but may serve different purposes. Workflow diagrams often map all processes and their dependencies; flowcharts depict steps or algorithms; and data flow diagrams show data movement through processes or organizations.
Workflows can be expressed visually through flowcharts and process maps (the graphical representation of a workflow is simply called a diagram). A diagram helps you and your team understand the steps in a workflow, the order in which they occur, and what happens during each transition.
A flowchart may depict steps and transitions using specialized symbols for different disciplines. The most sophisticated expression of this graphical language is found in BPMN. A process map may offer more information on the requirements for each step.
Data flow diagrams show the flow of data or information within a process or system. They use the same symbols and text to describe inputs and paths between destinations and storage points. By contrast, DFDs don’t include start or end points or decision points.
History of Workflow Diagram
The workflow diagram, or flowchart, was first created and introduced by Frank and Lillian Gilbreth in 1921. This first iteration chart was called a process flowchart, but it has morphed into the modern-day workflow diagram.
The Gilbreths introduced the concept of the workflow diagram to the American Society of Mechanical Engineers (ASME ) and elaborated on it in the book Process Charts: First Steps in Finding the One Best Way to Do Work. Allan H. Mogensen, an American industrial engineer, was the first to apply the workflow consistently in his business and teach it to his team members in the early 1930s. He is considered the “father of simplification” for his popularization of workflow diagrams and flowcharts.
Their work provided a further development of the concept of scientific management started in the 1890s by Frederick Winslow Taylor. The scientific approach to production, called Taylorism, introduced the concepts of repeatability and measurement into management. One disciple of scientific management was American engineer and business consultant Henry Gantt, who, in 1910, introduced a popular precursor to the flowchart, the Gantt chart. Still used today, primarily in project management, Gantt charts depict the relationship between time and activities.
In the 1950s, functional block flow diagrams began to develop, which depict layers of functions. At this time, the U.S. Navy introduced Program Evaluation and Review Technique (PERT) charts — the p sometimes stands for project. By the 1970s, the U.S. Department of Defense developed IDEF notation, which was widely adapted by defence contractors and all branches of the armed services. A tool for identifying bottlenecks and encouraging logical thinking, the object-oriented focus of IDEF diagrams made them a strong fit for describing computer architecture.
Although workflow diagrams were originally used in manufacturing and chemical engineering, many industries employ some form of process diagrams. Recent developments for software engineering include UML. In 2004, the Business Process Management Initiative released version 1.0 of BPMN to describe business processes.
Get the Most Out of Your Workflow Diagrams with Smartsheet for Project Management
From simple task management and project planning to complex resource and portfolio management, Smartsheet helps you improve collaboration and increase work velocity -- empowering you to get more done.
The Smartsheet platform makes it easy to plan, capture, manage, and report on work from anywhere, helping your team be more effective and get more done. Report on key metrics and get real-time visibility into work as it happens with roll-up reports, dashboards, and automated workflows built to keep your team connected and informed.
When teams have clarity into the work getting done, there’s no telling how much more they can accomplish in the same amount of time. Try Smartsheet for free, today.