What Is a Data Dashboard?
A data dashboard is a visual tool that allows you to surface key performance indicators (KPIs) and other important metrics to view vital information at a glance. As the name suggests, data dashboards focus on highlighting data — rather than qualitative information — to provide insight and transparency into your initiatives. Dashboards can serve different purposes for different organizations, based on the use case.
When used effectively, data dashboards enable you to make smart, data-driven business decisions quickly. The tool gets its name from automobile dashboards, which relay critical, high-level information about the car’s underlying system. Early business dashboards employed spreadsheets and databases to perform relatively low-level data analysis, and they eventually evolved into the complex and much more visually appealing dashboards we know today. A variety of software solutions also make it easy to build and customize a data dashboard, and integrate it with your existing systems (we’ll take a look at dashboard software later on).
Data dashboards fall under four main classifications:
-
Informational: The most straightforward type, informational dashboards exist to surface objective, unbiased information about your project or business.
-
Strategic: Strategic dashboards are meant to help managers discover opportunities, create forecasts, drive strategy, and focus on high-level performance data. They are typically static dashboards that are updated periodically (weekly, monthly, etc.) as the organization prepares to review and plan for the next block of time.
-
Analytical: These detailed dashboards allow you to drill down into the data. Analytical dashboards typically include background information, context, and data analysis.
-
Operational: Operational dashboards are designed to give you insight into processes and other underlying functions of your business. They often surface live (or real-time) data and provide continuous, up-to-the-minute information.
What a Data Dashboard Is Not
You may better understand data dashboards by contrasting them with other tools. A data dashboard is not the following:
-
Data Visualization: Simply put, a data visualization is an optical representation of data, and it can take many forms (graphs, charts, models, infographic, etc.). By contrast, a dashboard is a collection of metrics that gives a comprehensive, high-level overview of the state of a business, a project, or an initiative. You may include data visualizations in your dashboard, but the two are distinct.
-
Balanced Scorecard: The utility of a dashboard is similar to that of a balanced scorecard, which is a structured report in which you assess four organizational perspectives: financial, customer, internal business processes, and learning and growth. A balanced scorecard and a dashboard use many of the same performance metrics, and both can help you make management decisions (whether strategic or tactical). However, the balanced scorecard is a systematic way to evaluate your business in order to make decisions, whereas a dashboard merely surfaces data to better help you understand the status and effectiveness of your initiatives.
For examples and templates of a balanced scorecard, read this article.
What Is the Purpose of a Dashboard?
The purpose of a dashboard is to answer questions about your business by providing visibility into KPIs and other performance metrics or relevant data. A dashboard surfaces information that can not only provides useful insight into the status of a project or an initiative, but can also inform business decisions and drive strategy.
Top Five Benefits of a Dashboard
When designed and used effectively, a data dashboard offers the following benefits:
-
Real-Time Updates: The most effective dashboards will integrate with your existing databases to surface data in real time. By feeding live data into your database, you have the ability to make intelligent, well-informed business decisions at any given moment. These updates are also beneficial in simplifying periodic reporting (whether monthly, quarterly, or annually).
-
Time Savings: Dashboards allow you to efficiently track multiple data sources at once. Because you don’t have to track down or cross-reference data among disparate sources — it’s all in one place — you save time and energy.
-
Increased Visibility/Transparency: Dashboards provide insight into key metrics, so you can identify negative trends or measure inefficiencies. Additionally, most platforms provide a way to draw attention to certain metrics, so you can focus on what matters most to your organization, rather than getting bogged down by too many (potentially irrelevant) numbers.
-
Increased Communication: The real-time nature of dashboards can encourage continual communication among team members who otherwise might not have visibility into their colleagues’ work or progress.
-
Increased Accountability: Ultimately, dashboards can build accountability by making data continually available to all relevant parties. This can help stimulate responsible, on-time work deliveries or honest progress reports, which builds trust among all team members.
Common Dashboard Challenges
With today’s software, building and maintaining dashboards is relatively easy, but you’ll still face some challenges:
-
Misleading Information: If the data on display lacks context or is irrelevant, it can be confusing and even misleading. Include adequate background information so that the data is meaningful.
-
Discrepancies between Expected and Actuals: Be clear about which numbers are projections versus reality. Ensuring that your dashboard updates in real time can help avoid these inconsistencies.
-
Misattributed Causality: In an effort to explain trends, viewers may jump to conclusions or draw unsupported narratives from a dashboard. The way you present information (both spatially and with supporting documentation) can reduce the chance that users misattribute causality among data points.
What Is a Reporting Dashboard?
A reporting dashboard acts as a comprehensive progress report on the status of your projects or business. You can use the information in a reporting dashboard to compile a formal report, which is a static document often given to stakeholders to relay the status, challenges, and projections for an endeavor.
What Is a Business Intelligence (BI) Dashboard?
Business intelligence (BI) is a technology-driven process that harnesses data to drive an enterprise’s strategy and actions. In turn, a business intelligence dashboard is used specifically to inform enterprise decision-making by surfacing KPIs relevant to a business process, a project, or the state of affairs.
BI dashboards are enterprise-level tools meant for executive-level decision makers, so they emphasize at-a-glance performance and outcome data. This is in contrast to dashboards that include background information and deep investigations into specific data trends, which are more appropriate if you intend to use your dashboard to build a detailed report.
Common Dashboard Use Cases and Free Templates
You can create a dashboard for any type of business or personal need. In the following sections, we’ll explain the most common types of dashboards and provide free, downloadable Excel templates to help you get started. You can find additional dashboard templates for various use cases in this roundup.
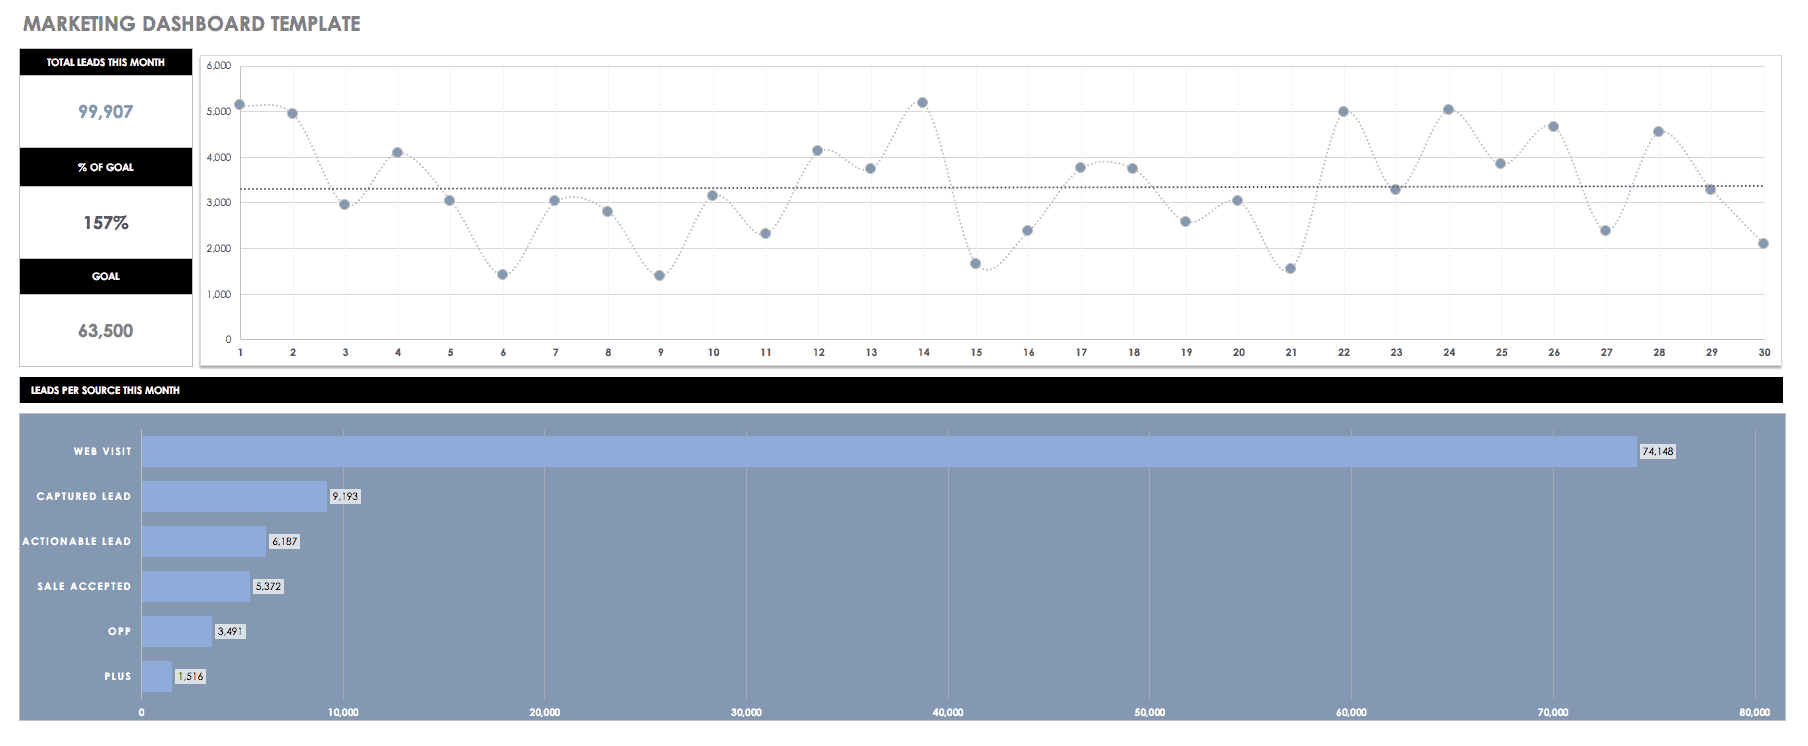
Marketing Dashboard Template
A marketing dashboard highlights marketing analytics and KPIs to provide a status update on your marketing efforts and help identify new opportunities or challenges. This marketing dashboard template for Excel provides space to include high-level marketing data and simple data visualizations to assist in your reporting.
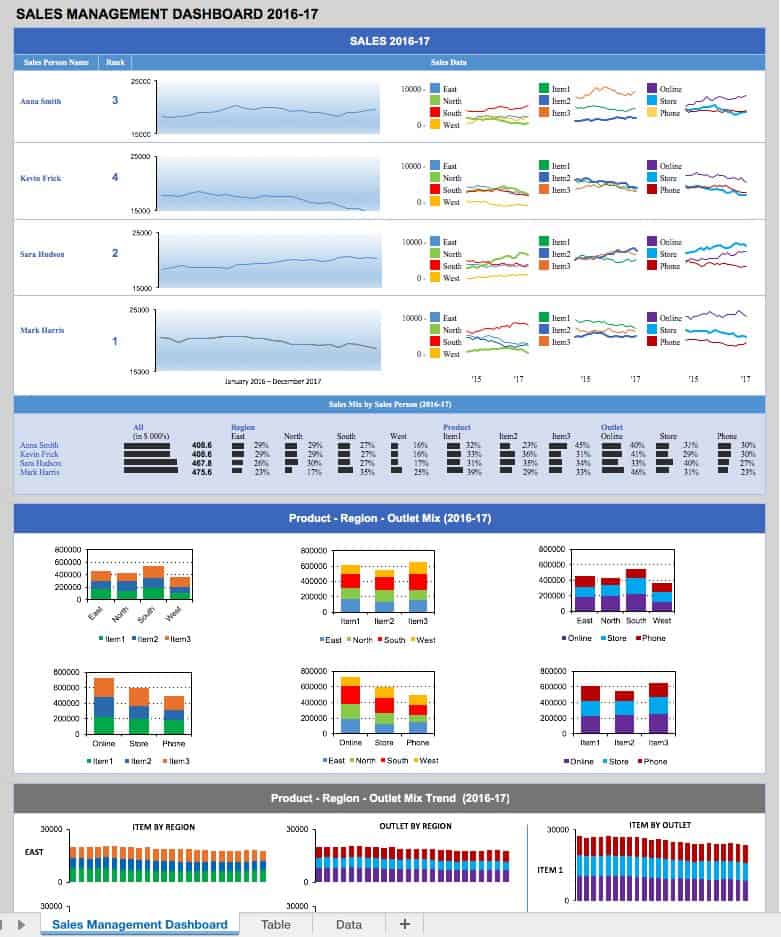
Sales Dashboard Template
A sales dashboard surfaces data about your sales efforts so that you can monitor progress, identify roadblocks, and make a plan of action to meet sales goals. You can use this sales management dashboard template to track status by salesperson, product, or region, and customize it to fit your needs.
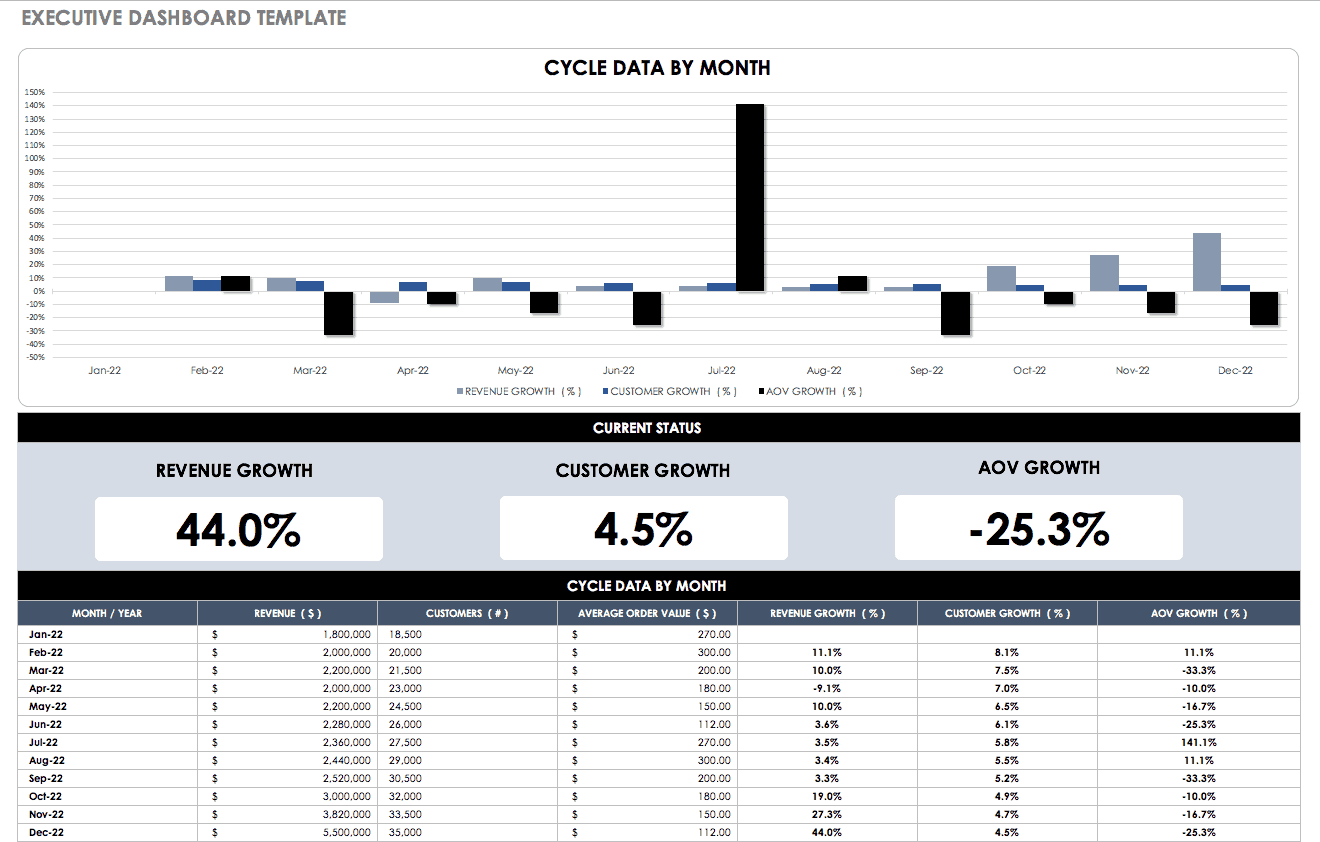
Executive/Management Dashboard Template
An executive or management dashboard should include high-level metrics of any business. This template is ideal for displaying big-picture information about an entire enterprise. Choose your metrics based on the type of insight you need and decisions you have to make, and view it all in one easy-to-read, graphical report. It’s perfect for executive- or management-level stakeholders.
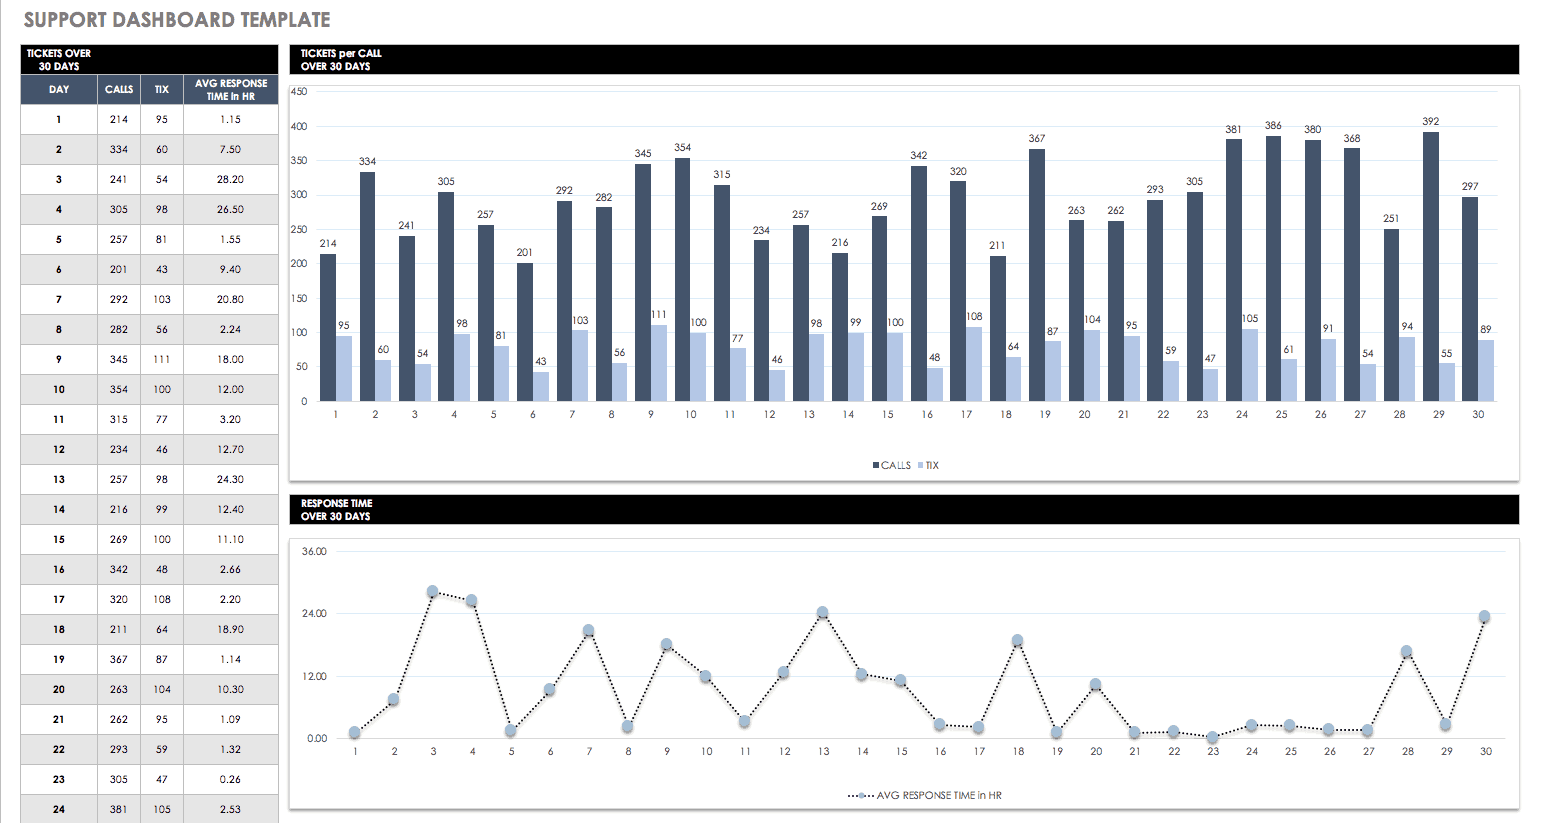
Information Technology Dashboard Template
With an IT dashboard, you can log helpdesk tickets and response time, as well as offer insight into the overall effectiveness of your support departments. This template is a comprehensive reporting dashboard that you can use to monitor performance of your IT department over time.
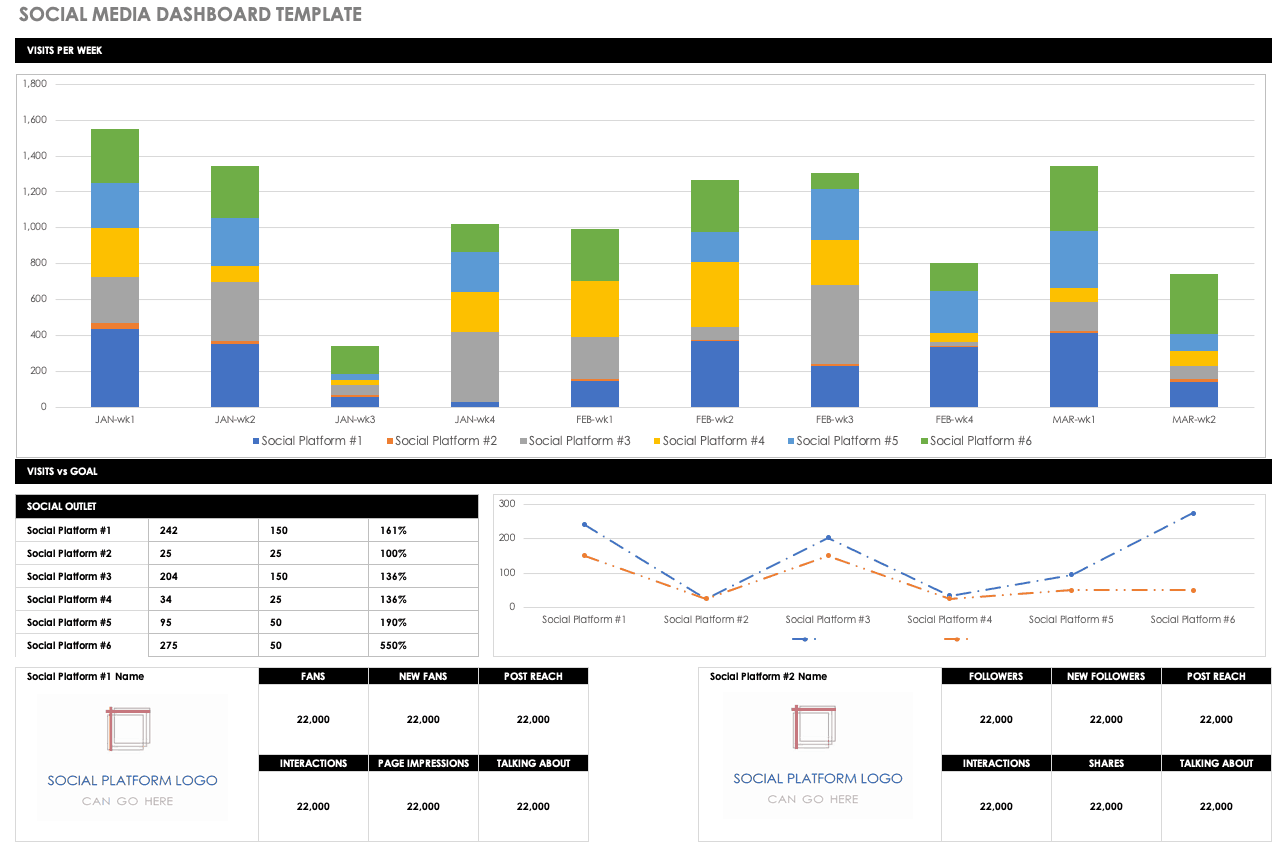
Social Media Dashboard Template
Use this social media dashboard template to track engagement across multiple channels. By visualizing channel performance side by side, you can identify deficient areas in your social media strategy and focus on ideas to increase success.
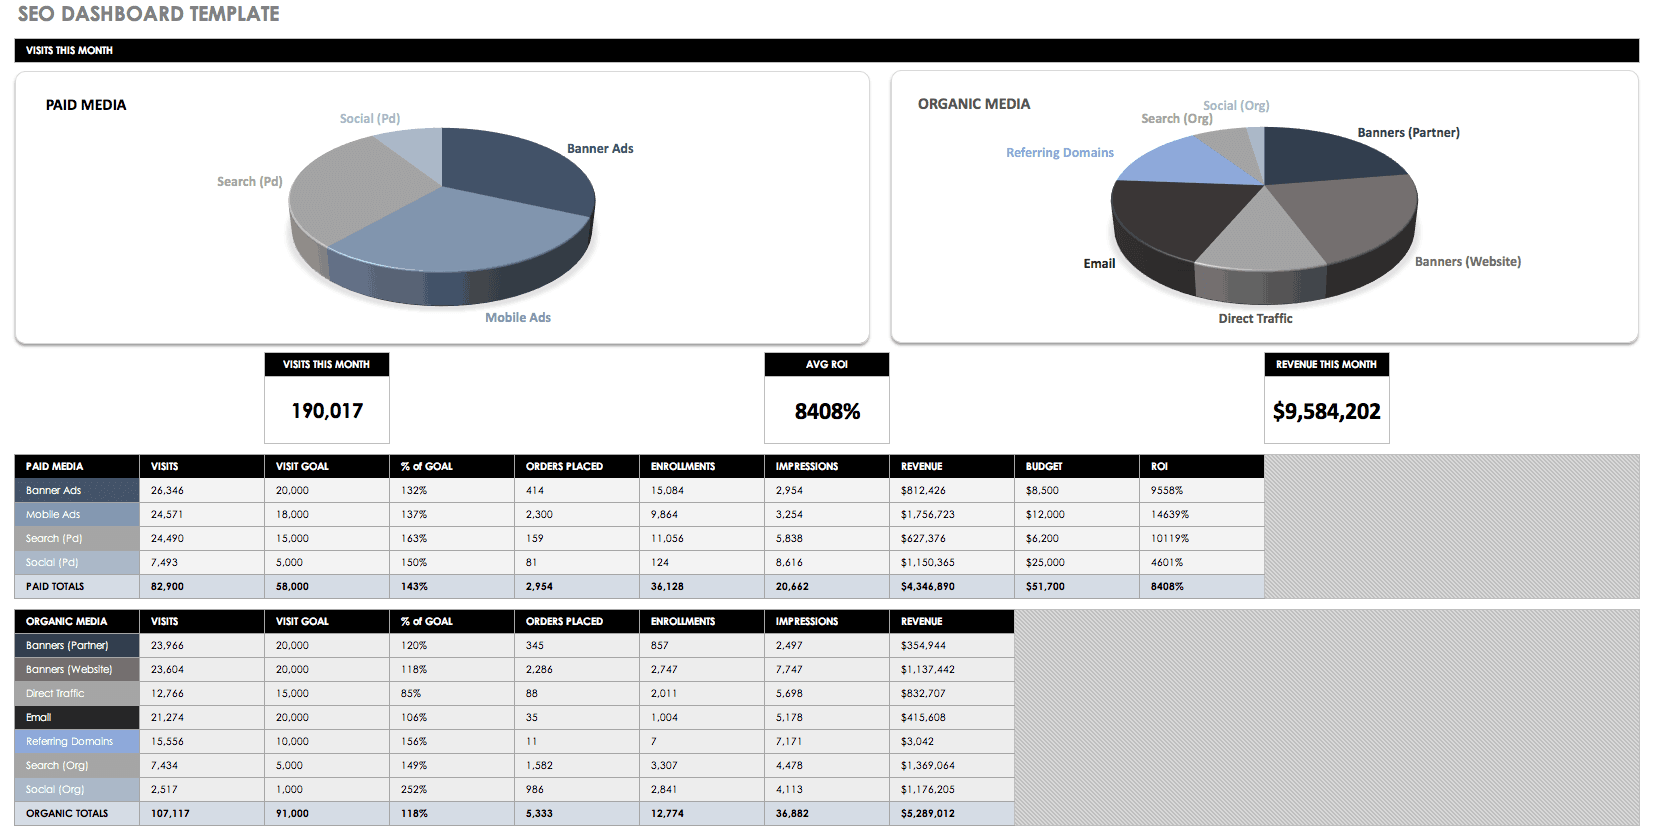
Search Engine Optimization Dashboard Template
Monitor your SEO efforts with this dashboard template, which allows you to track visits (for both paid and organic media), return on investment (ROI), and revenue. Use the charts to surface detailed information about keyword and website performance, and customize the dashboard to fit your needs.
Human Resources Dashboard Template
You can use a human resources dashboard to surface information related to personnel in your organization. This template provides space to list the number of employees by department, salary range breakdowns by role and income, and average salary by department, but you can edit these metrics to fit your needs.
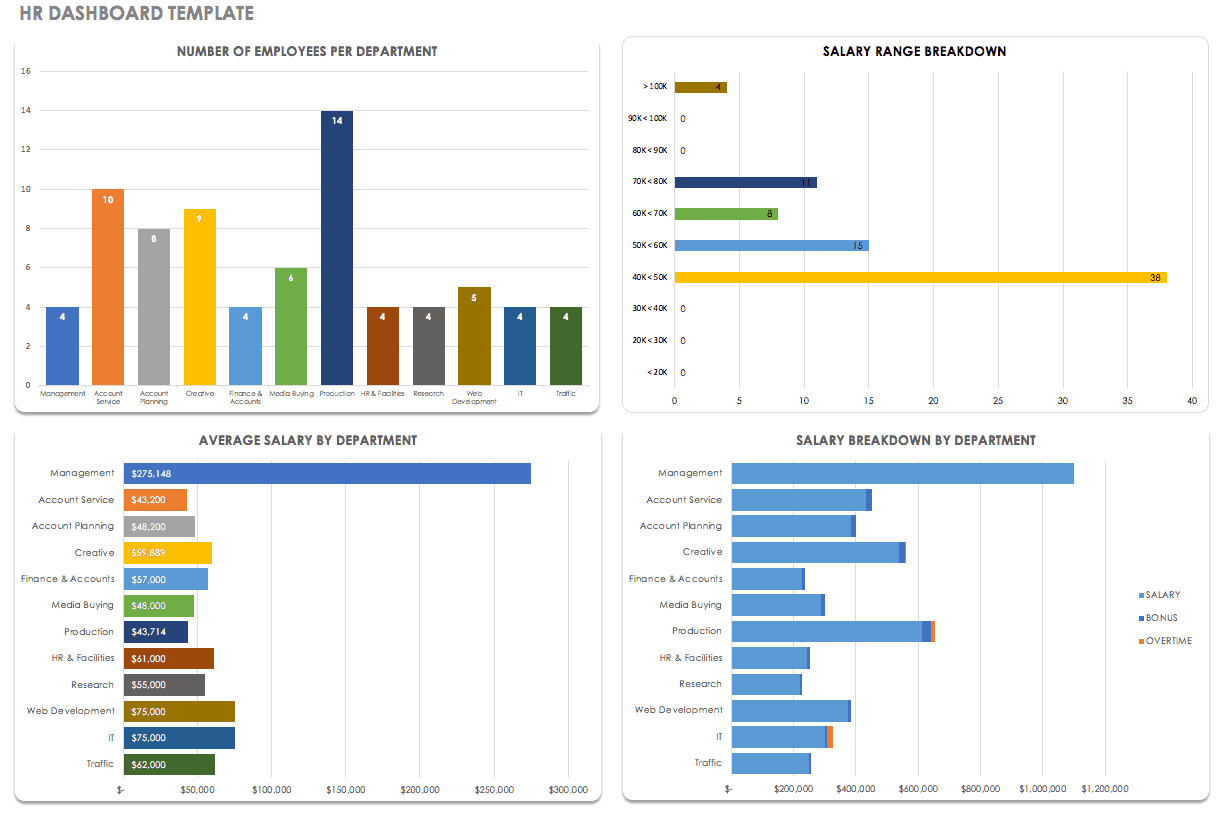
Download HR Dashboard Template
Project Management Dashboard Template
A data dashboard is a handy tool to track progress and make realistic projections about any type of project. Use this template to visualize a timeline, task status, financial data, risk analysis, and any other relevant information. The metrics you choose to include will depend on your audience (internal/team members, external stakeholders, or management/executives).
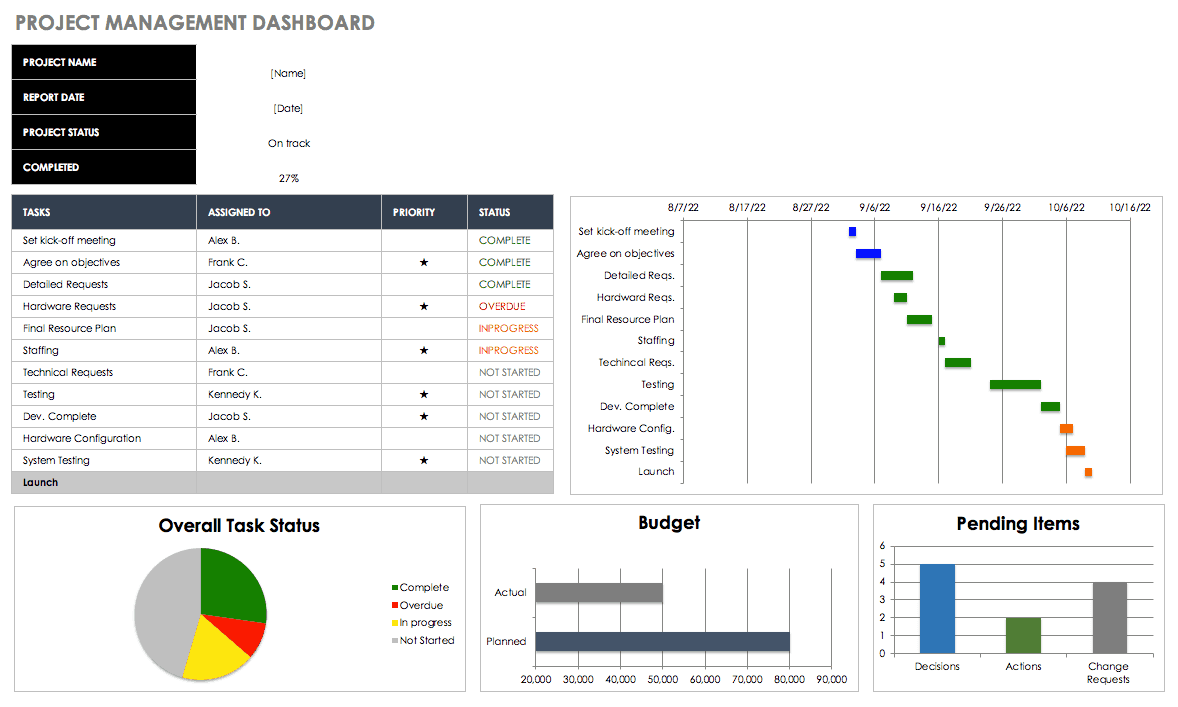
Download Project Management Dashboard Template
In addition to the use cases described above, dashboards are commonly created for customer relationship management (CRM), website analysis, security, and recruiting purposes. There are even examples of public dashboards deployed to stimulate government transparency.
How to Create an Effective Data Dashboard
The specific steps for creating your dashboard will differ based on the program you use, but some general guidelines apply. Follow the four steps below to guide your design when constructing a data dashboard.
Step One: Identify the Questions You Want to Answer
The core purpose of a data dashboard is to answer questions about your business, so the first step when building a dashboard is to isolate those questions. This will serve as the framework for your dashboard. Everything else (metrics, design, underlying databases) in the dashboard will follow. Don’t overload yourself with questions — a dashboard that answers a single question fully and definitively is better than a dashboard that attempts to answer several questions, but does so inaccurately or incompletely.
Step Two: Identify the Right KPIs to Track
Once you have identified the questions that will drive your dashboard, you can zero in on the data needed to answer them. Choosing the right KPIs is critical; too many can overwhelm viewers, too few won’t be adequate, and irrelevant or vague metrics will be confusing. Use the questions you chose in step one to drive the KPIs you include on your dashboard. This will ensure that the data is relevant and to the point, and that the dashboard proves useful overall.
For information on how to identify the right KPIs for your business dashboard, read this guide to defining business dashboard metrics.
Step Three: Create User Pathways
Think about how your users will navigate your dashboard. How do you want them to move through the data? Should they absorb the information in a particular order? Organize the data (including copy, metrics, and visualizations) so that it is easy to understand — don’t make the viewer do extra work to reach conclusions.
Step Four: Link Metrics to Underlying Sheets or Reports
While the dashboard itself is meant to be a high-level overview, you should give users the opportunity to drill down into specifics. One way to do this is to link dashboard widgets to data sources (spreadsheets, reports, etc.) so that users can quickly dive into the original data sets if they want clarification or more details. To do so efficiently, look for a software solution that integrates with your existing database programs.
Top Five Design Tips
If you follow the steps above, you’re well on your way to creating an effective data dashboard. However, design is as important as functionality, so consider the following tips:
-
Communicate important information in a straightforward manner. Dashboards are useful in part because you can gain information at a glance. Don’t overcomplicate your presentation of the data — in fact, you’ll maximize impact if you keep it simple.
-
Avoid clutter. This goes for both visuals and metrics. Keep in mind what questions you want your dashboard to answer, and only include data that will help you reach those conclusions. Anything else is an accessory and takes away from the main point.
-
Visuals are more important than data. Give equal (if not more) attention to how you use space, color, and data visualizations within your dashboard. If you focus on only the numbers, you’ll lose viewers’ attention or potentially make it harder for them them to deduce what’s important.
-
Map out the choices your users will face as they move through your dashboard. This tip goes along with creating user pathways (step four in the previous section). Pay attention to the user experience when designing the dashboard — if your dashboard is difficult to use, people won’t bother.
-
Develop a dashboard evaluation strategy, so you can continually update it. Many dashboard software programs integrate with your existing databases to pull live data. Whether or not this is the case, you should institute a periodic review to keep your database up to date, from both a data and a visualization standpoint.
What to Look for in Dashboard Software
In recent years, dashboard software has replaced static database programs (such as Microsoft Excel) to offer lightweight, real-time platforms on which to build dashboards. Software solutions enable you to track and monitor up-to-the-minute data so that you always have a clear picture of business status. They also grant flexibility through customization, cloud accessibility, and ease of use, among other features.
Below is a list of functionality to consider when choosing dashboard software. For a deeper investigation of the top 15 dashboard software features, read “How to Pick the Best Dashboard Software for Your Company.”
-
Ease of use
-
Connects to APIs
-
Data source integrations
-
Report generation
-
Widgets/interactive data visualizations
-
Search function
-
Document attachments
-
Alerts
-
Gamification
There is no single software program that is objectively best. Rather, focus on your organization’s needs and take the time to find a solution that meets them. Most dashboard software offers a free trial, so try out a few programs before making the investment.
Make Better Decisions, Faster with Smartsheet Dashboards
Empower your people to go above and beyond with a flexible platform designed to match the needs of your team — and adapt as those needs change.
The Smartsheet platform makes it easy to plan, capture, manage, and report on work from anywhere, helping your team be more effective and get more done. Report on key metrics and get real-time visibility into work as it happens with roll-up reports, dashboards, and automated workflows built to keep your team connected and informed.
When teams have clarity into the work getting done, there’s no telling how much more they can accomplish in the same amount of time. Try Smartsheet for free, today.