The Right Balanced Scorecard for You: Examples, Samples, and Templates

By Joe Weller | August 16, 2017

If your organization is looking for more structure - whether it is a startup or an established company - it can only strengthen its position by refining strategy. With so many different management techniques and methodologies, deciding where to start can be overwhelming. However, the balanced scorecard is one management tool that provides a cohesive and focused strategy. And with so many companies worldwide already using the balanced scorecard, there is plenty of expertise available to help you get started.

This guide wraps up our series on the balanced scorecard by explaining what the balanced scorecard is and why you should design one. We offer a brief history of this strategy as well as some examples of companies, both large and small, who utilize it. Next, we jump into the five key steps for developing your own scorecard. Then, we provide you with a useful lists of don’ts. Finally, we offer common metrics, samples of scorecards for different industries, and templates for you to develop your own scorecards.

Strategy Map Template - Excel


Strategy Map Template

Download Strategy Map Template - Excel

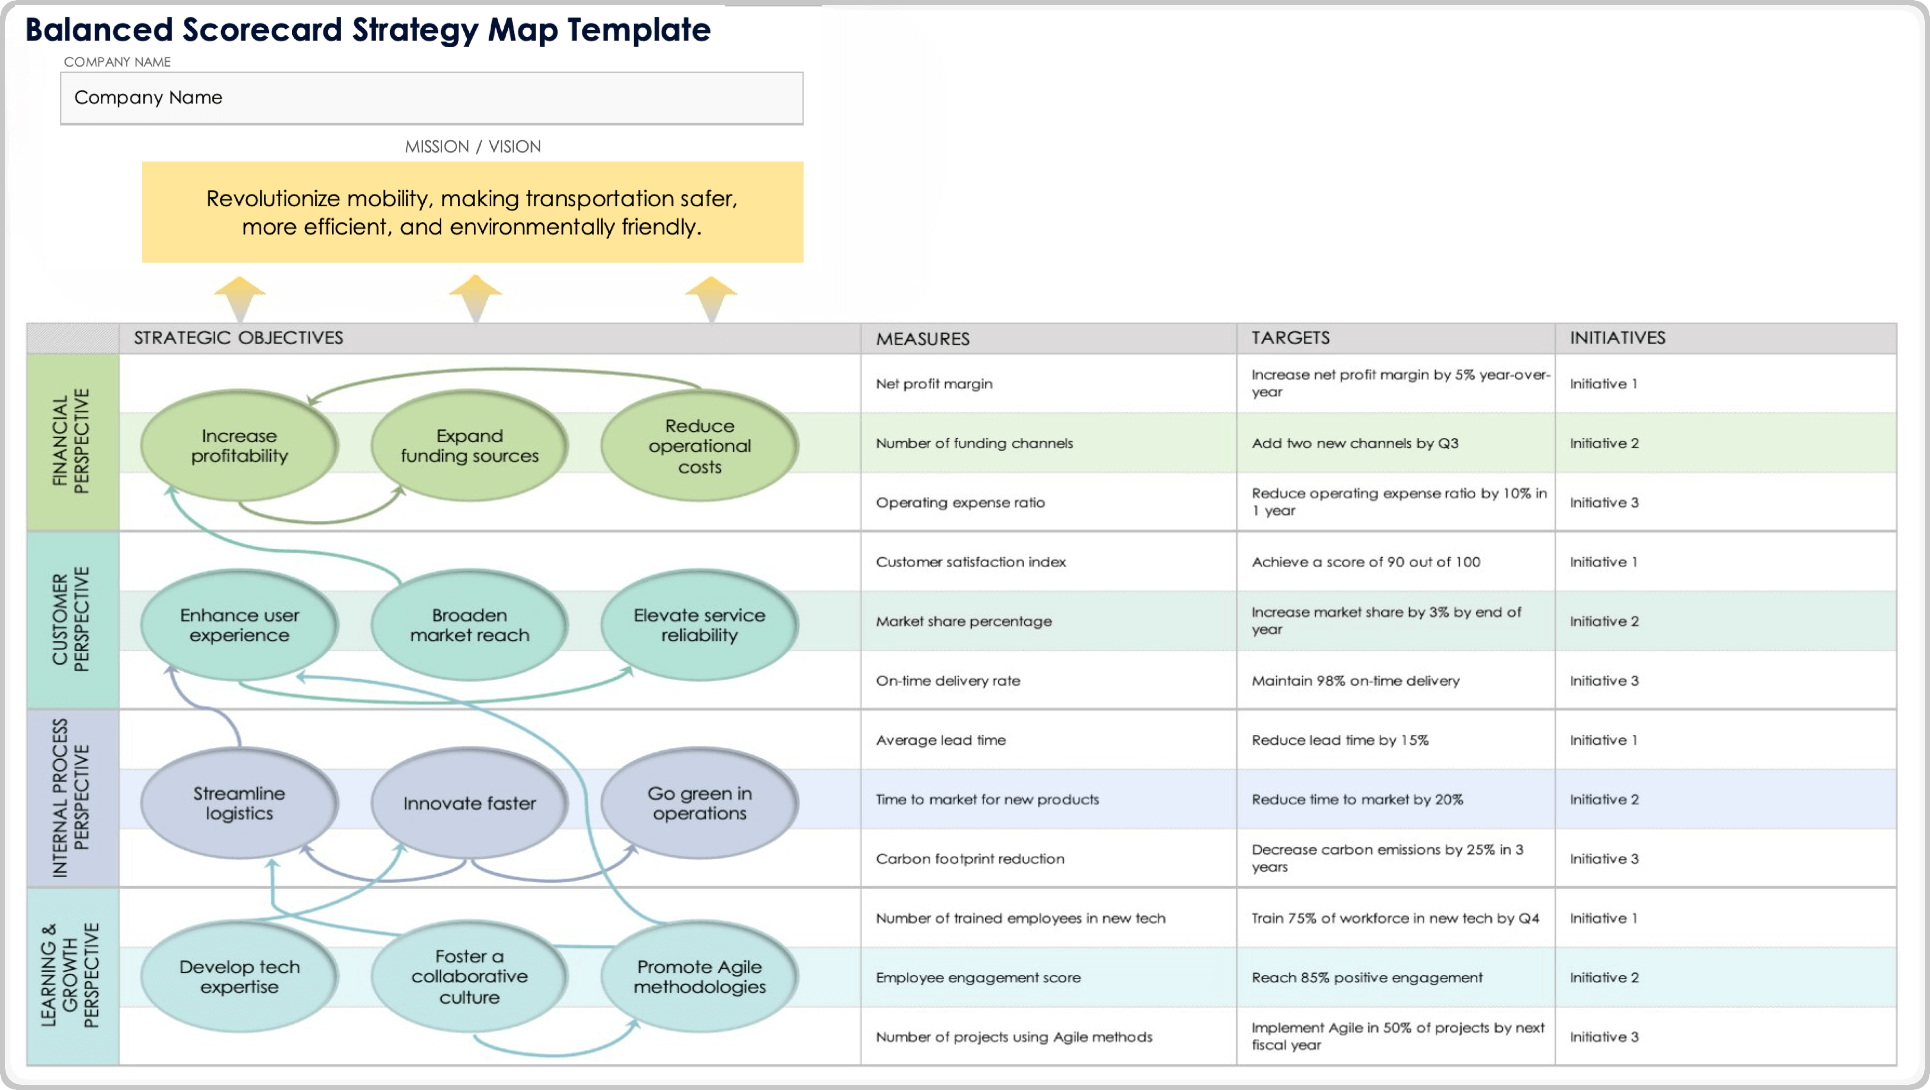
The strategy map is a location where you can lay out all of your objectives and organize them in a cause-and-effect relationship. You can edit the template with different colors, titles, and text to make it unique to your business.

See how Smartsheet can help you be more effective

Watch the demo to see how you can more effectively manage your team, projects, and processes with real-time work management in Smartsheet.


Watch a free demo

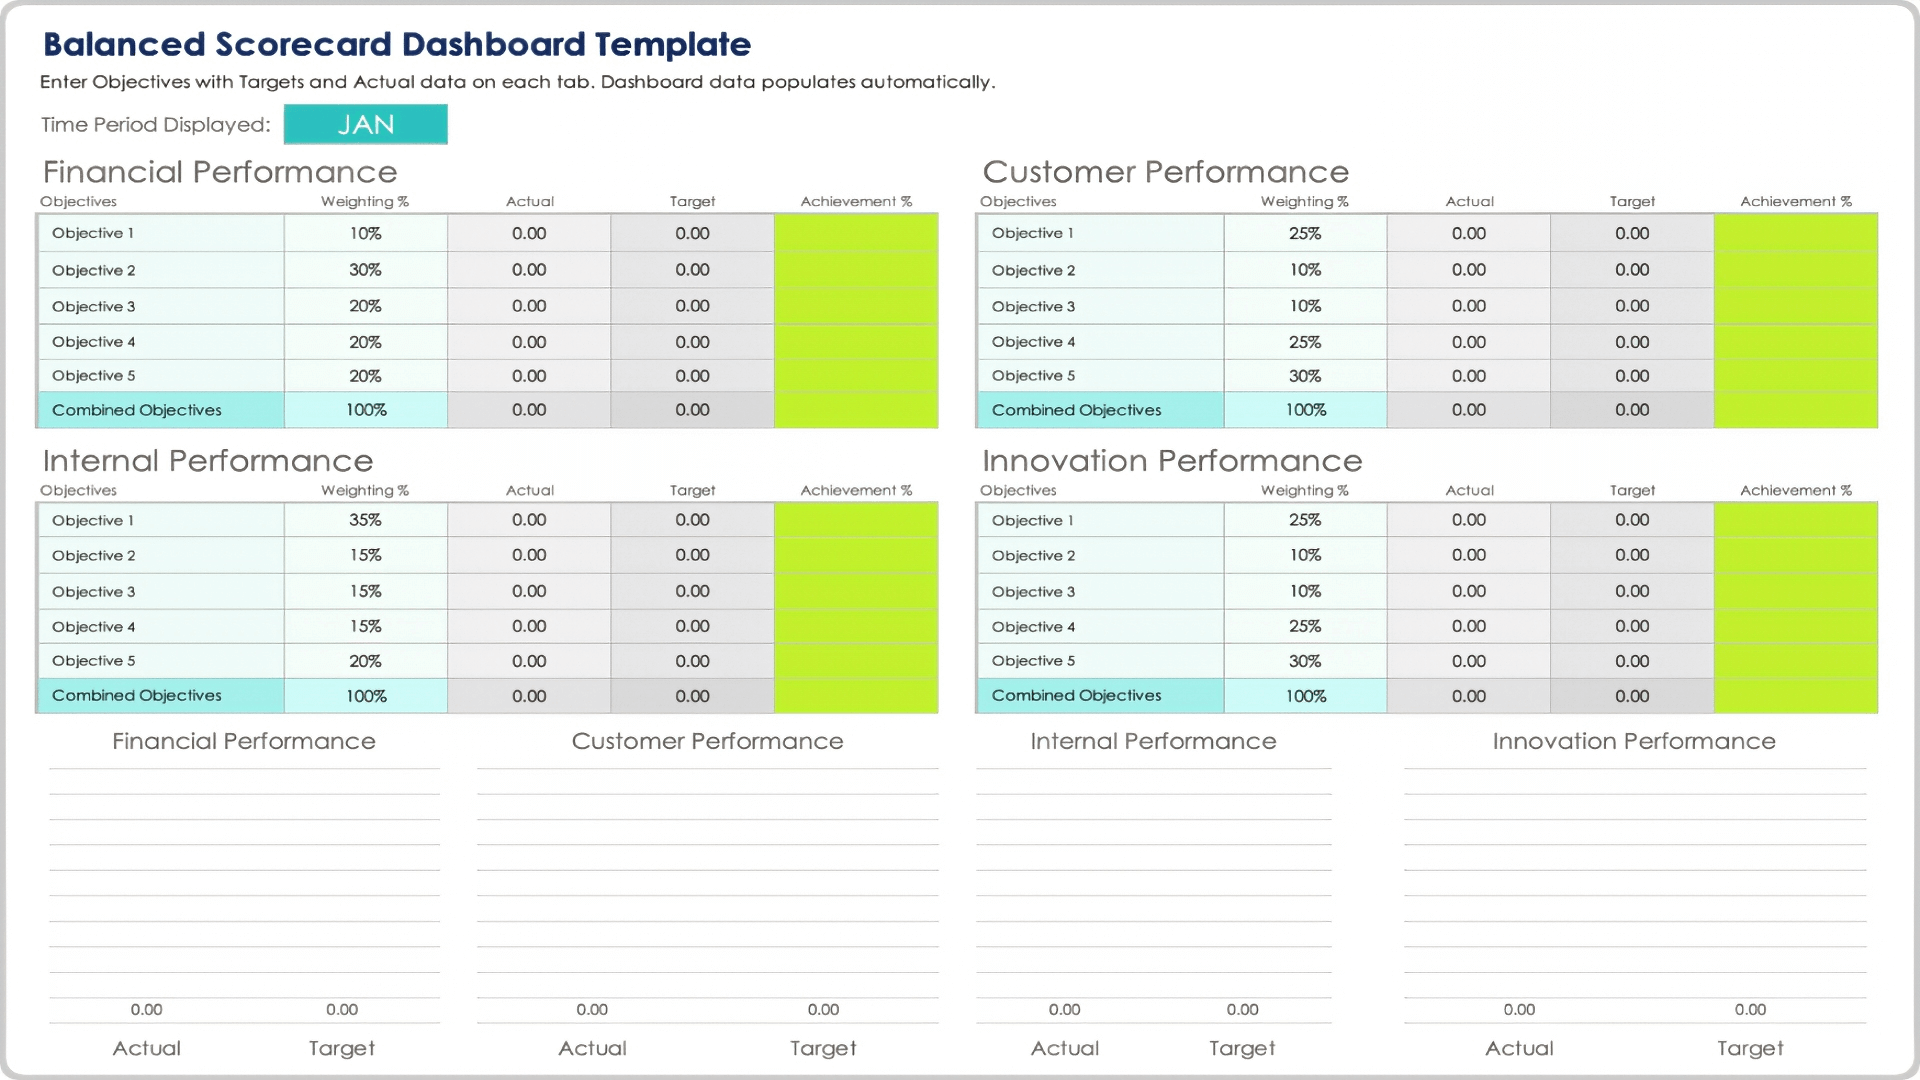
Key Performance Indicators Dashboard Template - Excel


Key Performance Indicators Dashboard Template

Download Key Performance Indicators Dashboard Template - Excel 

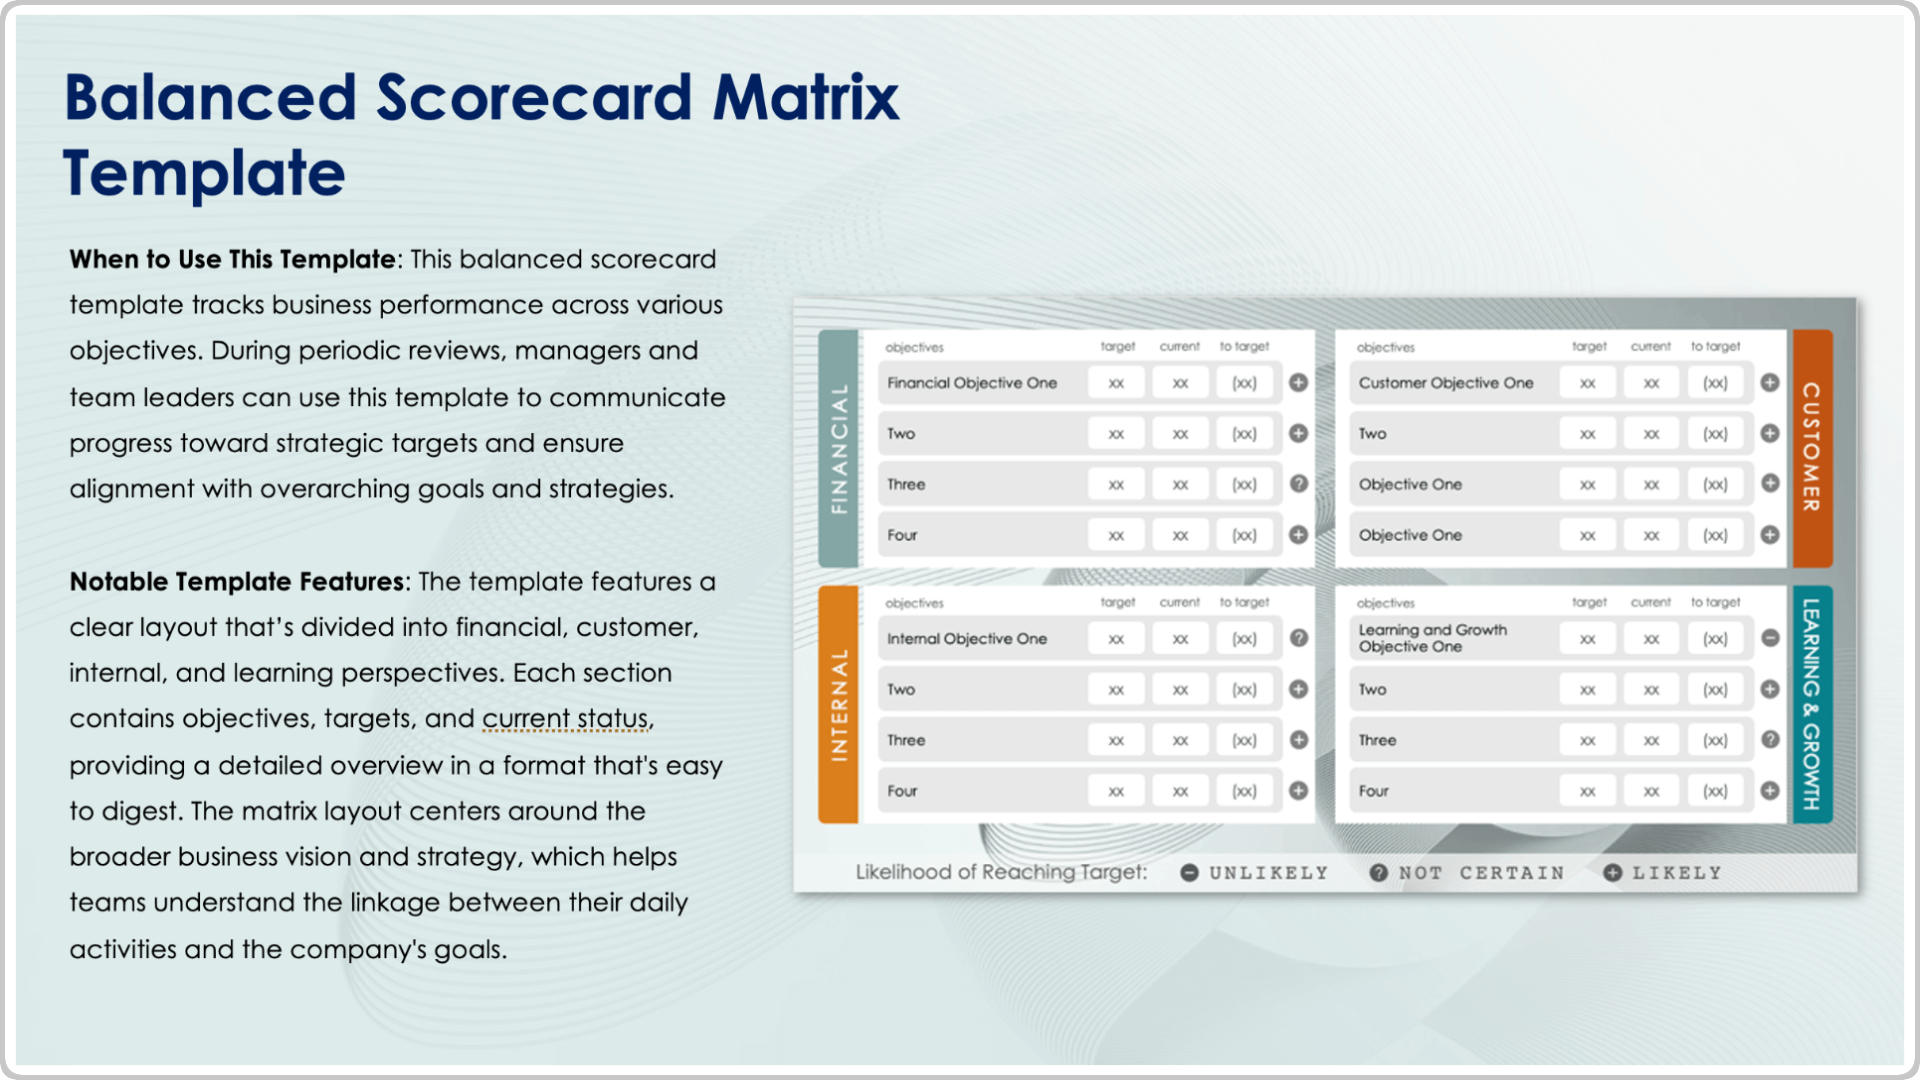
This template gives you a unique document where you can place all of your KPIs.The template comes with all four of the perspectives, but you can edit them to reflect your needs. There is also space for your company logo and space to indicate how important the KPI is as well as how your company is doing regarding that KPI.

The Basic Balanced Scorecard Template - Word


The Basic Balanced Scorecard Template WORD

Download Basic Balanced Scorecard Template

Microsoft Word | Smartsheet

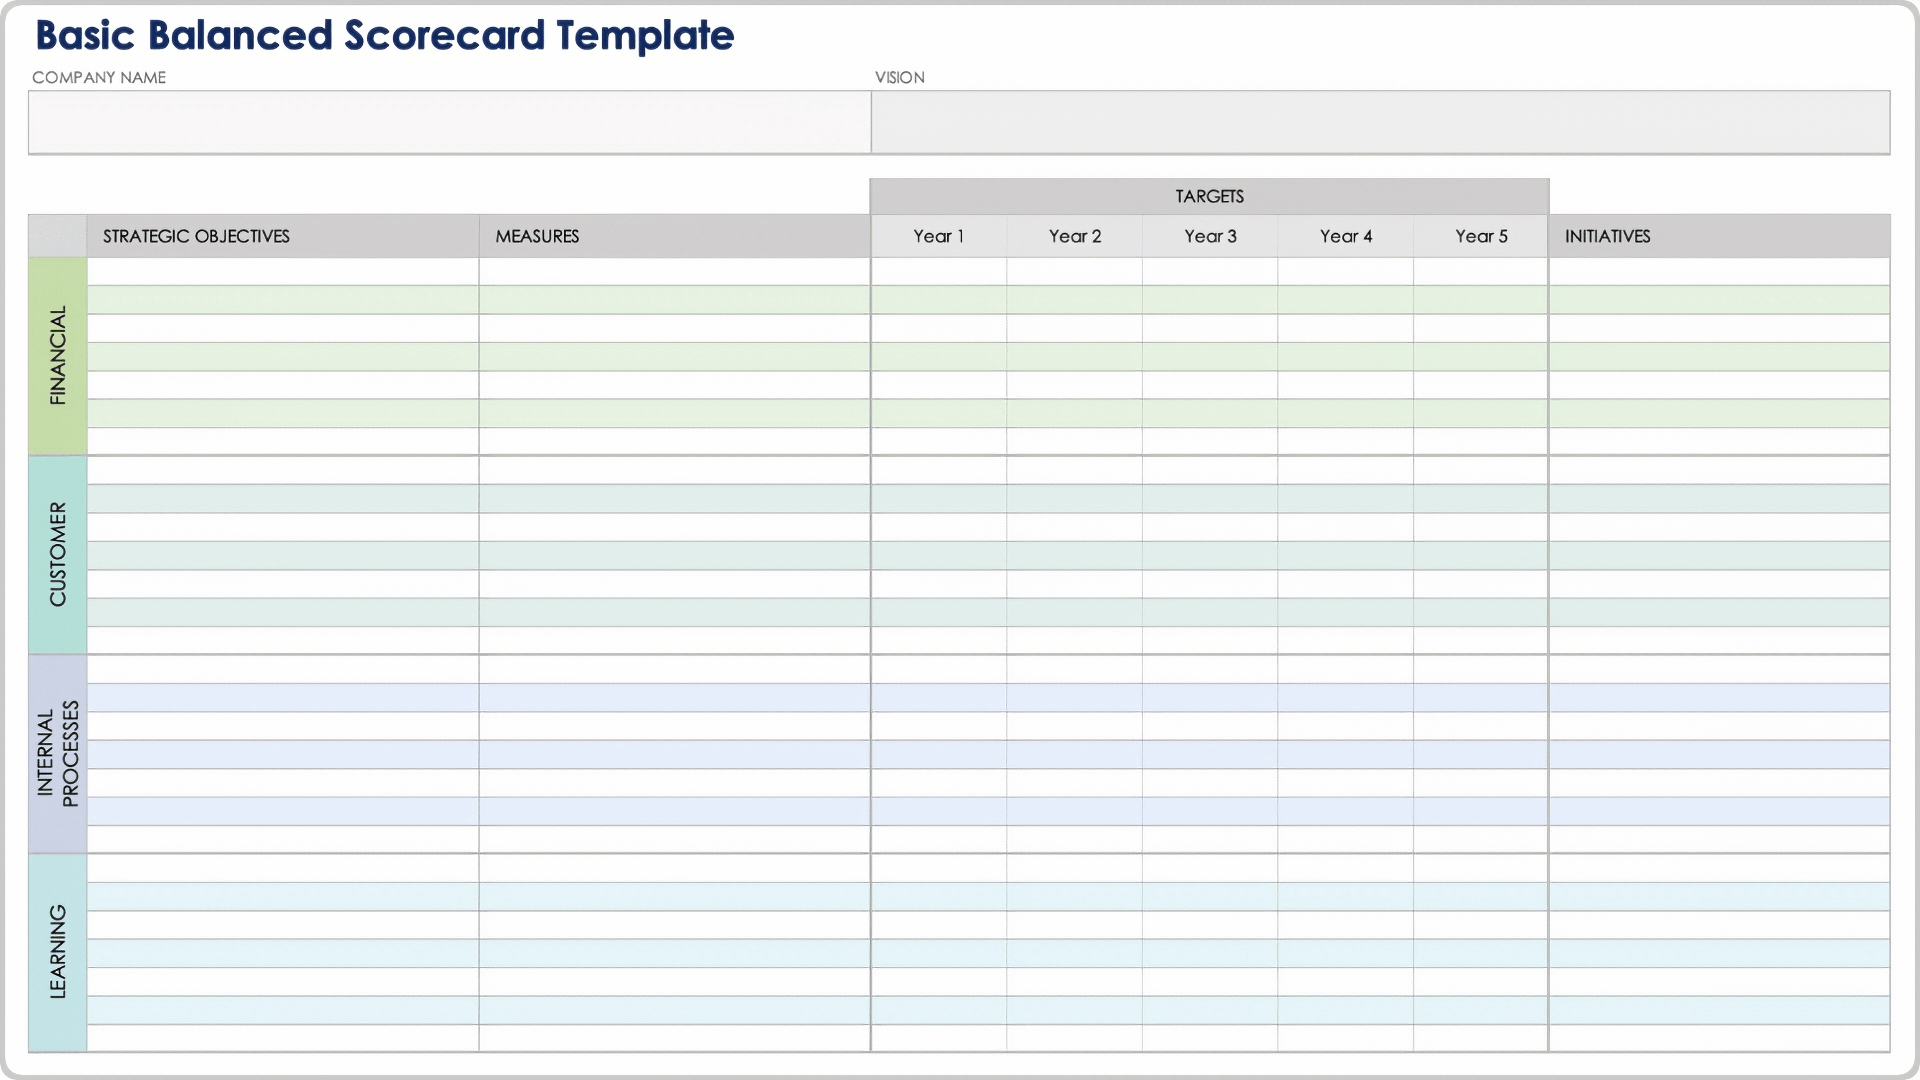
This template is suitable for businesses that need a basic template to get started with the balanced scorecard concept. You can modify fonts and colors and add a logo to create your custom look. There is also room for your budget information.

The Basic Balanced Scorecard Template - Excel


The Basic Balanced Scorecard Template

Download Basic Balanced Scorecard Template

Excel | Smartsheet

This balanced scorecard template offers a professional, easy-to-read layout in Microsoft Excel (you can hover over each cell for instructions). Enter your objectives, KPIs, targets, and initiatives in each of the four perspectives. There is also room to add budget information for your projects.

The Basic Balanced Scorecard Template - PowerPoint


The Basic Balanced Scorecard Template PPT

Download Basic Balanced Scorecard Template

PowerPoint | Smartsheet

This template is suitable for scorecard presentations, which is helpful because many executive-level meetings require presentations in PowerPoint. You can add creative graphics for instructions, logos, and images, and crop, rotate, or use your scorecard as a graphic in itself. The scorecard is fillable, but you can easily turn it into a picture for your presentation needs.

Restaurant Balanced Scorecard Example - Excel


Restaurant Balanced Scorecard Example

Download Restaurant Balanced Scorecard Example - Excel

This is an example of what a restaurant’s balanced scorecard might look like. The scorecard contains all four perspectives, including objectives, KPIs, targets, and initiatives. The scorecard also includes the reporting frequency, along with a budget for the proposed projects.

Different Examples of Balanced Scorecards

Balanced Scorecard Example


Balanced Scorecard Example 2


Download Different Examples of Balanced Scorecards - PowerPoint

What makes the balanced scorecard so successful is its adaptability: you can use it with a wide variety of programs, formats, and templates. Below are two different examples of what your BSC might look like. The first BSC incorporates a strategy map in the left portion, which outlines the main and lower-level objectives. This BSC also lists the objectives as well as the measures, targets, and initiatives in the traditional BSC format, and leaves room for budget calculations. The second BSC is a simple chart that does not incorporate any fancy graphics or cells.

Balanced Scorecard for Healthcare Example - Excel

Balanced Scorecard for Healthcare Example

Download Balanced Scorecard for Healthcare Example - Excel

This is an example of a balanced scorecard for a hospital. Balanced scorecards for public and government organizations start with the organization’s mission and vision and then proceed first through the customer perspective. In this case, the customer perspective is the hospital’s stakeholders. This group may include not only the patients but also the health board, staff, and investors. Starting from the customer perspective will give you the transparency that a public agent requires, and enable you to prioritize responsibly. 

Balanced Scorecard for Information Technology Example

Balanced-Scorecard for Information Technology Example

Download Balanced Scorecard for Information Technology Example

Excel | PDF

This is an example of a balanced scorecard for an information technology department. As you can see, the financial perspective drives this scorecard, which keeps costs in line with the company’s needs. A department like this would not be concerned with external income, but it would have to keep within its allotted company budget and serve the staff accordingly.

What Is the Balanced Scorecard, and What Is Balanced Scorecard Software?

The balanced scorecard (BSC) is a management system and structured report that aligns your company’s strategy with your tactical activities. Developed uniquely for your company, this holistic system enables you to maintain focus and move in a cohesive, consistent direction. The balanced scorecard includes your overarching objectives, measures (key performance indicators or KPIs), targets for your KPIs, and the initiatives that can help you reach those targets. These four elements align with your private or public company’s mission, vision, and values, and you develop each of these four elements in four different perspectives: financial, customer, internal business processes, and learning and growth. These perspectives, taken together, give your scorecard the “balanced” approach. 


Four Perspectives
  • Financial Perspective: This perspective indicates whether your strategy improves your company’s bottom line and how that strategy is implemented and executed. For-profit companies design the financial perspective first, while nonprofit companies design the financial perspective last. 
  • Customer Perspective: This perspective is all about the value proposition that you give to your customers. From this, you can target the market segment that you want to address and maximize your strategies. In nonprofit, design your customer perspective first - it will drive the rest of the scorecard. 
  • Internal Business Processes Perspective: This perspective ensures the stability and sound operation of your business. In this way, you can guarantee that your products and services meet your customer’s expectations. 
  • Learning and Growth Perspective: This perspective consists of training and improvement for your workforce. It ensures that your employees have the skills and development to keep pace and exceed the competition. 

Part of the benefit of having a scorecard is that you will design it yourself. You and your team design and implement the BSC so that it meets your unique business needs. Essentially, you are flushing out your business goals to determine the best and most realistic course to achieve them. You may then cascade those goals down through the structure of your business to maintain alignment. When using this management system, you should also perform a strategic mapping of your objectives. A strategy map gives your objectives cause-and-effect directionality. For more information on the balanced scorecard concept, see this BSC 101 guide

You use BSC software to manage your documents and updates. You can work with templates, pre-implemented performance management software modules, or standalone BSC tracking and development programs. Ideally, you should choose a software system that you can update easily and regularly and that your BSC users have access to. For more information on BSC software, see this BSC software guide.

Why Design a Balanced Scorecard?

All companies begin with a vision. Whether that vision is captured informally or formally, in order to get the company off the ground, you must design a strategy. Once the strategy is designed, you may think planning is complete and, therefore, dive directly into running your business. However, what’s missing from this scenario is a framework for achieving that strategic plan — something that takes your high-level objectives and turns them into a reality that does not overlook any stakeholders. This is what the balanced scorecard does. Further, it is an exercise in getting everyone in your company on the exact same page. Other benefits of the balanced scorecard include:

  • Getting the full picture of your organization’s health 
  • Acquiring feedback to continuously improve your processes
  • Tracking the right metrics over time
  • Enabling you to cascade your strategy down through your entire company

Five Steps to Develop a Balanced Scorecard

The development of your company’s BSC does not happen magically or in a vacuum. For all four perspectives, you should follow a series of loose steps. Also, consider using a template to ask your initial questions. Using a template will help center your group’s thinking and get you to ask the right questions of the right people. Here are the five steps to develop a BSC:

  • Develop Your Company Vision: Vision statements provide clarification for the future of your company, and should be inspirational. For example, IKEA’s vision is “to create a better everyday life for the many people.” 
  • Determine Your Strategic Objectives: These are the goals most important to your business’ current and future wellness. Many professionals use a strengths, weaknesses, opportunities, and threats (SWOT) analysis to determine these priorities. 
  • Analyze What Factors Will Bring Success: These are the critical success factors (CSF) for your company or the critical areas in which high performance is crucial for the success of your company. 
  • Choose Your Key Performance Indicators (KPIs): These are the indicators that align performance with strategic objectives. They should be defined in simple, concrete language that makes your strategic objectives accessible, and should also be linked to your budget. With enough time and honing, these measures will become obvious.
  • Set Your Targets, Plans, and Initiatives: These are the areas of your BSC where your follow-up occurs. Your targets should take into account your KPIs’ baseline and aims.

The steps above will yield your overarching company BSC. Once you have completed this highest level, however, you need to cascade it down through all of your business units. Do this by having each unit develop their own BSC based on the high-level one. Then, link the BSCs together in your software. 

Also, remember that these documents are not static. You must update them regularly. If you build your BSCs so that users are comfortable using them, they will make changes as they address the lower-level elements, such as the month-to-month or quarter-to-quarter measures and targets. Moreover, you should schedule a periodic review of your BSC to determine how it relates to your organizational processes. For example, if you update your budget annually, it is appropriate to conduct an annual review of your BSC that addresses your budgeting processes. Finally, once you’ve completed your BSC, be sure to perform a formal review session about 18 months later to determine if your design is appropriate. By that point, you should have had enough meetings and updates to make clear what changes are necessary. Although many organizations use a five-year strategic plan, you’ll want to update your BSC more frequently to remain current and flexible as variables change. 

A Brief History of the Balanced Scorecard

In 1992, Dr. Robert Kaplan and Dr. David Norton introduced the balanced scorecard concept in an article in the Harvard Business Review. The authors discussed measuring performance across more perspectives than merely the financial one and presented a solution that includes human issues. In succeeding generations of the BSC, organizational theorists removed the strategy’s early flaws and added a strategy map. In addition, they expanded the concept to include government and nonprofits. Kaplan and Norton published several books and papers, most notably their first book The Balanced Scorecard: Translating Strategy into Action. Over the years, other theorists have expanded on the BSC a bit, but the design that professionals use today remains essentially the same as the third generation developed in the late 1990s. By 2004, almost 60 percent of businesses worldwide had implemented the BSC. Kaplan and Norton continue to write and publish materials on the BSC, mostly about its uses. 

As of a 2014 survey, the BSC still ranks as one of the top 10 management tools used globally. Interestingly, commercial examples of current, actual BSCs are difficult to find. This is mainly due to the fact that most of the information that appears on the BSC is proprietary, detailing strategies of competitive organizations. However, while many available case studies do not reveal the contents of competing organization’s scorecards, they do detail the process they used to develop the BSC. It is markedly easier to find BSCs for nonprofits, as many are required to share with the public how they spend their funds. Balancedscorecard.org also keeps a running list of commercial and nonprofit adopters of the BSC. Some of the companies that use the BSC management system include:

Apple, Inc.
Exxon Mobil Corporation
Ford Motor Company
General Electric Company
Honeywell
IBM
Pfizer Inc.
Thomson Reuters
University of California
University of Denver
National Marrow Donor Program
Wells Fargo Bank

The Balanced Scorecard: What Not to Do

In this guide and in companion articles, we discuss the theory of BSC in depth, and also tell you why and how you should build a BSC. However, there are some practices to avoid when developing and implementing your balanced scorecard. Do not:

  • Do Not Use the Older BSC Generations as Your Model: The older models may give you an option you are looking for, but they do not explain your strategy and do not include the strategy map.
  • Do Not Develop Your Scorecard in a Bubble: Without linking your scorecard to live data, it can run the risk of being out of date. Your scorecard should be a living document that is accessible to all who use it.
  • Do Not Neglect to Show the Relationship between Your Business Goals: You should develop your perspectives from the top down, from the financial to the learning and growth perspectives (in a for-profit scenario). This shows the contributory effect between the goals. 
  • Do Not Focus on Irrelevant KPIs: Your metrics should not only be capable of showing progress, but should also focus on the specific objectives of your BSC (you can apply lower-level KPIs to lower-level BSCs in your business). You should also choose metrics that help you manage a solution, not just report a problem.
  • Do Not Use Templates That Are Not Actually Templates: There are so many diagrams online depicting the BSC. However, many of these merely describe the concept and are not actual templates. Some are old versions of the BSC, and some are simply amended versions that don’t look at all four perspectives. Get a BSC template from a reputable source. The template should contain all four perspectives and all four elements from each perspective. This true scorecard will tell your story.
  • Do Not Use One Format as a One-Size-Fits-All: There are multiple formats available, even among software meant specifically for BSCs. Some modules and templates cater to presentation, and some cater to design and updates. Your company may need multiple versions.
  • Do Not Mistake Metric-Only Dashboards for a Balanced Scorecard: Your measures are a vital part of your BSC, but they’re not the entire BSC. Be sure to seek out options that fulfill all of a balanced scorecard’s requirements. (Some templates even include benchmarking with their KPIs.)
  • Do Not Take a Paint-by-Numbers Approach: The BSC has been so successful since the 1990s precisely because the concept stresses developing your own strategy and elements. Each business should have a unique, constantly evolving BSC.

Examples of Key Performance Indicators

In each field, there are standard KPIs that you can choose from to give you a sense of the health of your company. Although the KPIs for your company should be based on how your specific business operates, there are some that are more prevalent in certain industries. The customer indicators you’ll find below are an example of those that you’d find in any business, while the internal processes indicators are usually highly specialized. (The ones listed below are examples. Most likely, you do not have these in your business but can get an idea of what they would entail.) Finally, the education KPIs you’ll see below are examples that are only relevant in the higher-learning industry. These can tell you where your school stands with respect to academics, finances, curriculum, faculty, facilities, technology, transportation, and housing. Here are the customer indicators:

  • Overall Satisfaction: This is the level of satisfaction as reported by your customers. You can perform surveys of your customers to learn this information.
  • Satisfaction Improvement: This indicator measures the change in customer satisfaction. You should be looking out for improvement or stasis. 
  • Customer Retention: This is the rate of customers who stay with your business over time. 
  • Net Promoter Score: This is the rate of customers who recommend your business to others.
  • Conversion Rate: This is the rate of purchase by customers after they have interaction with your company.
  • Compared to Competitors: This is the rate of customers who choose your company over your competitors.
  • Average Resolution Time: This is how quickly your customer service team resolves issues.
  • Active Issues: These are the issues that you have not resolved. 
  • Resolved Issues: How quickly your customer service team resolves your customers’ issues is an indication of the quality of your customer service operation. 
  • Employee Productivity: This is a measure of your employees’ effectiveness. You can measure job effectiveness in many different ways, but employee productivity is a major factor affecting your customers’ satisfaction.
  • Employee Retention/Employee Turnover: The happier your employees are, the longer they stay with your company. The longer they stay with your company, the more empowered and capable they feel in their positions, so they will provide higher-quality service.
  • Brand Attributes: You need to understand how your customers perceive your company. You should have a unique brand that customers can describe.
  • Complaint Escalation Rate: This rate ties together your number of complaints and resolved issues. You should track complaints that escalate.
  • Cash Flow: Cash flow can indicate how well your business is doing with regard to customer service, referrals, and brand image.
  • External Industry Benchmarks: This should tell you how you stack up against your competition. Even the best companies do not get it right all of the time. Checking external benchmarking survey data is appropriate. Examples of internal processes indicators include:


  • Cost measures for storage
  • Rate of on-time delivery 
  • Order fulfilment time
  • Rates of capacity utilization
  • Yield measurements
  • Percentage of project cost variance
  • Percentage of billable hours 
  • Supplier relationship measures
  • First contact resolved
  • Percentage of process waste 
  • Percentage of rework
  • Cost to serve measures
  • Risk measures
  • Efficiency of information systems
  • Expenses per employee
  • Average decision-making time
  • Supplier frequency
  • Ratio of timely completed orders

The following are examples of education indicators:

  • Graduation Rate: How many students completed schooling or finished their course of study. 
  • Research Grants: This is the percentage of grants received over the amount of grants applied for. 
  • Student Attendance Rate: This is the number of students who have achieved a certain percentage of attendance per semester or year. 
  • Grant Money: This is the amount of money you’ve raised for your institution.
  • Cost per Student: This is the amount of money it takes to educate each student in the school. 
  • Number of Annual Faculty Training Sessions: This KPI indicates how up to date your faculty is with teaching methods and industry standards.
  • Proficiency Rates for Each Subject: This rate tells you how well your curriculum is doing. 

Make Better Business Decisions, Faster with Smartsheet Dashboards

Empower your people to go above and beyond with a flexible platform designed to match the needs of your team — and adapt as those needs change. 

The Smartsheet platform makes it easy to plan, capture, manage, and report on work from anywhere, helping your team be more effective and get more done. Report on key metrics and get real-time visibility into work as it happens with roll-up reports, dashboards, and automated workflows built to keep your team connected and informed. 

When teams have clarity into the work getting done, there’s no telling how much more they can accomplish in the same amount of time. Try Smartsheet for free, today.


Discover why over 90% of Fortune 100 companies trust Smartsheet to get work done.

Try Smartsheet for Free Get a Free Smartsheet Demo