Simple Burndown Chart Template
Download a Simple Burndown Chart Template for
Excel
| Google Sheets
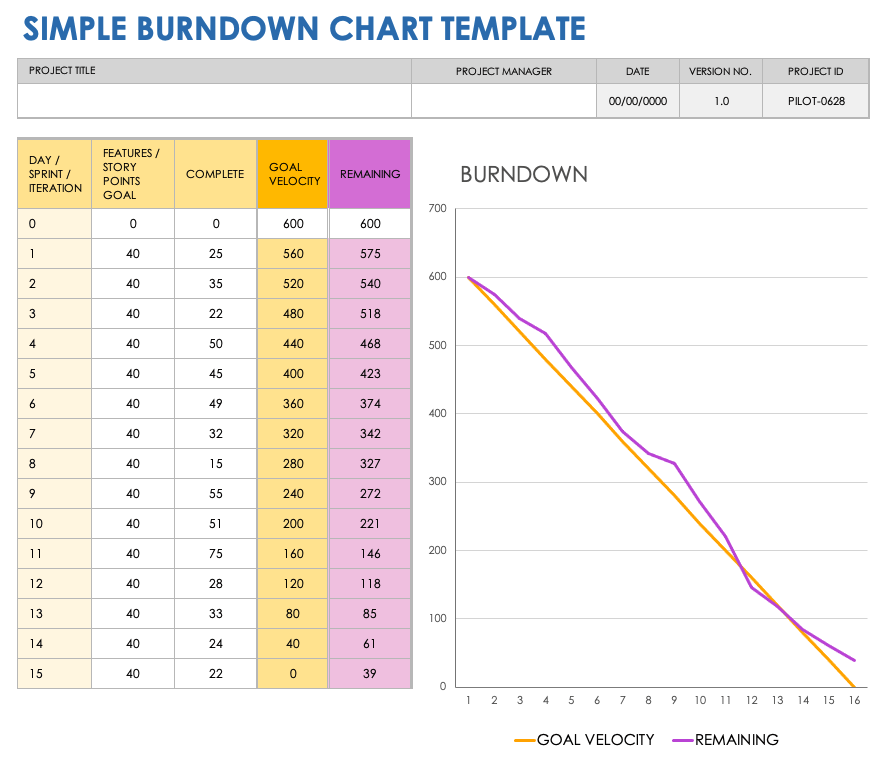
Use this simple burndown chart template to determine the remaining work that you and your team have left to complete within a specific, customizable range of time. Whether you hold daily Scrum meetings or simply want to track your team’s burndown, use this burndown chart to ensure your team is on track. This template is completely customizable and comes with sample numbers of days (usually for an Agile sprint), goal, points completed, goal velocity, and remaining points. Once you input your team’s data, the template will automatically display a burndown chart that provides an illustration of your goal velocity compared to your project or sprint’s remaining work.
To learn more about optimizing Agile for your team’s development projects, read this comprehensive article on using Gantt charts in an Agile environment.
Release Burndown Chart Template
Download a Release Burndown Chart Template for
Excel
| Google Sheets
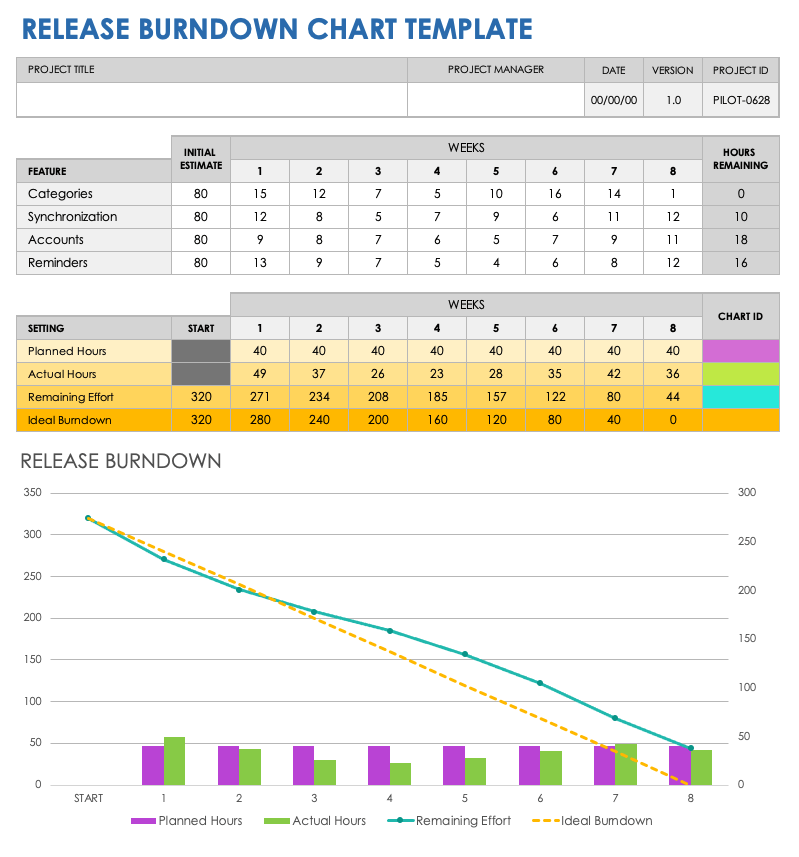
Use this visually dynamic release burndown chart template to clarify the remaining effort needed for your upcoming release. Simply enter the initial estimated points or hours for each feature included in your release, and then track each feature’s progress from week to week (or over any time period that suits your team). This chart will then calculate and display your ideal burndown vs. actual remaining effort, as well as planned vs. actual hours. You can also use this template to accurately predict future release efforts by reviewing the release-effort data from previous releases.
For helpful tips, see our article on successfully using burndown charts.
Project Burndown Chart Template
Download a Project Burndown Chart Template for
Excel
| Google Sheets
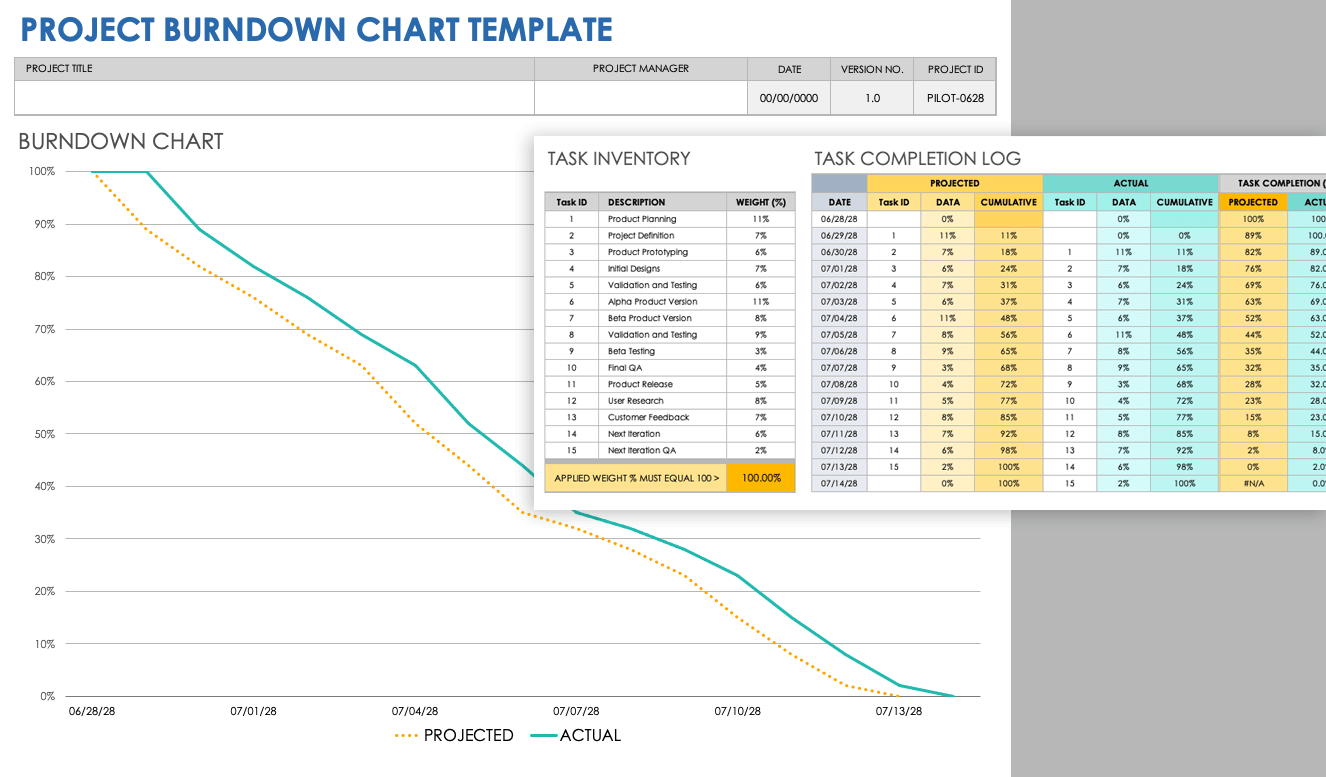
This project burndown chart template divides project tasks into two sections: Task Inventory and Task Completion. In the Task Inventory section, enter a unique task ID, name, and percentage weight (this information will provide the Scrum master or project manager with an idea of the effort each task will take). In the Task Completion section, track each task’s progress toward completion. Then the template’s Burndown Graph compares your team’s progress against your initial projected effort.
Ensure that you’re optimizing your project’s task completion process with our article on how to successfully use burn-up chart templates.
Agile Sprint Burndown Chart Template
Download an Agile Sprint Burndown Chart Template for
Excel
| Google Sheets
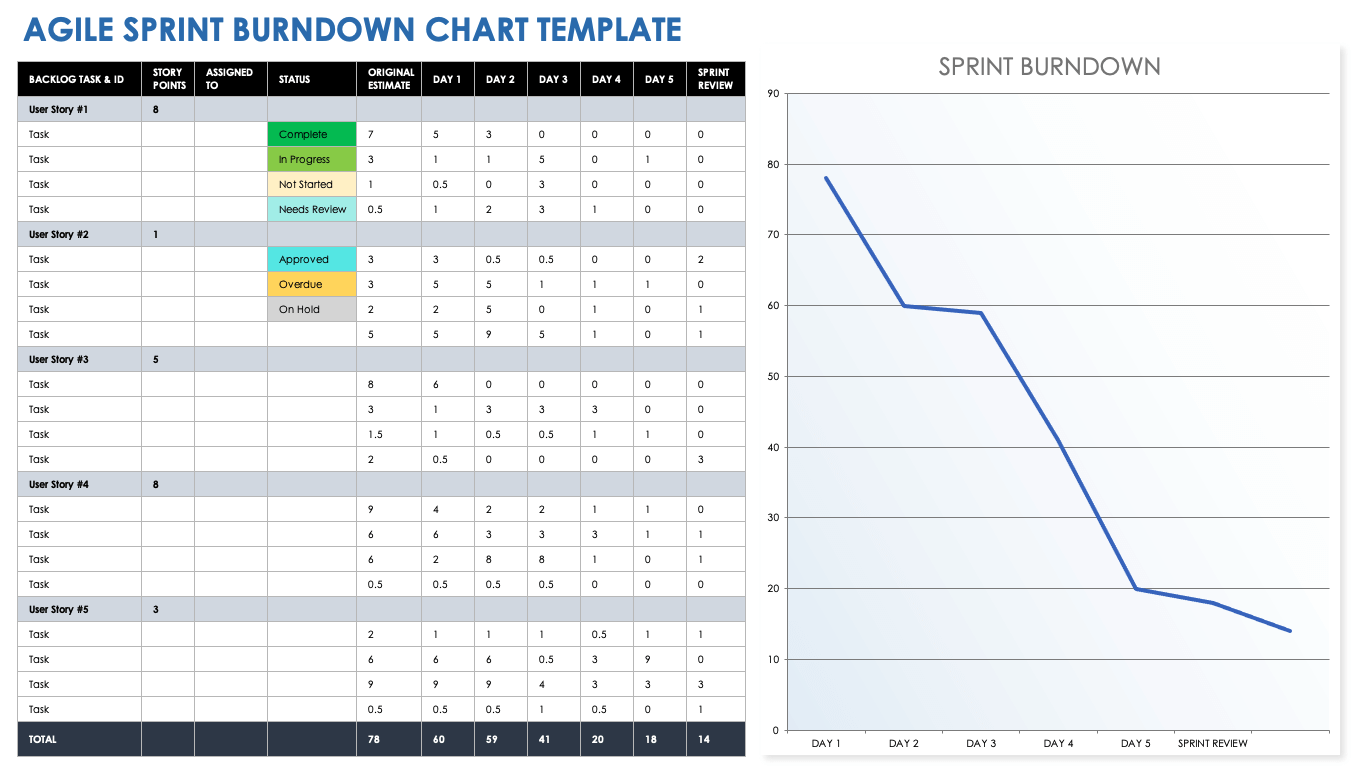
As an Agile team, you need a reliable way to provide team members, project sponsors, and other stakeholders with an estimate of the effort involved in a sprint, as well as what progress has been made toward achieving your goals on schedule. Use this Agile sprint burndown chart template to track your team’s burndown rate, and easily keep stakeholders apprised of the status of each task or feature in your sprint. Enter the number of story points for each task, the assigned team member, the task status, the original points estimate, and the daily progress. The template’s Sprint Burndown chart provides up-to-date progress, whether your Agile sprints occur weekly, bi-weekly, monthly, or another set duration.
Download free Agile project management Excel templates to help ensure your team is on track.
Risk Burndown Chart Template
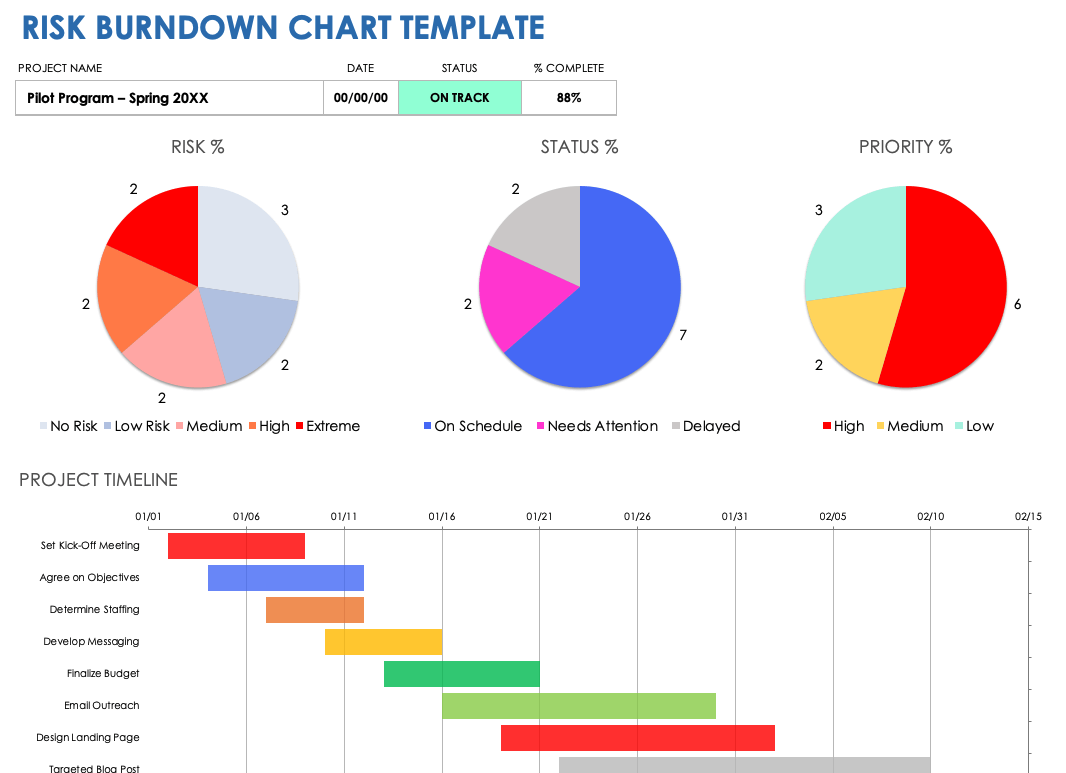
Download a Risk Burndown Chart Template for
Excel
| Google Sheets
Use this all-purpose risk burndown chart template to ensure that you have defined, assigned, and set priorities and statuses to all project risks. Once you list your project tasks and set their status, the color-coded Project Risk Status pie chart will automatically display the portion of tasks that are at high or extreme risk of not being completed. This visually rich template translates perfectly for presentation-friendly updates of project status, Scrum meetings, and Agile sprint reviews.
What Is a Burndown Chart Template?
A burndown chart template is a tool used by Agile development teams, Scrum masters, and other team members to track how close a sprint’s tasks are to completion. Use a burndown chart template to compare task-completion velocity with remaining work.
A burndown chart template provides a framework for project managers and Scrum masters to ensure that a sprint’s features and tasks are completed on schedule. By using a burndown chart, you can easily compare your sprint goals (your ideal burndown rate) to the work that remains to be done by the end of the sprint. You can also use an easy-to-read, visually dynamic burndown chart as a predictive tool for future sprints by reviewing each sprint’s accomplishments as an indicator of the team’s bandwidth for future sprints.
While the specific features in a burndown chart vary, most include the following components:
- Task: Enter the names for each task that you will track in this sprint.
- Feature: Enter each feature in the sprint, and group individual component tasks beneath their respective feature.
- Initial Estimate: List the effort (in hours or points) for each task in your project’s sprint.
- Planned Hours: Enter the number of hours you estimate each task in the sprint will take to complete.
- Duration: Enter the due date for each task (usually by the end of the sprint). Most burndown charts will automatically calculate and display the duration of time based on the start and end dates.
- Actual Hours: Once the task is completed, enter the number of hours each task took to complete.
- Remaining Effort: For each task, note the remaining effort (in either hours or points), so that it’s clear how close each task is to completion.
- Ideal Burndown: Enter the ideal burndown rate that you expect your team to match or exceed in the sprint.
Additionally, some burndown chart templates may include the following burndown-related components.
- Task ID: Provide the unique identifier for the task.
- Weight: Enter the weight for each Agile task, which helps determine the priority each will take and the effort involved.
- Assigned To: Provide the name of the team member responsible for each task in the sprint.
- Status: List the status of each task.
Get the Most Out of Burndown Charts with Smartsheet for Project Management
From simple task management and project planning to complex resource and portfolio management, Smartsheet helps you improve collaboration and increase work velocity -- empowering you to get more done.
The Smartsheet platform makes it easy to plan, capture, manage, and report on work from anywhere, helping your team be more effective and get more done. Report on key metrics and get real-time visibility into work as it happens with roll-up reports, dashboards, and automated workflows built to keep your team connected and informed.
When teams have clarity into the work getting done, there’s no telling how much more they can accomplish in the same amount of time. Try Smartsheet for free, today.