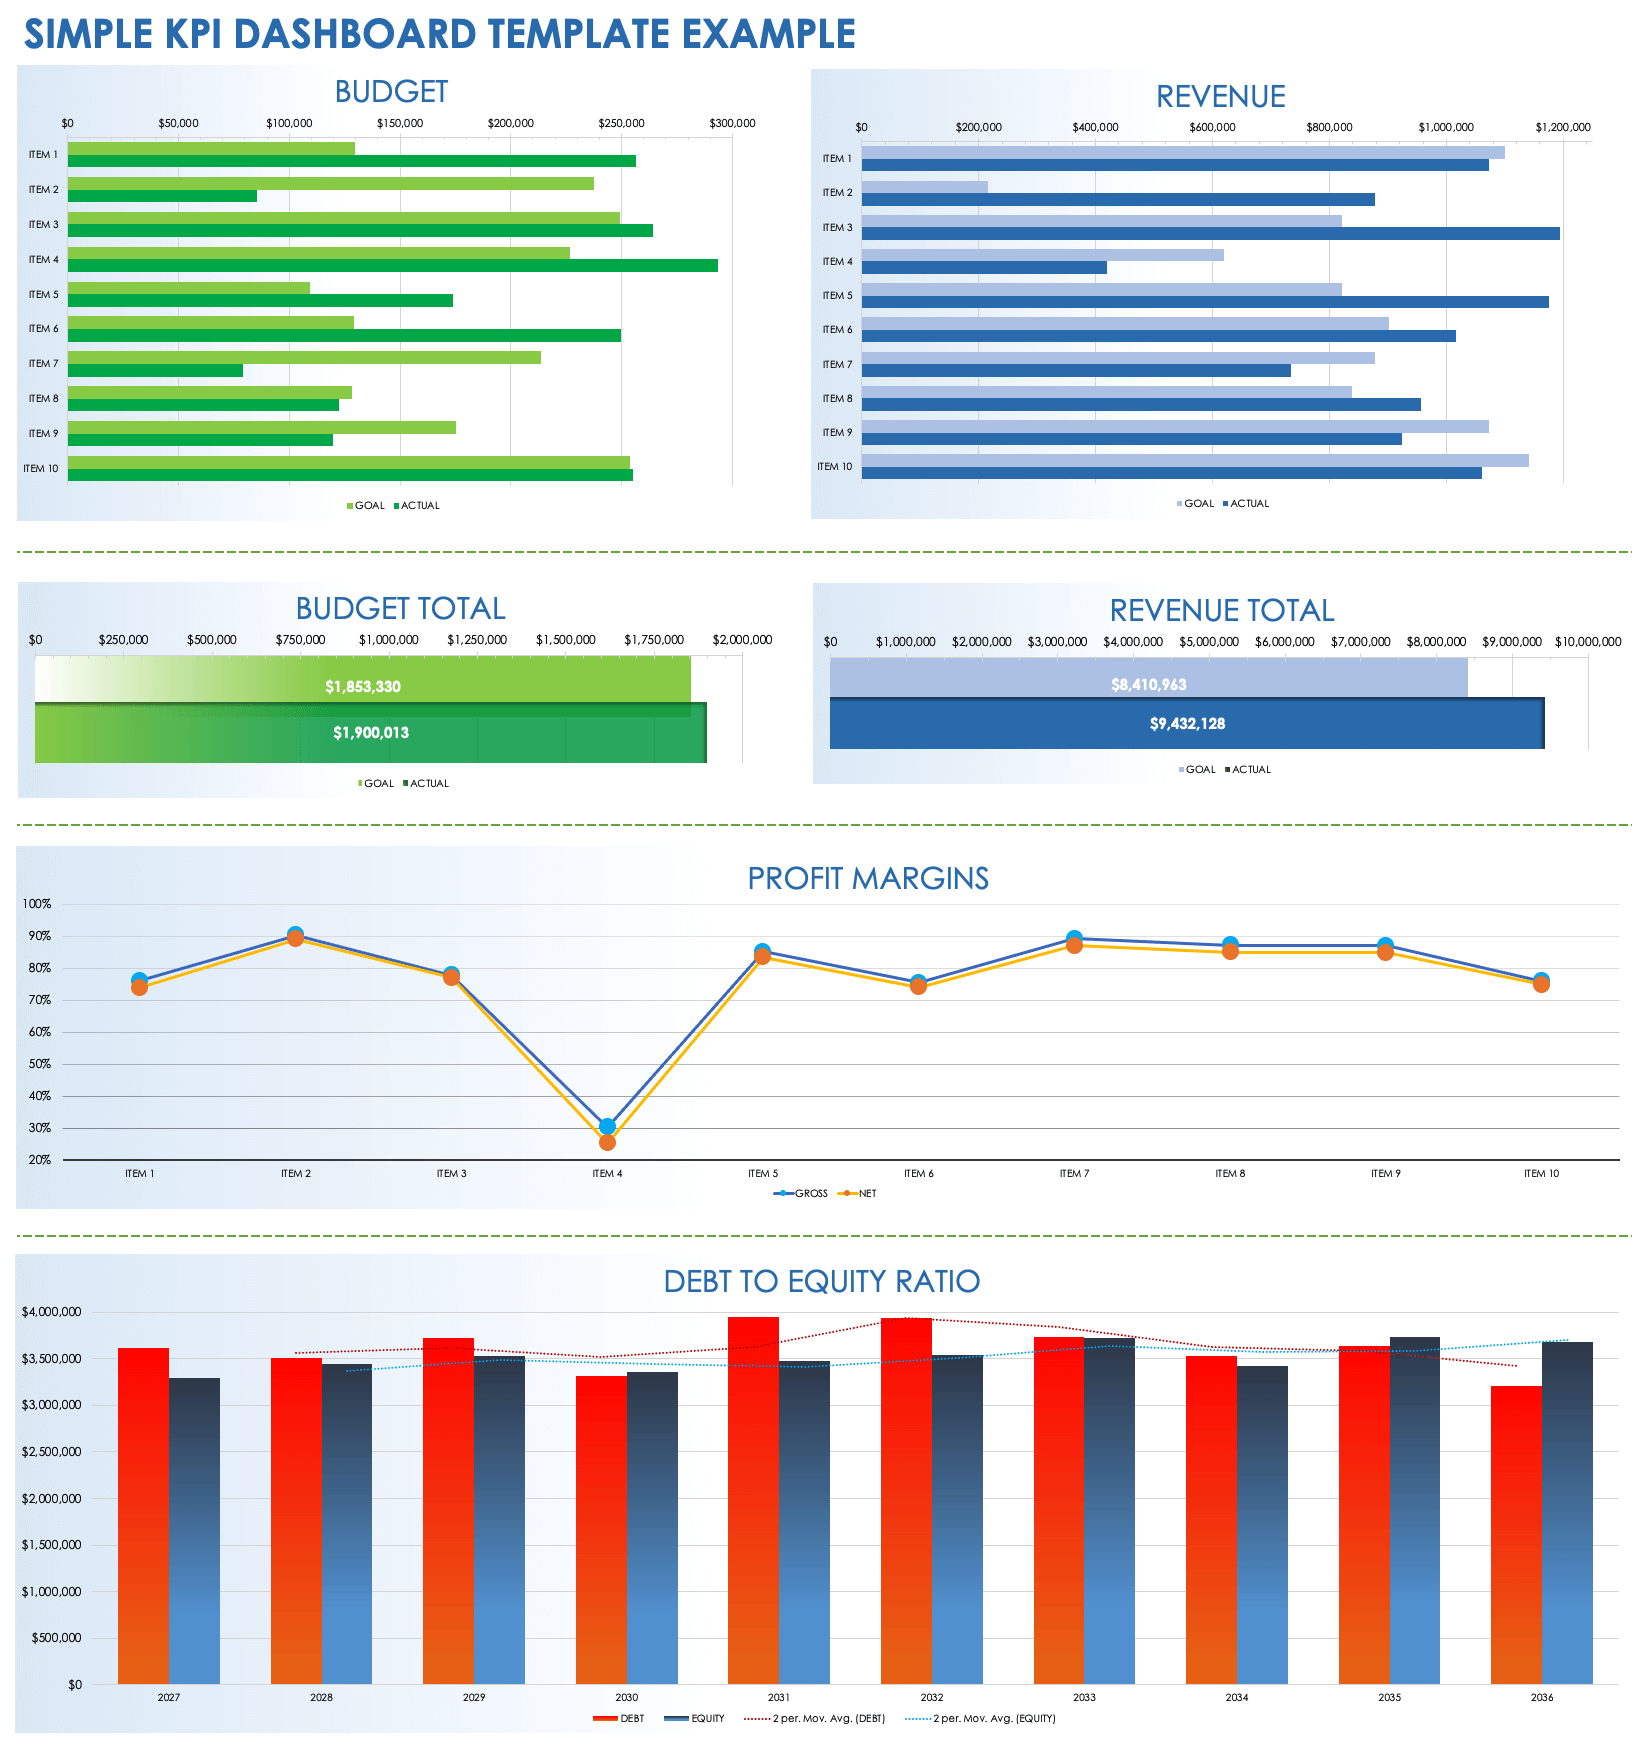
Simple KPI Dashboard Template
Download a Sample Simple KPI Dashboard Template for
Excel
| Google Sheets
Download a Blank Simple KPI Dashboard Template for
Excel
| Google Sheets
Use this simple KPI dashboard template to view your KPIs as horizontal bar charts, line graphs, and histograms. The template includes budget, revenue, budget vs. actual cost, profit margins, and debt-to-equity ratio KPI charts. Easily customize the template to provide KPI data for any series of performance measurements, and create a simple visualization of your metrics. Use the template’s Goal and Actual columns to track high-performance realization with this dynamic template.
See this comprehensive article on KPI dashboards to find additional KPI dashboard resources.
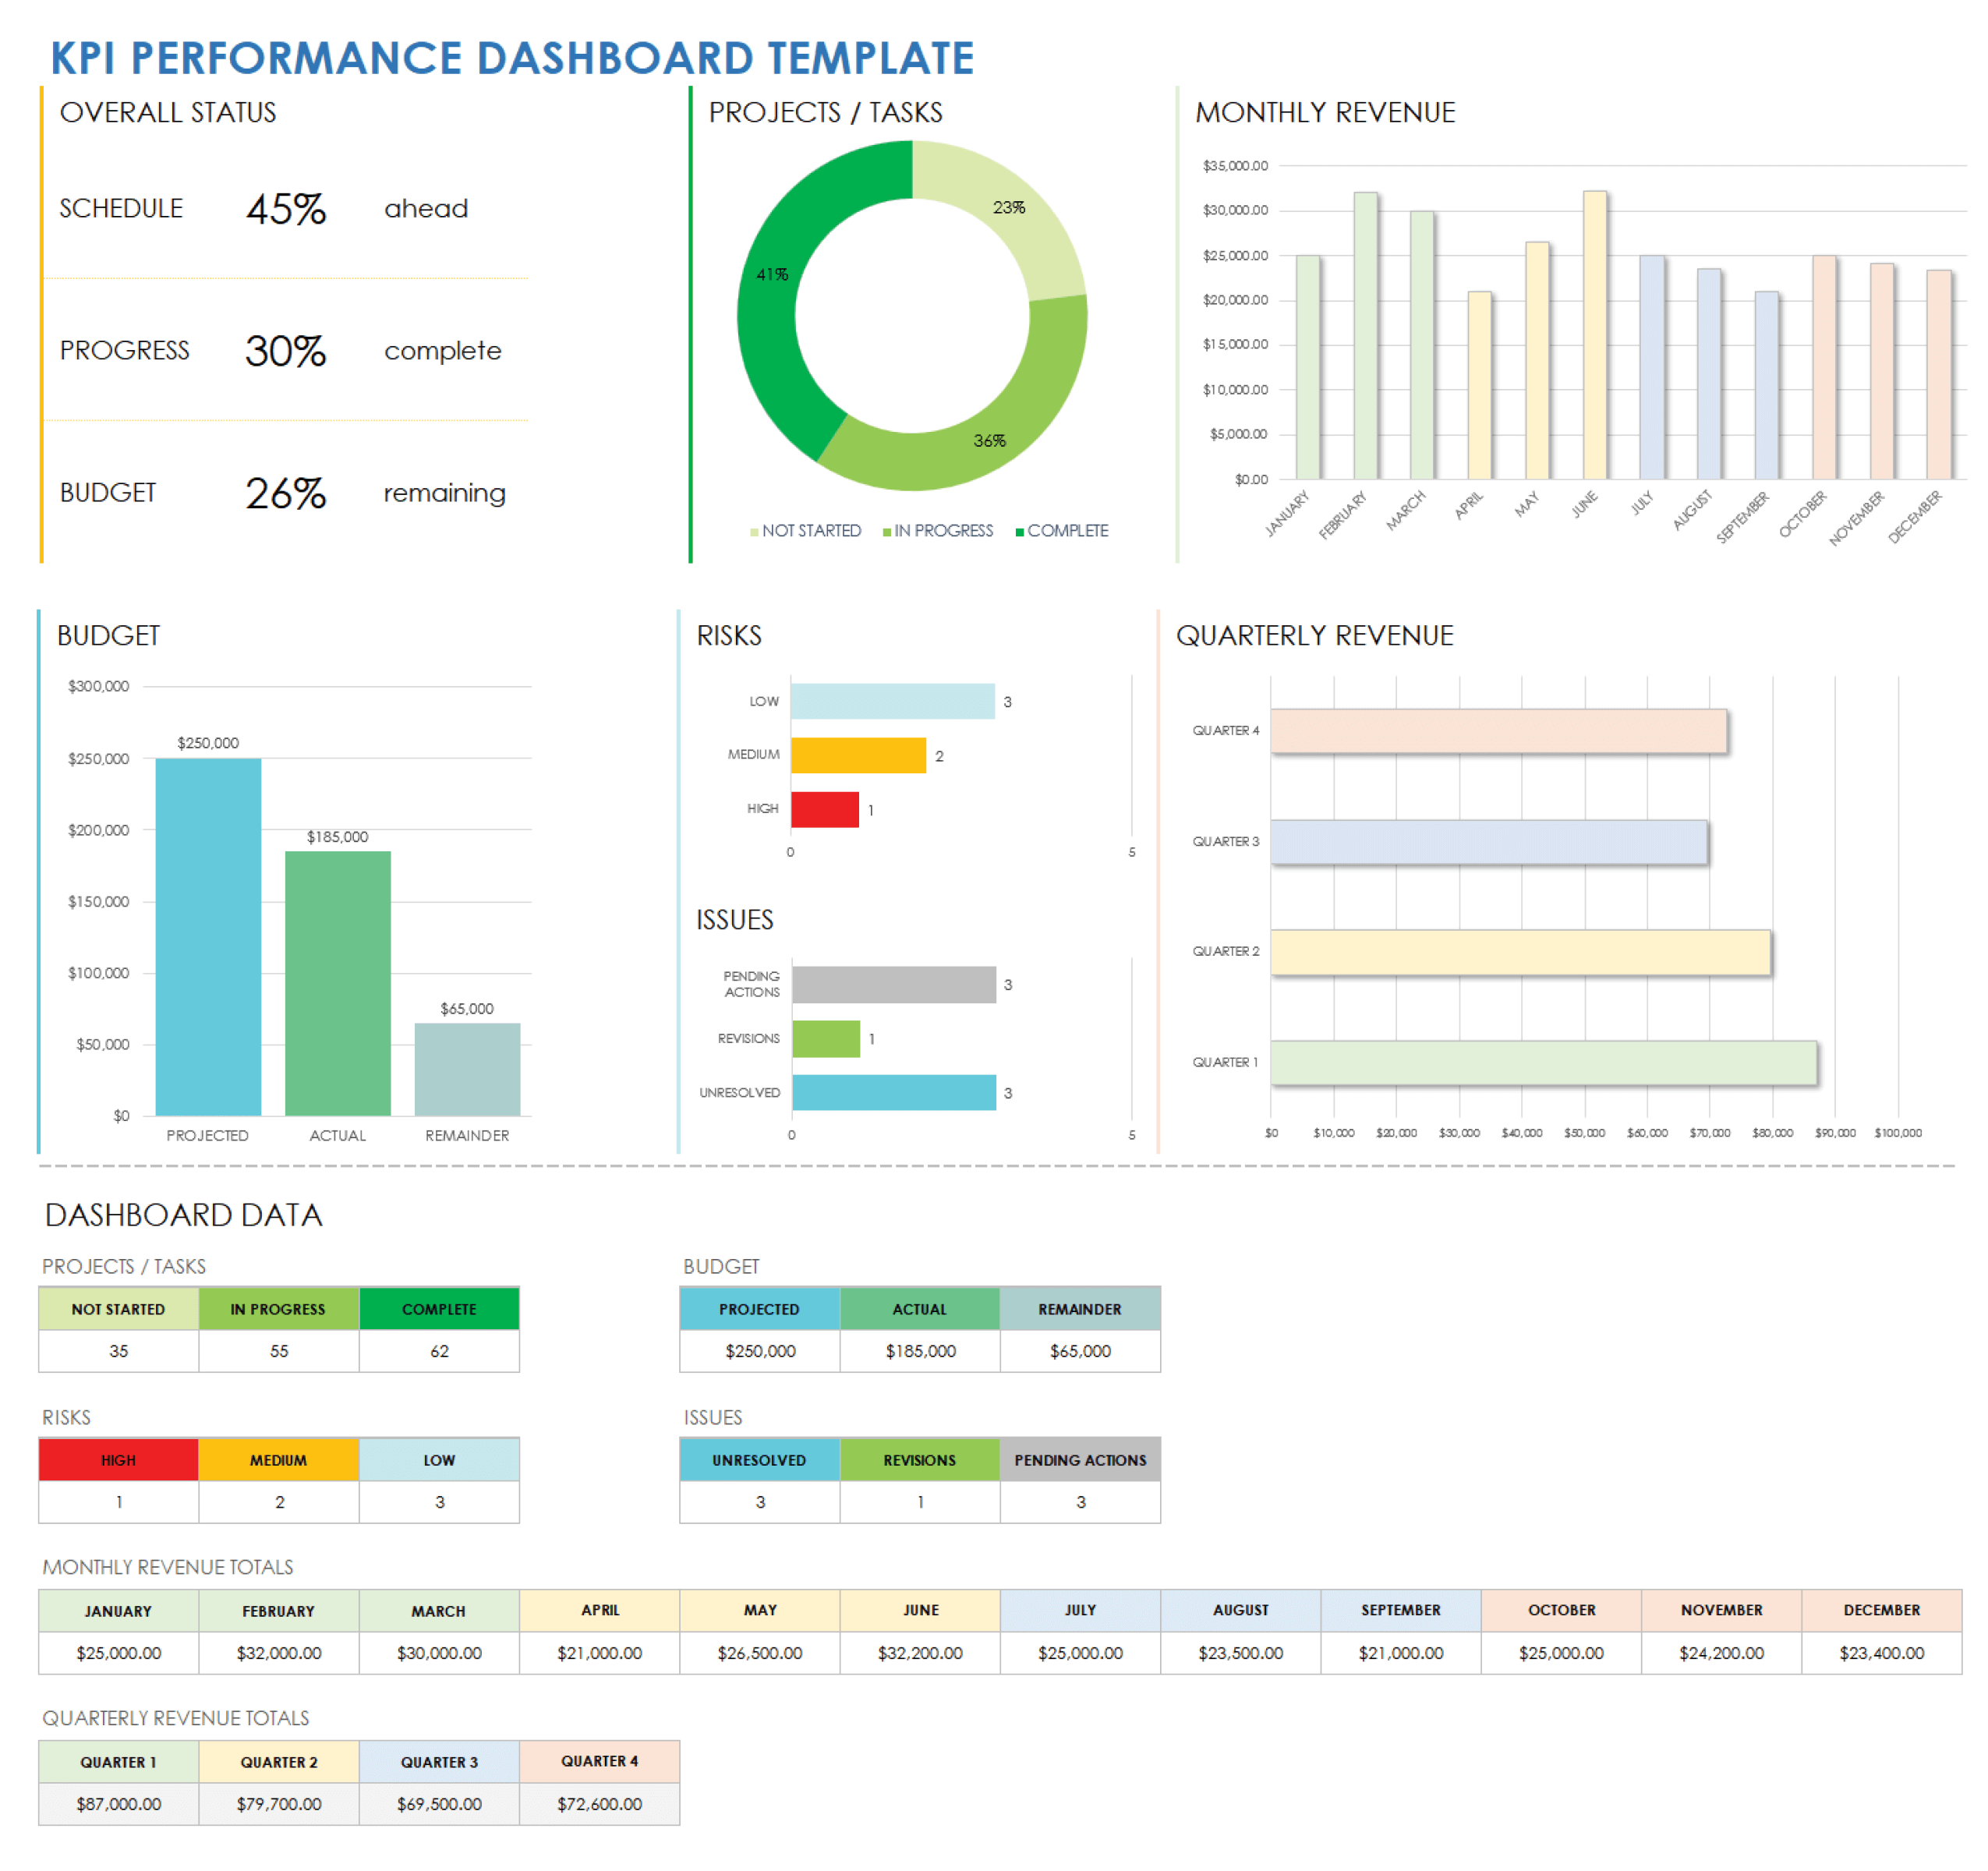
KPI Performance Dashboard Template
Download a KPI Performance Dashboard Template for
Excel
| Google Sheets
Exceed performance expectations with this visually rich KPI performance dashboard template. Track the month-by-month, year-to-date (YTD), and year-over-year progress of your KPIs with this template’s easy-to-read bar charts, line graphs, and donut graphs at a glance to ensure that you’re hitting your performance objectives. The template comes pre-loaded with Marketing and Operations data but can be retooled to measure KPIs for any vertical, department, or service.
See this detailed article on when to use KPIs instead of objectives and key results (OKRs) to quantifiably measure performance for your specific objectives.
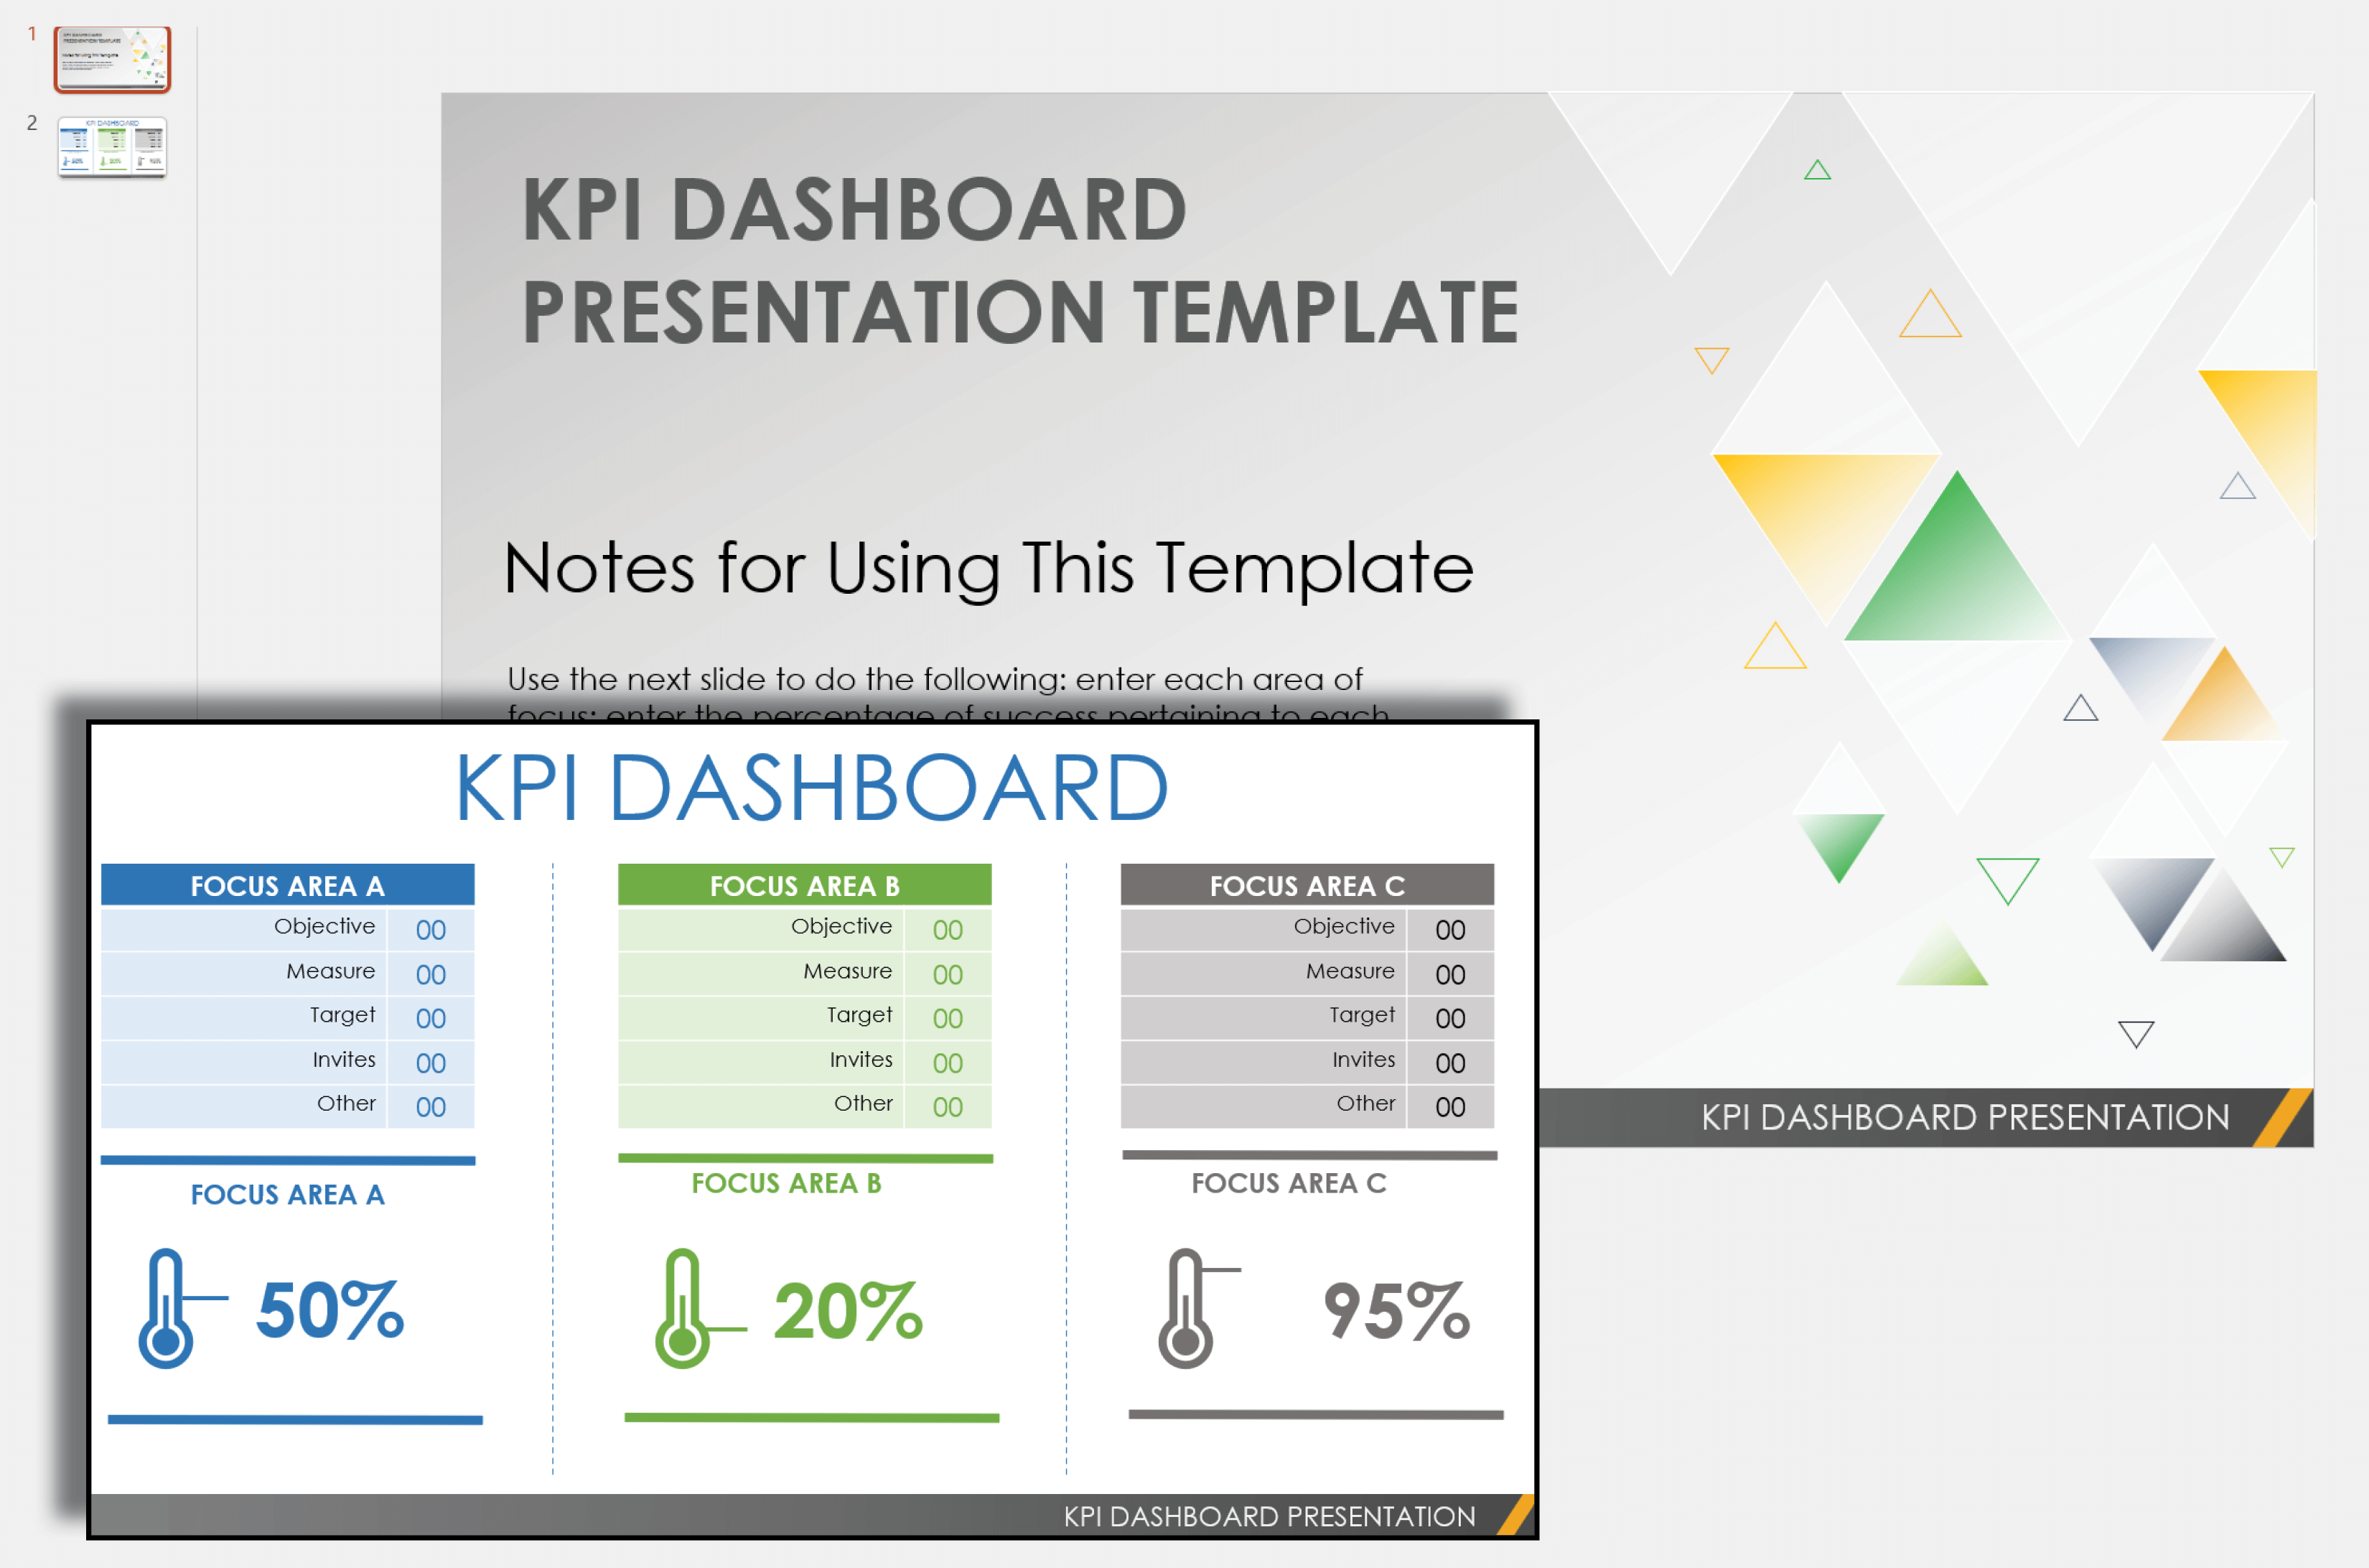
KPI Dashboard Presentation Template
Download a KPI Dashboard Presentation Template for
PowerPoint
| Google Slides
Introduce and explain the big picture for key objectives, progress, and milestones with this presentation-ready KPI dashboard presentation template. This template’s easy-to-read visual indicators help viewers quickly learn the status of any key performance indicator. Use this template to visually convert your data into easily understandable infographic updates on project, product, or service goals.
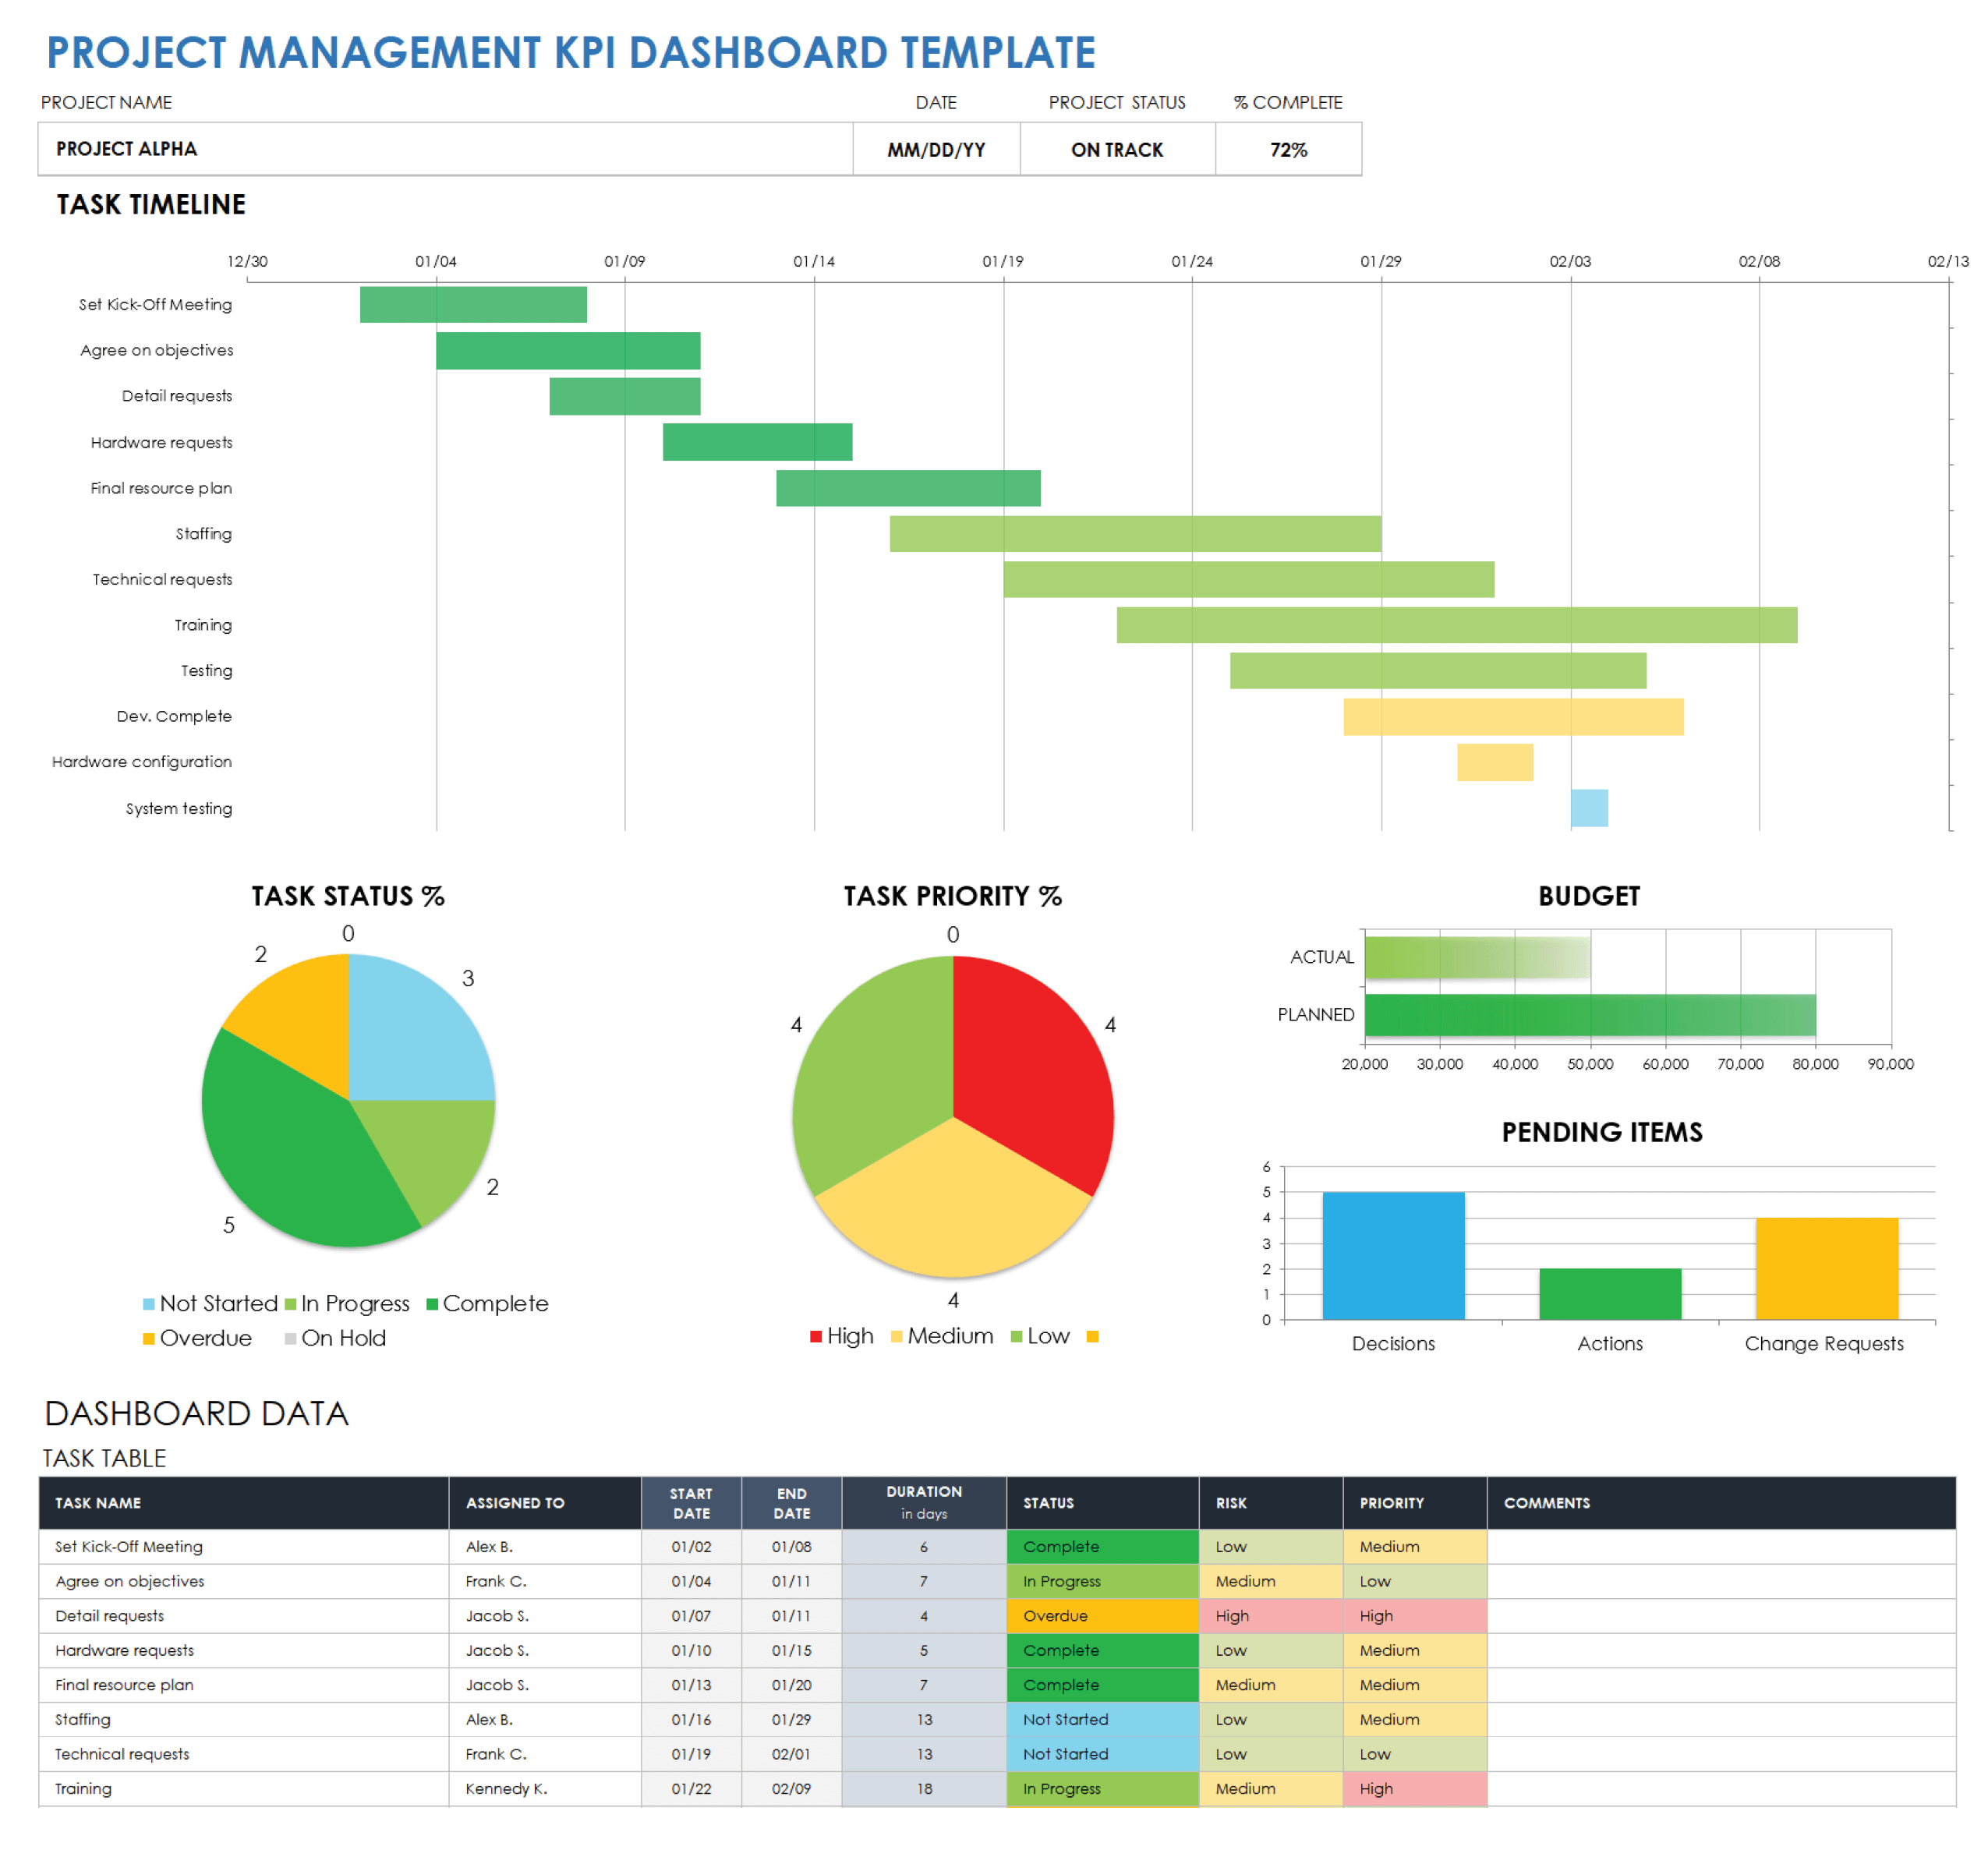
Project Management KPI Dashboard Template
Download a Project Management KPI Dashboard Template for
Excel
| Google Sheets
Help your project management office (PMO) track status, milestones, objectives, and overall project progress with this project management KPI dashboard template. In addition to Overall Status, Budget, and Pending Items pie and bar charts, the template also includes space to create individual project tasks, assign them to team members, set their priorities, and select their statuses. A Project Status field helps you keep track of overall progress toward project goals, while a Completed field tracks the percentage of your project that has been successfully completed.
For more resources on KPI dashboard metrics for project and program management, see this comprehensive article on crucial KPI metrics that provide valuable insights into the health of your project or program.
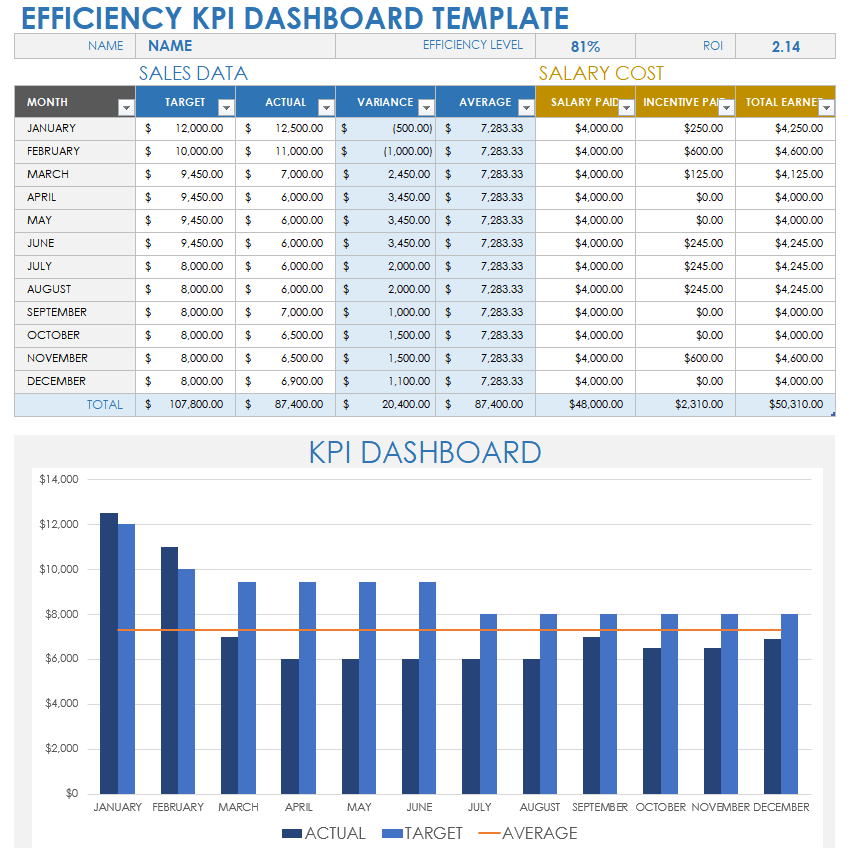
Efficiency KPI Dashboard Template
Download an Efficiency KPI Dashboard Template for
Excel
| Google Sheets
If efficiency is the primary KPI to assess your project, product, service, or sales data, this template is for you. This efficiency KPI dashboard template comes pre-loaded with data for a sales team but can be quickly customized to include data from any field. The template’s unique Efficiency Level field provides an efficiency percentage based on the month-by-month set performance target column data compared to actual results.
What Is a KPI Dashboard Template?
A KPI dashboard template is a visual tool for measuring performance over time. These templates compare achievements to set milestones and goals. Use a KPI dashboard template to visually represent your team’s progress, efficiency, and performance with graphs and charts.
A KPI dashboard template provides a framework for gauging your project, product, service, sales, or individual performance. While you can use a KPI dashboard template to monitor performance progress, you can also use it to help you track daily, monthly, or annual variances. Doing so can help you pinpoint particular areas of performance that need improvement.
By having an effective tool to standardize performance tracking, project sponsors, project managers, stakeholders, team members, and others can rest assured that performance will improve over time.
Most KPI dashboard templates include bar charts, pie charts, and/or histograms so that teams can easily track progress. Having easy-to-read visual representations of set objectives helps managers share data-rich details in a high-level, visually dynamic, easy-to-read format. By using a KPI dashboard template, project managers can ensure that priorities, objectives, goals, and deliverables are clearly defined; that all related tasks are assigned; and that all performance standards are trending upward.
How to Create a KPI Dashboard in Excel
A KPI dashboard provides charts and graphs that track progress toward set objectives for any vertical. Create a KPI dashboard in Excel to help you track key goals by filling in an existing KPI dashboard template with your preferred data.
A KPI dashboard provides a single-screen view of pre-set KPIs. If the existing KPI dashboard template isn’t pre-filled with the KPIs you want to track, you can easily customize it. By creating the KPI dashboard that you want from an existing template, you can ensure that your dashboard tells the high-level story of your data in a presentation-ready format.
While creating a KPI dashboard from scratch in Excel can be time consuming, KPI dashboard templates enable you to streamline the process. Simply customize an existing template to suit your specific needs.
For example, if an available KPI dashboard template includes project-oriented factors such as task progress and status, task completion status, budget, and pending items, but you are not working on a specific project, you could customize this template to track sales goal data, sales tasks, or profitability goals.
Similarly, if a KPI dashboard template focuses on sales goals and efficiency, you could switch out the sales data for tasks, department goals, or other metrics you want to measure. By doing so, you can adjust the efficiency level to be a key performance indicator of task, project, or department efficiency.
By customizing a KPI dashboard template as early as the project-planning phase, project managers, sponsors, and team members can agree upon objectives and set KPI metrics. This way, you and your team can track, measure, and analyze achievements, as well as make necessary recalibrations and adjustments to ensure that you achieve your goals.
Stay on Top of Your KPIs with Real-Time Work Management in Smartsheet
Empower your people to go above and beyond with a flexible platform designed to match the needs of your team — and adapt as those needs change.
The Smartsheet platform makes it easy to plan, capture, manage, and report on work from anywhere, helping your team be more effective and get more done. Report on key metrics and get real-time visibility into work as it happens with roll-up reports, dashboards, and automated workflows built to keep your team connected and informed.
When teams have clarity into the work getting done, there’s no telling how much more they can accomplish in the same amount of time. Try Smartsheet for free, today.