PERT Definition and Origins
Program Evaluation and Review Technique work is represented in a chart or diagram that makes visible all scheduled tasks in a project in sequence. Using PERT, project managers analyze how much time it will take to complete each task and any dependent task, and then forecast how long the whole project will last.
While most project frameworks depend on forecasting the most likely timeline, PERT integrates three time scenarios - the shortest possible time, the most likely time, and the longest possible time. PERT’s formulas come up with a weighted average of those three durations, resulting in an estimate that is often more accurate than other models.
The Birth of PERT
PERT was born during the Cold War when the U.S. Navy undertook the Polaris missile project to arm nuclear submarines. This effort required coordinating some 9,000 subcontractors as well as dozens of simultaneous and interdependent activities. Worried about the Soviet threat, the Navy wanted to deliver the project as rapidly as possible.
Navy officials worked with defense contractor Lockheed and consultants Booz, Allen, and Hamilton to design a program tool that would ensure the missiles were ready when the submarines were. They originally sketched the concepts on a tablecloth over lunch, and eventually they evolved into PERT.
Due in large part to PERT, Polaris finished years ahead of schedule and on budget, and it was hailed as a U.S. triumph in the arms race. As a result, the technique became standard on large government projects of that era. Contractors who worked on those projects (especially in defense and construction) helped spread it to the private sector, according to Helen Cooke, Project Management Consultant and co-author of the textbook The McGraw-Hill 36-Hour Course: Project Management.
“The government required contractors to use it on complex projects in defense and construction. That caused PERT to proliferate in the private sector, and it was adopted heavily by project managers,” Cooke said.
Mitchell L. Springer, Executive Director of Purdue University’s Polytechnic Institute, said in his book Program Management: A Comprehensive Overview of the Discipline that PERT experienced a rapid rise and then an abrupt decline in use in the 1970s. This is attributed to two factors: PERT was over-applied and combined with non-scheduling data that made it cumbersome to work with. However, Springer said the rise of software programs to run PERT prompted a resurgence in the 2000s.
Reasons to Use PERT
PERT helps managers shape their projects and manage the time allotted more effectively. Here are some of the reasons PERT is used:
- Estimate a completion date - Calculate an overall completion date based on all the task estimations derived from the PERT formula, which we will cover in detail below.
- Gauge risk when there is a drop-dead date - If your client or organization needs the project completed by a specific date, you can assess how realistic that is with the PERT estimates. By figuring out the standard deviation, you can calculate the probability of meeting your deadline. The formula for standard deviation in PERT is the optimistic time minus the pessimistic time divided by 6. This article provides a good explanation of how to use standard deviation to calculate confidence intervals and probabilities for meeting targeted completion dates. The basic concept is that if your pessimistic date (i.e. the worst case scenario) falls within one standard deviation (a measure of variance from the average) then your likelihood of achieving it is greater than if it were two, three, four, etc. standard deviations away. In this context optimistic is bad (because it's the most rushed and requires more things to come off in the best possible way) and pessimistic is good (because it's easier to achieve).
- Find where you have flexibility - If a project manager needs to track and save employees' time, PERT helps him or her identify which activities are good candidates for speeding up the deliverables. Tasks with a large range between optimistic and pessimistic time estimates have the greatest flexibility.
- Improve scheduling of tasks - Project managers can be more precise using PERT. With very large projects, it may not be immediately obvious when particular activities should begin and end. The project manager using PERT can schedule each activity based on estimated completion time and derive start and end dates for the project based on the first task’s start date and the last task’s completion date.
“In my experience, most people assessing the amount of time required to complete a task are overly optimistic,” said Michael Campbell, a Consultant, Adjunct Professor at St. Edward’s University, and author of Idiot’s Guide to Project Management. “The value of using PERT charts is forcing them to think of the estimate in three ways - best case, worst case, [and] most likely. Just the exercise of thinking through those three estimates removes much of the optimistic bias and makes for a much more realistic estimate.”
In project management theory, three main constraints exist (they are often illustrated as a triangle and sometimes called the Iron Triangle or Triple Constraint). The constraints are time, cost and scope (the deliverables, technical specifications or intended features), and the interaction of these three determines quality.
Willard Fazar, an official in the Navy’s special projects office when PERT was developed and instrumental in the rise of the technique, said in a 1959 article in American Statistician that time is the central constraint in PERT. The technique “employs time as the variable that reflects planned resource applications and performance specifications. With units of time as a common denominator, PERT quantifies knowledge about the uncertainties involved in developmental programs requiring effort at the edge of, or beyond, current knowledge of the subject - effort for which little or no previous experience exists,” he wrote.
How PERT Relates to Critical Path Method
In 1957 (around the time the Navy was creating PERT) DuPont developed another project management technique, Critical Path Method (CPM). CPM was designed to address similar challenges it faced in planning how to shut down chemical plants for maintenance and then restart them. For a complete introduction to CPM, read this guide.
The critical path is the sequence of activities in the project with the longest duration. A delay in any of these will push the whole project back. CPM and PERT are often used together, and they both address how long a big project will take. They each have their strengths, and more project managers are using both techniques or merging them.
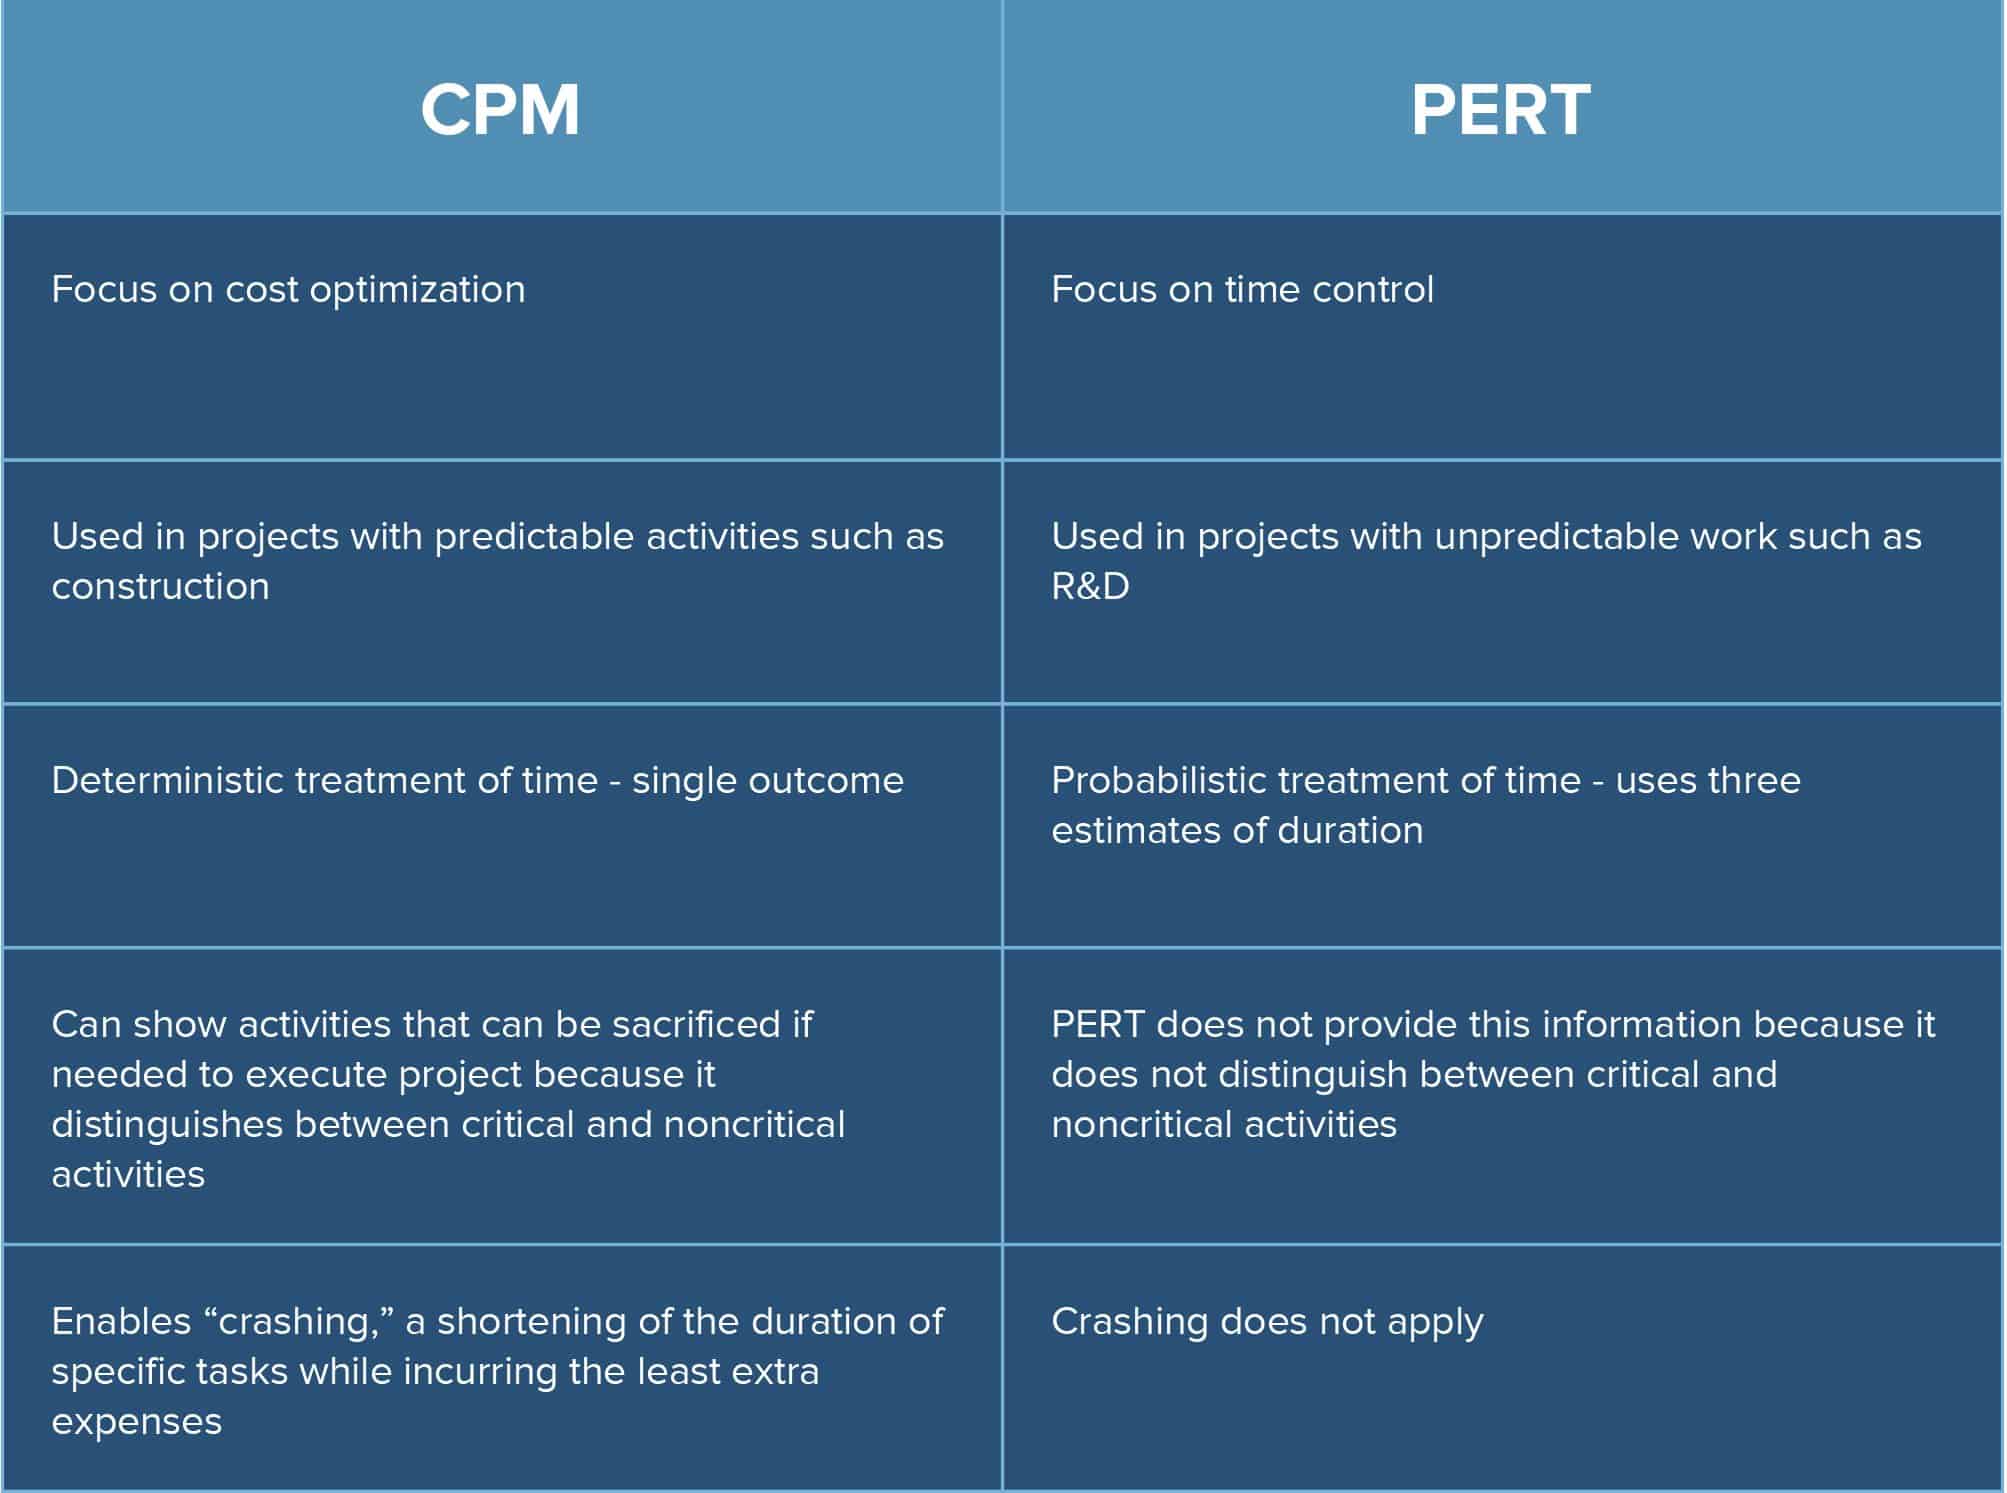
However, there are some crucial differences between PERT and CPM. The most important is that while PERT focuses on controlling time, CPM focuses on cost optimization. In other words, PERT assumes cost varies directly with time while in CPM cost is not directly proportional to time.
Other distinctions between the two methods are summarized below.
How to Create a PERT Chart
How to Create a PERT Chart
Here are the steps to put PERT into practice on your project. There are software programs that can automate the calculations and generate PERT charts.
1- List all the tasks required for your project and the order of completion. Some tasks may be able to happen simultaneously (called non-dependent or concurrent tasks) while others cannot begin until a predecessor task is finished (called dependent or sequential).
2- For each task, give three time estimates in days: the most optimistic completion time (O), the normal/most likely time (M), and the pessimistic time (P).
3- Calculate expected time (TE) using the formula (O + 4*M + P) ÷ 6 = TE. Use our quick calculator
PERT Estimate Calculator
See the examples below to understand how to calculate TE.
4- Once you calculate TE, you can create a Gantt chart, a way of visualizing a project schedule using horizontal bars representing time duration across a calendar.
5. Now you can draw your PERT chart. If you are doing this by hand, you will likely need to work through a few drafts. PERT charts are most commonly network diagrams in which the tasks or major activities are nodes (boxes) with arrows connecting them.
6. Draft out the tasks. It can be helpful to create a card or box for each task containing the activity name, duration, slack (read on for details on this), start and end dates.
7. Lay the activities out in sequence from left to right. There are two different conventions for connecting the tasks with arrows - activity on arrow (AOA) and activity on node (AON). If you use software, it may make the choice for you. If not, many people find AON more intuitive.
With AOA, the activity name and duration are on the arrows and information such as duration appear on the nodes. The nodes represent milestones, and the length of the arrow sometimes also reflects duration. With AON, the nodes represent the activities and the arrows represent the order and relationships among the tasks.
Activities are not allowed to share the same starting and ending nodes, so sometimes a “dummy activity,” which has no cost or time duration is inserted to make the precedence of tasks clear. Activities that happen concurrently are laid out in parallel on the diagram.
Harold Schroeder, a Consultant with expertise in managing complex projects, said a common mistake in PERT diagrams is forgetting to connect all activities with another. “This is often called ‘dangling’ and can be easily avoided by checking to ensure all on-final activities are connected to some other activity in the network. That said, PERT allows one to see how the pieces fit together, thereby revealing critical elements that may need correction,” he noted.
9. Calculate how long the project will take. Add up the likely durations of all the tasks to get the expected length of the project. You can then identify start and end dates. Working with your optimistic and pessimistic time estimates, you can also forecast the soonest possible and latest possible completion dates. If it is imperative your project finish by a certain date, choose that as the completion date and work backwards using the most pessimistic time estimates.
10. Figure out the critical path and slack. The critical path is the sequence that takes the longest to complete. Slack is the amount of time an activity can be be delayed without delaying the overall project (it is calculated as the difference between the earliest possible start time and the latest possible start time or between the earliest finish time and the latest finish time). Any activity with a slack time of zero is on the critical path. Some PERT charts color the critical path in red.
PERT Terms and Glossary
Getting up to speed with PERT requires learning some key terms. We’ve listed them here to help build your vocabulary on the topic. These will be particularly helpful if you’re using software to create your PERT chart.
- PERT Event - A milestone or point at which an activity starts or ends.
- Predecessor event - An event that occurs before another event.
- Successor event - An event that follows another event.
- PERT activity - Performing a task in the project.
- PERT subactivity - Performing a task that is a subset of a larger activity.
- Deterministic vs. probabilistic estimates - An estimate with a single outcome (deterministic) vs. one with multiple outcomes (probabilistic).
- Optimistic, pessimistic, most likely time - PERT’s three-point time analysis looks at the shortest, longest, and normal time for completing tasks and projects.
- Expected time - The best estimate using the PERT formula of time to completion.
- Float or Slack - The amount of time a task can be delayed without delaying subsequent tasks or the whole project.
- Critical activity - A task with slack of zero.
- Lead time - The amount of time that two activities overlap.
- Lag time - The amount of waiting time or delay between two activities.
- Fast tracking time - Executing critical activities concurrently.
PERT Analysis: How Likely Will the Project Be on Time?
You’ll recall that in PERT, you will estimate three time scenarios - optimistic, likely, and pessimistic. Using the weighted average formula, an expected completion date can be derived. But as an on-the-ball project manager, you will want to assess the probability of meeting that date and updating your projections as the tasks unfold because unexpected complications often arise.
This is when PERT analysis comes into play. You can calculate the probability of your most likely time scenario playing out using standard deviation, a term for the amount of variation in data. A low standard deviation means the data points cluster around the average. In PERT, that average is represented by the expected time calculation mentioned earlier. The formula for calculating the standard deviation is (P-O) ÷ 6.
The larger your standard deviation, you can have less confidence in your estimate. If you are using a software tool, it will perform these calculations for you. If you are doing them by hand, this is a good explanation of how to calculate the exact probability of meeting your estimate based on the standard deviation.
PERT Pros and Cons
PERT has many fans, but even devoted users note that it has limitations. Let’s look at the pros and cons of using PERT.
Advantages:
- Active engagement - PERT experts say that one of the technique’s greatest advantages is that it forces project managers to assess and quantify the time that activities in their projects are likely to take and also to ponder the uncertainties they face. PERT also provides more information to aid in analysis of project scenarios.
- Strong forecasting potential - While no system is perfect, PERT is one of the best for estimating how long a project will take. This allows organizations to make other forecasts for sales, revenue, labor requirements and more.
- Improved coordination - The PERT chart brings together input from various departments and participants about project resources and processes. The chart makes clear the dependencies of different activities, which helps key players work together. It also serves as a communication hub because it updates in real-time as the project progresses. The diagram offers senior management a snapshot of where the project stands.
- More realistic modeling - By making different time scenarios available and visible, PERT facilitates analysis and allows managers to model outcomes using different combinations of data. The result is often better decision making and fewer surprises.
Disadvantages:
- Potential unreliability - Project managers hope to base their PERT time estimates on real world experience, but with a rapidly changing world, that information can become quickly outdated. More broadly, such data can be subjective and potentially unreliable.
- Weak on financial factors - PERT, with its focus on time, is sometimes faulted for not giving sufficient weight to cost, resources, labor, and capital needs.
- Intensive to maintain - With the amount of data collection and computation involved, PERT can be labor intensive and thus expensive to support. This is mitigated by the development of software tools, and some organizations choose to do PERT models for only the most high-risk activities in their projects.
Discover a Comprehensive Project Management Tool with Smartsheet
From simple task management and project planning to complex resource and portfolio management, Smartsheet helps you improve collaboration and increase work velocity -- empowering you to get more done.
The Smartsheet platform makes it easy to plan, capture, manage, and report on work from anywhere, helping your team be more effective and get more done. Report on key metrics and get real-time visibility into work as it happens with roll-up reports, dashboards, and automated workflows built to keep your team connected and informed.
When teams have clarity into the work getting done, there’s no telling how much more they can accomplish in the same amount of time. Try Smartsheet for free, today.