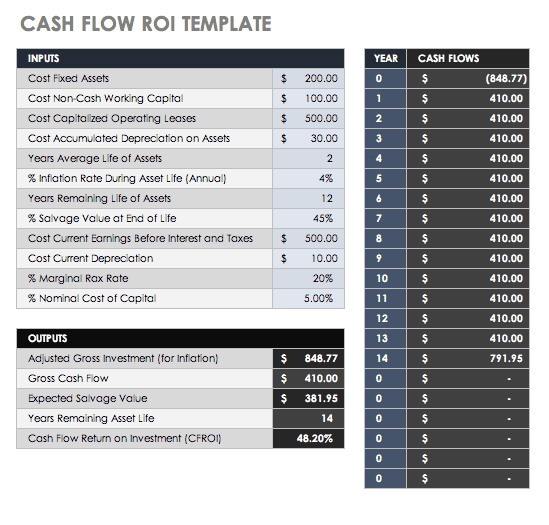
Cash Flow ROI and Template
Cash Flow ROI (CFROI) is a proxy for a company’s economic return. This return is compared to the interest rate charged to commercial banks from the Federal Reserve’s standard (the discount rate), to see if there is value-added potential. CFROI is the average economic return in a year on all of a company’s investments. Enter your variables in this template to determine your company’s CFROI.
Download Cash Flow ROI and Template - Excel
In this template, you will enter the following variables:
Cost Fixed Assets: These are assets not expected to be used up or converted into cash within a year. They can include property, plant, and equipment (PPE), and may be used to generate income.
Cost Non-cash Working Capital: The sum of inventory and receivables
Cost Capitalized Operating Leases: Posted as an asset on the balance sheet, this type of lease expenses the lease payments.
Cost Accumulated Depreciation on Assets: An asset account with a credit balance.
Years Average Life of Assets: The accumulated depreciation divided by the current depreciation expense.
Percent Inflation Rate During Asset Life (Annual): The change in purchasing power.
Years Remaining Life of Assets: This is calculated based on when the asset went into service and the preferred depreciation method.
Percent Salvage Value at End of Life: The resale value at the end of the asset’s useful life.
Cost Current Earnings Before Interest and Taxes (EBIT): All incomes and expenses, except interest and income tax expenses.
Cost Current Depreciation: The deduction that helps spread the cost over many years.
Percent Marginal Tax Rate: The tax percent of your income based on your tax bracket.
Percent Nominal Cost of Capital: The rate of return needed to persuade your company to make a given investment.
Below are the outputs from these inputs:
Adjusted gross investment (for inflation)
Gross cash flow
Expected salvage value
Years remaining asset life
Cash flow return on investment (CFROI)
Cash flows per investment year
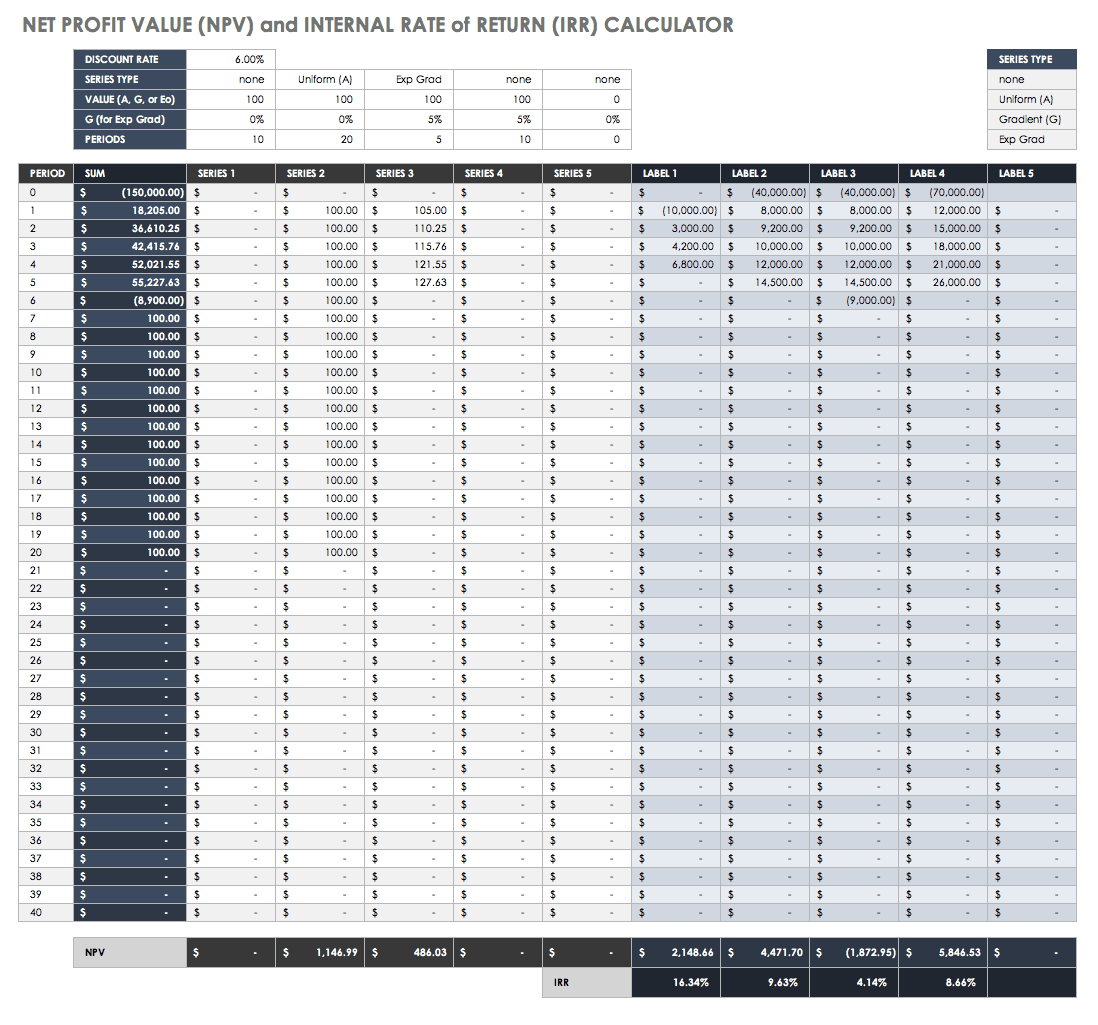
NPV and IRR Calculations and Template
Net present value (NPV) and internal rate of return (IRR) are metrics used to estimate ROI. NPV is the dollar difference between the present value of cash inflows and outflows over time. Companies use NPV as a tool to help them decide if an investment will provide long-term value, to compare different investment options, and to decide whether they should introduce a new product. IRR is the calculation that estimates the percent profitability of possible investments by taking the NPV equal to zero.
NPV looks at each cash flow separately, even when the discount rate is unknown. An NPV greater than zero makes a project financially worthwhile. IRR compares projects using one discount rate, predictable cash flows, equal risk, and a shorter time. IRR does not account for changes in the discount rate, which at times makes it a poor metric. Further, if there are a mix of positive and negative cash flows, IRR calculations are not effective. To calculate your company’s NPV and IRR, use this template.
Download NPV and IRR Calculations and Template - Excel
In this template, you will input the following:
Discount rate
Series payment type (None, Uniform, Gradient, or Exp Grad)
Value (A, G, or Eo)
G % for Exp Grad
The number of periods
For each period, the values
Below are the outputs for this template:
The sum for each period
The different series for each period
NPV for each series
NPV for each label
IRR for each label
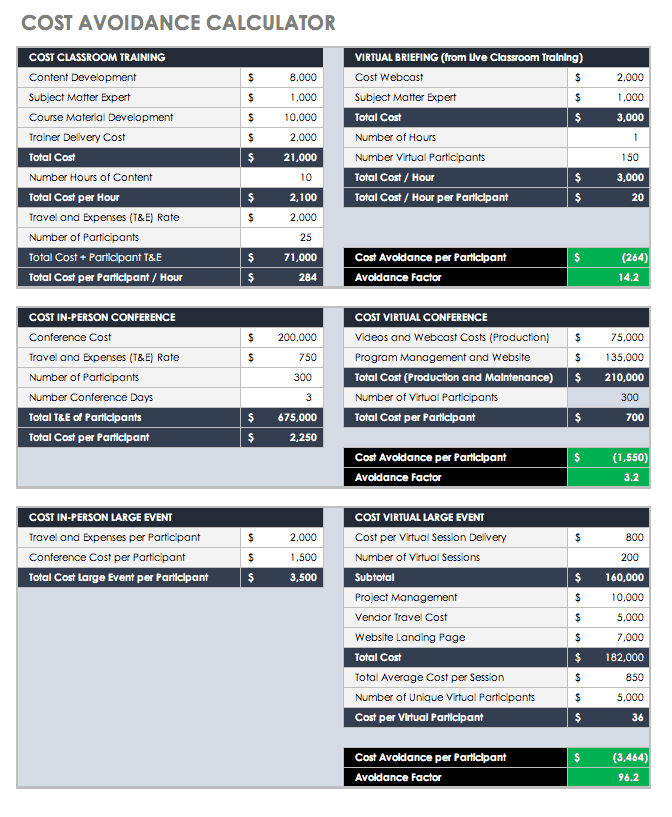
Cost Avoidance Calculator Template
Preparing for a conference or large event is a big commitment for a business. There are direct costs, such as airfare, registration, and accommodations, and indirect costs such as the hours of preparation. Cost avoidance includes actions or event-substitutions that reduce future costs, such as planning virtual conferences, trainings, or parts replacement before failure (and subsequent damage to other parts). Cost avoidance activities may incur higher immediate costs but save money — sometimes totaling extreme savings — over time. This is a different concept from cost savings, in which you actually save the money you plan on spending. Lower spending, investment, or debt levels is what saves money.
Use this template to calculate cost avoidance as ROI. This calculator has a variety of event scenarios, including training, conference, and an in-person event. These costs are compared to a virtual briefing, a virtual conference, and a virtual large event, respectively. With your input, you can calculate the costs per participant for each, the cost avoidance factor per participant, and the avoidance factor.
Marketing ROI and Content Marketing Templates
Marketing is a huge expense for any business. Whether your company invests in a comprehensive program that rolls out print and television ads as well as a social media presence, or just has a Facebook page, you should know the worth of your content over time. Sirius Decisions stated in 2013 that 60 to 70 percent of content goes unused. The cost of creation itself involves the per hour cost of each person by the number of creation hours involved, plus any actual content expenses. Having the ROI for marketing content can help motivate your staff to use it.
The marketing ROI (MROI) is simply the revenue generated from your content minus the cost to produce your content. This is a simple calculation, but some professionals caution that marketing professionals should define how and what they have measured in order to signal to stakeholders whether they are defining short-term channel-specific ROI or informing for long-term budget or strategic decisions. In this marketing ROI template, you will find space for multiple marketing initiatives in order to compare their relative value.

Download Marketing ROI Template - Excel
To use this template, input the following:
Total initiative cost
Total circulation/audience
Response rate (percent of generated leads by the audience)
Conversion rate (percent of leads which will purchase)
Average revenue per sale
Average profit per sale
From these inputs, you will get these outputs:
Total costs of all initiatives
Total cost/audience for all initiatives
Average profit per sale for all initiatives
Number of leads generated
Number of sales
Total revenue uplift
Total cost
Total profit uplift
ROI
ROI percent
Cost per lead
Cost per sale
Break even response rate
Break even conversion rate
Break even profit per sale
The demand for marketing measurement and reporting is rising with marketing costs. There are many metrics that should be reported to show the success of your marketing program. Many professionals are not comfortable communicating their impact on the bottom line metrics to get the support they need. The key metrics that every marketing person should be comfortable reporting include the following:
Reach
Total Reach: The number of people your company can reach across your different networks and platforms. Each is a potential client.
Reach by Channel: The number of people following or subscribed per channel.
Visits
Total Website Visits: The number of people who visited your website in a period of time. This metric shows how well your inbound marketing is directing people to your website, which is also tracked month over month (MoM).
Website Visits by Source: This metric reports where people are coming to your website from to determine how well specific campaigns are working.
Leads
Total Leads Generated: This metric shows the interest your campaign generates for the products or services. It is one of the strongest ROI indicators.
Leads Generated by Source: This metric shows the channels that produce the most leads, which allows you to focus on the most valuable sources.
Customers
Total Customers Driven by Marketing: This metric tracks which marketing campaigns are yielding the most customers.
Marketing Generated Customers by Source: Track the source of the customers acquired by each campaign.
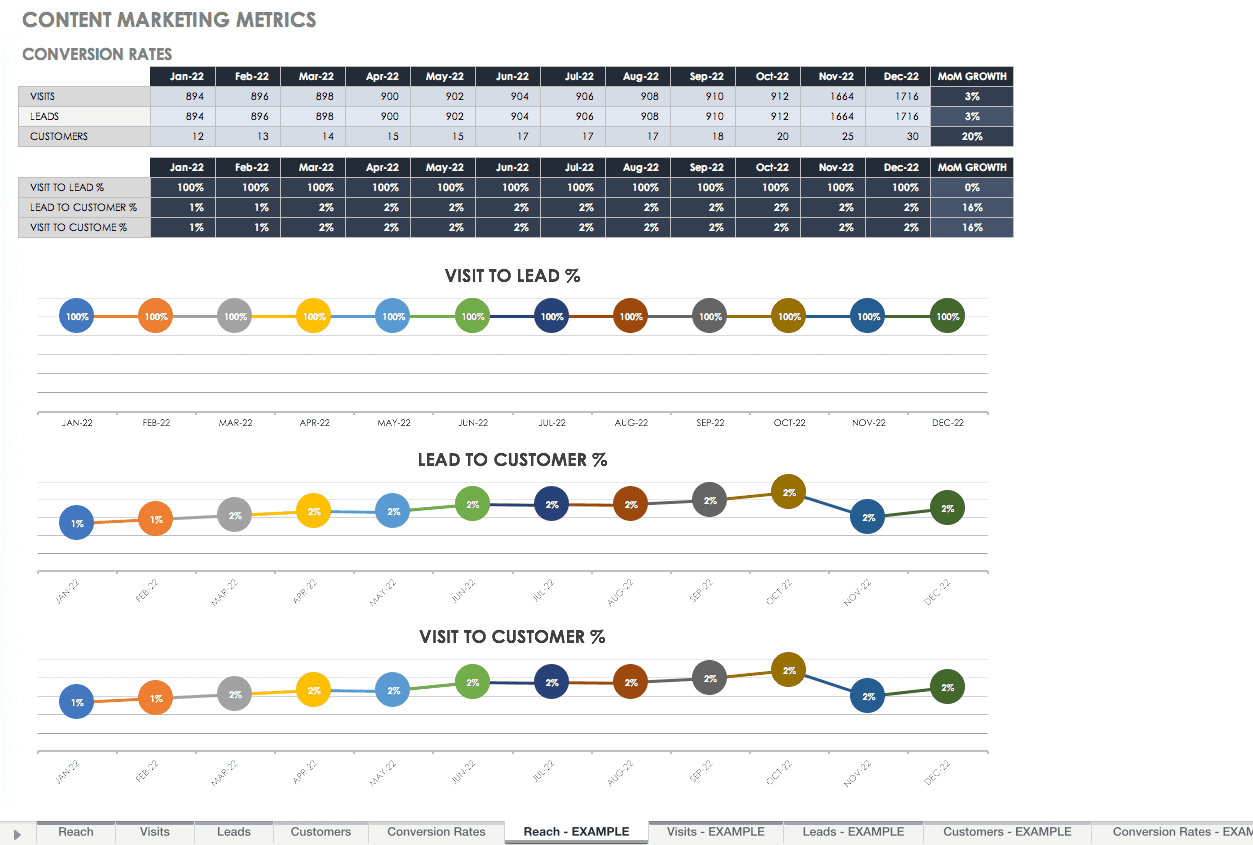
Conversion Rates
Visit to Lead Conversion Rate: This measures the percent of people whose website visit becomes a new lead for sales.
Lead to Customer Conversion Rate: This measures the percent of people moving from leads to customers. This metric helps determine if your campaigns are generating sales-ready leads.
Visit to Customer Conversion Rate: This is the overall funnel: whether your traffic generated turns into customers.
Content Marketing Metrics Template
Use each of the above five categories to record metrics for reporting with this template. It provides a space for each metric and ready-made graphs to add to your marketing deck so you can present your success. Fill out the reach, visits, leads, and customers templates, and your conversion rates template will automatically fill from your data.
Download Content Marketing Metrics Template
Website ROI Analyses and Template
Google Analytics 4 (GA4) can help you determine the financial value of your content so you can calculate ROI. Use GA4 to track the URLs from all your web materials, such as your website, Facebook, newsletters, and any other sources. You can track who comes to your site and the path they took to get there. For example, you can get a count of how many times someone accessed your site from a Facebook post, or how many times your content was downloaded from your site.
To set up Google Analytics 4, start by either signing in or creating an Analytics account. Set up your GA4 property, add a data stream and install your Google Analytics with Google Tag Manager. Here’s how to set up Google Analytics 4:
Create an Analytics account, unless you already have one.
Create a Google Analytics 4 Property:
Go to the Admin section of your Google Analytics 4 interface and then click Create Property.
Enter the name of your property, choose your company’s country, reporting time zone, and the main currency your business operates.
Press Next, and answer several questions.
Then select your business objectives.
Click Create.
Configure your first Data Stream:
In Admin, in the desired Property column, click Data Streams > Add stream.
Click iOS app, Android app, or Web. In this article we focus on the Web stream.
For the Web, enter the URL of your website (the protocol https is already selected) and enter the name of your website.
You have the option to enable or disable Enhanced Measurement feature. By default it is enabled, but you can disable it if you want.
Press the Create Stream button.
Install Google Analytics 4 with Google Tag Manager (GTM):
Install GTM on your site.
After that, go to GA4 > Admin > Data Streams, select your Web data stream, and copy the Measurement ID.
Go to your Google Tag Manager container > Tags > New and choose Google Analytics: GA4 Configuration.
In the Measurement ID field, enter the Measurement ID you copied in the GA4 interface.
In the Triggering section, select Initialization – All Pages.
Name the tag and save it.
Test the GA4 installation:
Click Preview in the top right corner of the GTM interface.
Once you enable the preview mode, you should see the new GA4 tag among the tags that fired. If your tag didn't fire, check your tag's trigger settings.
Publish your changes in GTM by clicking the Submit button in the top right corner and then completing all the other steps that the user interface asks you to do.
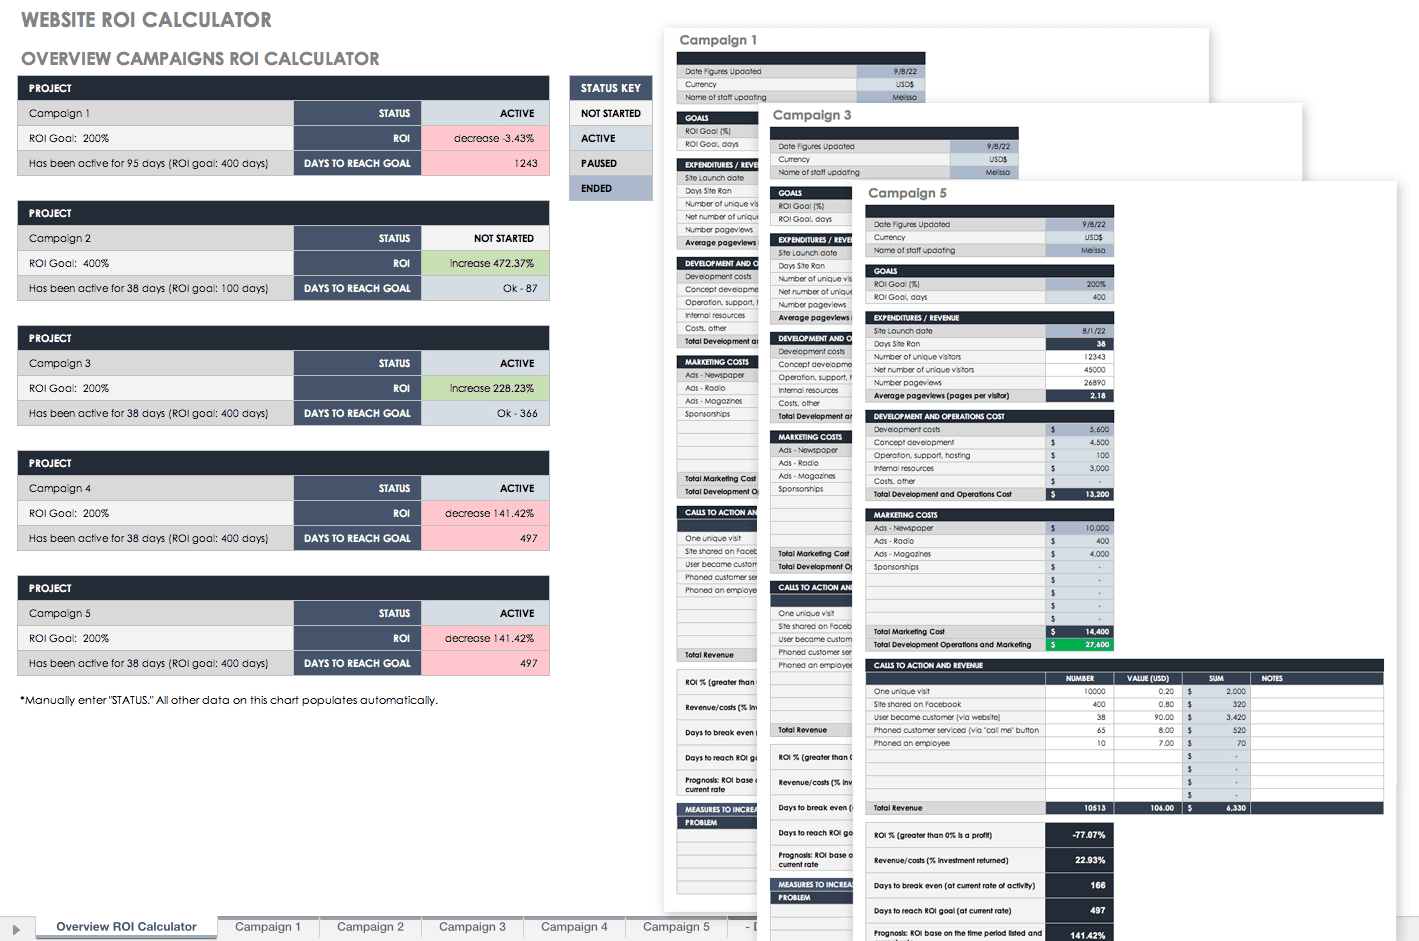
Website ROI Calculator Template
You can add Goals in your analytics page to determine how well your pages are performing. Import the information from your website or app into this website ROI calculator to determine the ROI for your web-based traffic. You’ll find a full website campaign overview in a roll-up sheet, which tells you which campaigns are the most successful so you can compare them.
Download Website ROI Calculator - Excel
In this calculator template, you will find spreadsheets for each of your campaigns. The inputs for each campaign are as follows:
Date figures updated
Currency
Name of staff updating
ROI goal (percent)
ROI goal (days)
Site launch date
Number of unique visitors
Net number of unique visitors
Number pageviews
Development costs
Concept development
Operation, support, hosting
Internal resources
Other costs
Marketing costs
Calls to action and revenue
From these inputs, the following are your outputs:
Days site ran
Average pageviews (pages per visitor)
Total development and operations cost
Total marketing cost
Total development operations and marketing
Total revenue
ROI percent (greater than 0 percent is a profit)
Revenue/costs (percent investment returned)
Days to break even (at the current rate of activity)
Days to reach ROI goal (at current rate)
Prognosis: ROI based on the time period listed and the current rate
Another way to figure out the revenue from your web content is to look at your online sales. Each time you sell products on your website, you can use your digital content to push customers to your sales pages. Each time you post a blog article, there should be links your customers can follow to reach your products. From these page visits, look at the revenue earned over the period and the number of visits from your content.
There are other programs you can use to manage your social media and marketing content that you can purchase as well. Some of these plug into your existing software to make your reporting easier. It’s worth reviewing their features and ease of use for your company if your revenue is dependent on your social marketing content. Some of these apps include Hootsuite, Hubspot, Buzzsumo, and Quintly.
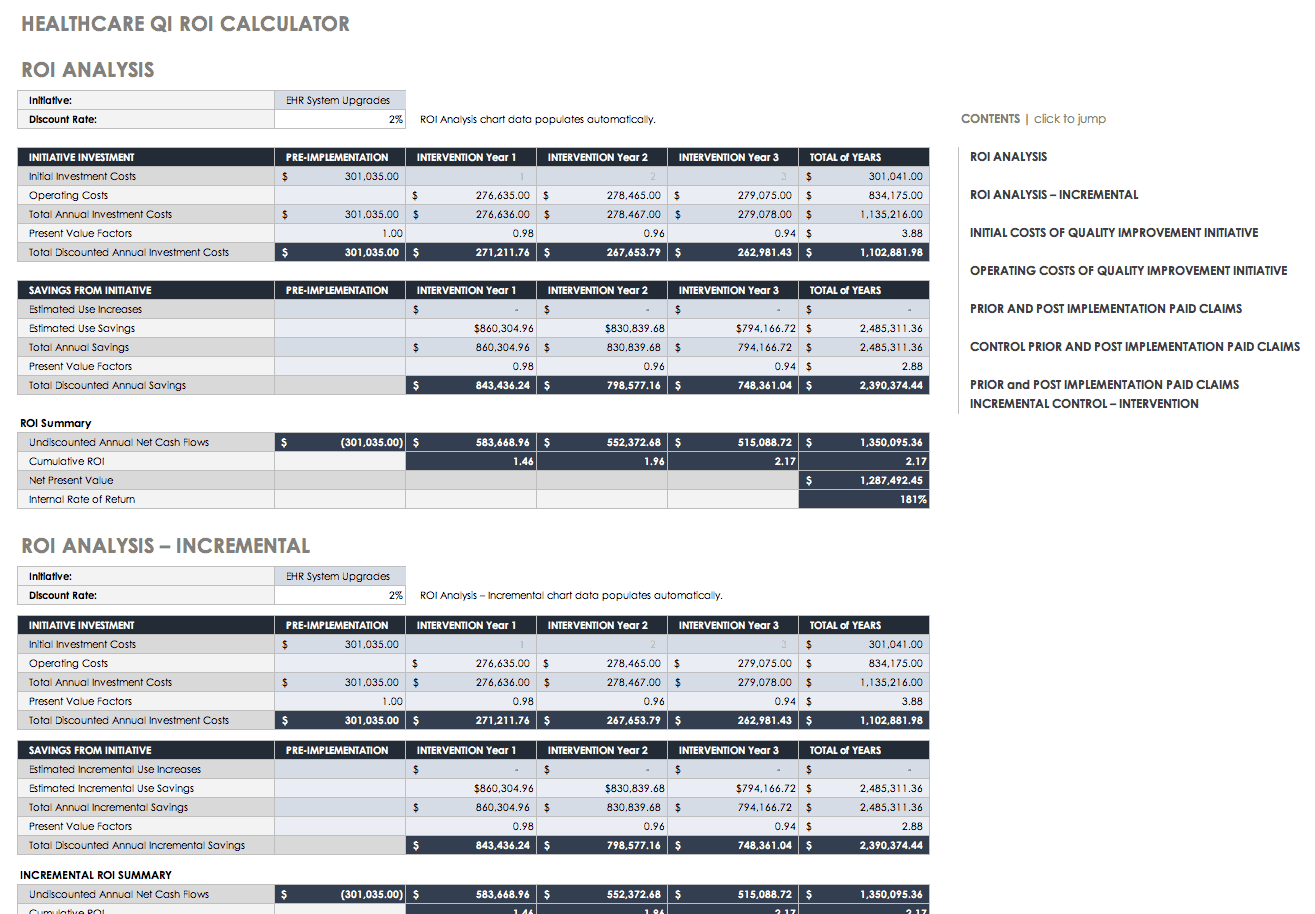
Healthcare Quality Initiative ROI Templates
With the cost of health care skyrocketing, state-sponsored and private health plans should be able to prove their ROI to measure the effect of their quality improvement initiatives. These seven worksheets can help you prove the ROI of your quality improvement initiative:
Initial Costs: In this template, the costs of the personnel involved in the initiative are laid out, as well as any additional costs such as supplies, contracted services, and equipment. The total costs of the initial investment are calculated. This is Year 1 costs.
Operating Costs: This spreadsheet template pulls data from your initial costs spreadsheet for Year 1 and allows you to add data for consecutive years of your initiative. You can add and adjust for additional staff and known costs, and then the worksheet calculates the total costs for each year.
Claims-Intervention: Data from claims is used to estimate savings per year. Inputs for this spreadsheet include the actual payments from each claim category and the estimated savings by claim category for each year, the monthly membership for the initiative, and the number of months in the year the initiative was operational.
Claims-Control: Data from a control group of claims (without the intervention) shows a difference in the intervention versus changes that are an artifact of other reasons. It is important to maintain a control group to show that improvements come from your initiative and not from other or natural progressions.
Claims-Incremental: This spreadsheet compiles data from your claims-control and claims-intervention spreadsheets to determine your savings, and whether these savings are relevant to your quality initiative.
ROI: This spreadsheet automatically compiles data from your other spreadsheets and calculates the total discounted annual investment costs, the total discounted annual savings, and the ROI summary, which includes undiscounted annual net cash flows, cumulative ROI, net present value, and internal rate of return.
ROI-Incremental: Like the ROI spreadsheet, this template calculates the savings and ROI summary, but for incremental data.
Project ROI Templates
There are many projects that require you to calculate ROI. Some of these may be due to technology or software system changes that can get extremely expensive, so being able to report ROI to your stakeholders becomes critical.
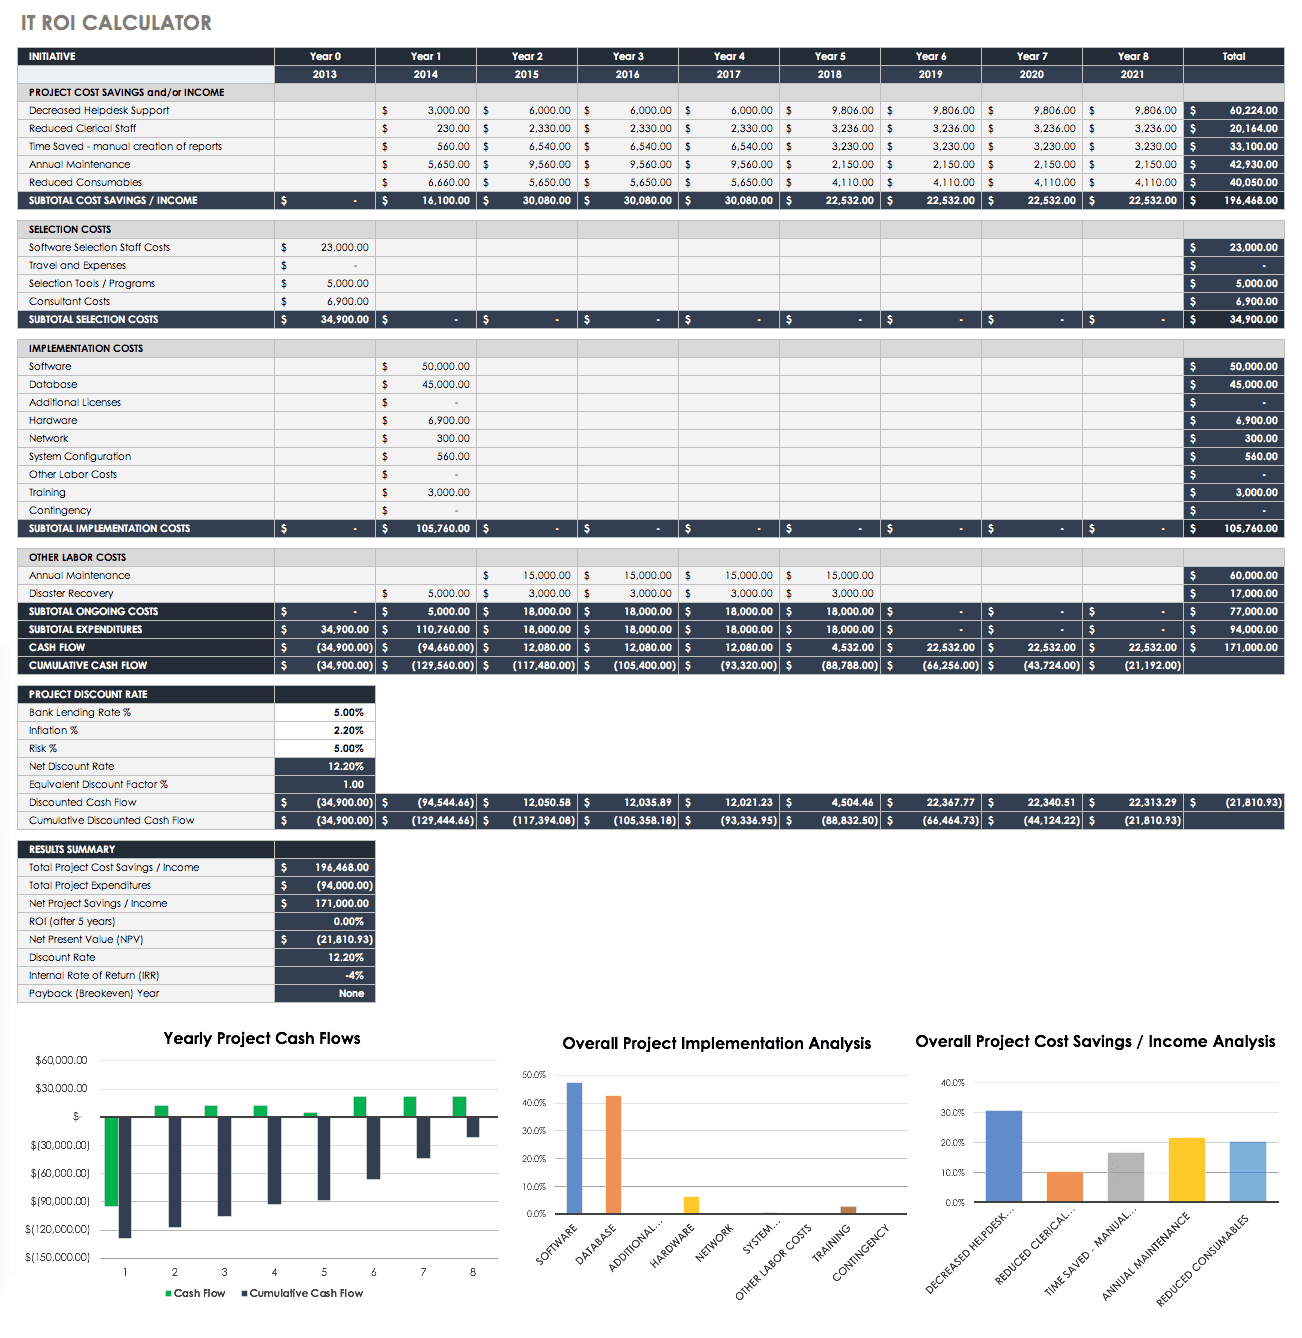
IT ROI Calculator Template
The following is an IT ROI calculator for any basic IT initiative or project. This calculator provides columns to include data for up to eight years, but you can add more years as columns. Inputs include the following:
Cost savings by year
Selection costs
Implementation costs
Ongoing costs
Project discount rates
The outputs from this include subtotals of each, cash flow, cumulative cash flow, and results. The results include the following:
Total project cost savings/income
Total project expenditures
Net project savings/income
ROI (after five years)
Net present value (NPV)
Discount rate
Internal rate of return (IRR)
Payback (breakeven) year
For ease of reporting, charts have been included that automatically show yearly project cash flows, overall project implementation analysis, and overall project cost savings/income analysis.
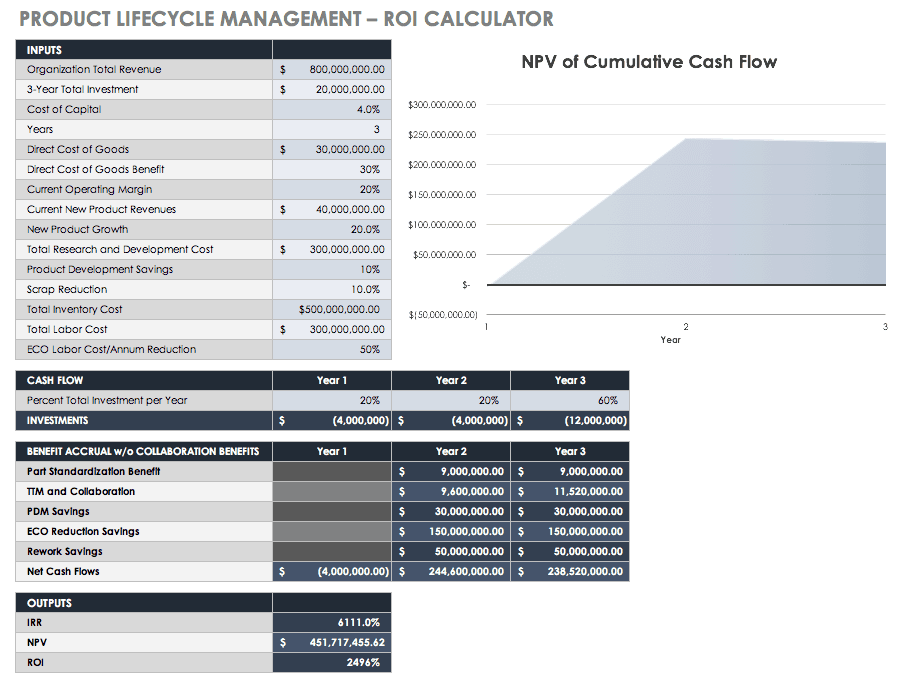
ROI Calculator for Product Lifecycle Management (PLM) Systems
Another software ROI calculator is for product lifecycle management (PLM) systems. Inputs for this calculator include the following:
Organization total revenue
Three-year total investment
Cost of capital
Years
Direct cost of goods
Direct cost of goods benefit
Current operating margin
Current new product revenues
New product growth
Total research and development cost
Product development savings
Scrap reduction
Total inventory cost
Total labor cost
ECO labor cost/annum reduction
Percent total investment per year
Outputs from this calculator include the following:
Yearly:
Investment amounts
Part standardization benefit
TTM and collaboration
PDM savings
ECO reduction savings
Rework savings
Net cash flows
Overall:
IRR
NPV
ROI
Use the diagram that visually shows the NPV of cumulative cash flow to update your stakeholders.
Download ROI Calculator for Product Lifecycle Management (PLM) Systems
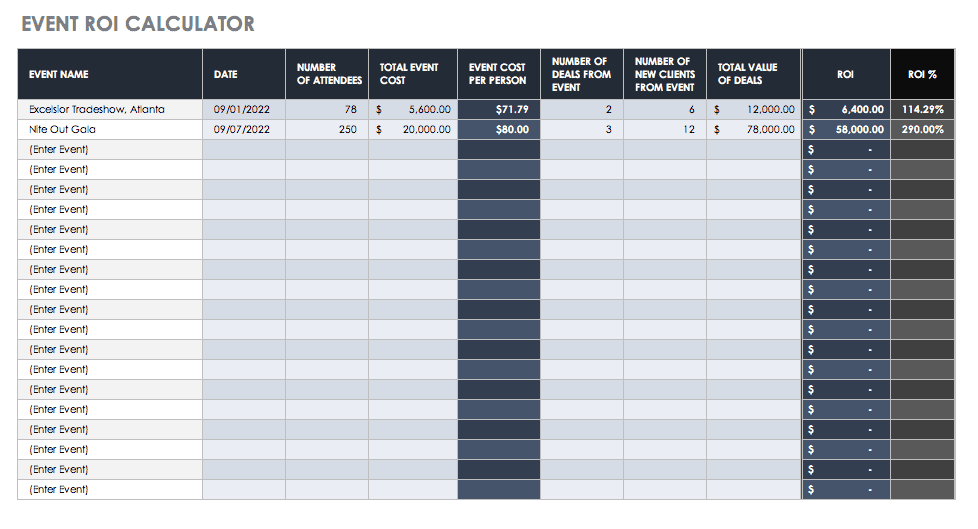
Business Case and Event ROI Template
Building a business case helps your team or company justify the funding in any proposal. This is the expected benefit from any undertaking, whether you are making a case for replacing old equipment or starting a fresh marketing program. Using ROI and other cash flow metrics are an excellent method to help you build your business case — especially in the case of technology investments where financial managers can identify expected costs and benefits to calculate ROI. For example, you may want to make a business case for an event your company is considering hosting. Based on the ROI of past events, you can give your company information on what level of event is relevant for their goals. For example, you can make a case for a large formal event rather than a small less-costly cocktail party if the ROIs are markedly different, and the large event generates more customers. Use this simple event ROI calculator template to discover what ROI your past events yielded by inputting the number of attendees, costs, and deal information. The outputs then give the event cost per person, the ROI, and the ROI percent.
Justification and Total Cost of Ownership ROI Template
In the same vein as proving a business case, a business plan must have some type of economic justification to provide stakeholders with the knowledge that they are making sound policy and finance decisions. ROI is an appropriate choice, although it does not consider the intangible or fuzzy costs and the benefits that a cost-benefit analysis (CBA) might reveal. However, since those measures are fuzzy, they may not accurately represent the data anyway.
Total cost of ownership (TCO) helps assess costs across an enterprise for products or systems. Mainly used in IT, TCO generally includes not only the hardware and software, but the acquisition, management, support, expenses, training, and any other productivity losses to be expected during implementation. This calculation is made using data over a number of years, so you can present the TCO lifecycle. TCOs can be used to comprehensively justify new software purchases — especially since they are generally such expensive prospects. TCO is the negative data in an ROI equation that shows what you are spending.
Additionally, many professionals interested in TCO also want cost avoidance data, or the positive data in an ROI equation. For example, with both TCO and cost avoidance, you can calculate the ROI of replacing a software system that performs some function that saves you money.
Use this template for such a scenario, where the TCO of a software system (such as a virtual briefing platform) and the cost avoidance of a virtual briefing are combined to discover ROI. You can also use the template independently to determine either TCO or cost avoidance. In this template, you will find space to input your direct and indirect costs across several years. Inputs include costs for the following:
Hardware
Software
Management
Support
Implementation
Programmatic work
There is also space to enter cost avoidance data. The following are calculated from the input data:
Total cost of ownership/year
Total substitution cost avoidance
ROI
ROI percent
ROI/year
Total potential cost avoidance
Potential ROI
Potential ROI percent
Potential ROI/year

Download Justification and Total Cost of Ownership ROI- Template – Excel
Simple ROI Templates
An ROI analysis can vary in the levels of its complexity. Regardless of the amount of data, the basic ROI formula details three steps:
Estimate the Cost: Costs may be hard or soft, depending on the project or event planned. Hard costs are simple and are anything that comes with a receipt, such as travel costs, registration fees, and entertaining costs. Each of these can be a line item when you build or use an ROI calculator. Soft costs are more complex since they can include the number of hours spent on preparing, attending, and following-up after the event. This can also include the time spent corresponding, researching, and traveling. Multiply these “soft” hours by the employees’ hourly rate from their base pay to calculate the soft cost. Combine the hard and soft costs for a better representation of the cost estimate.
Estimate the Return: First, define your success metric. For a conference-type event, this may vary, but consider the type of event and your company’s function in the marketplace. Your team should help you define your success metrics. Defining success metrics is part art, part science. If the metrics are developed, they should align with your strategic plan and your key performance indicators (KPIs).
Compute ROI: Calculate ROI by dividing the activity return by its cost. Below is another formula you may follow:
ROI = (Gain from investment – Cost of investment) / (Cost of investment)
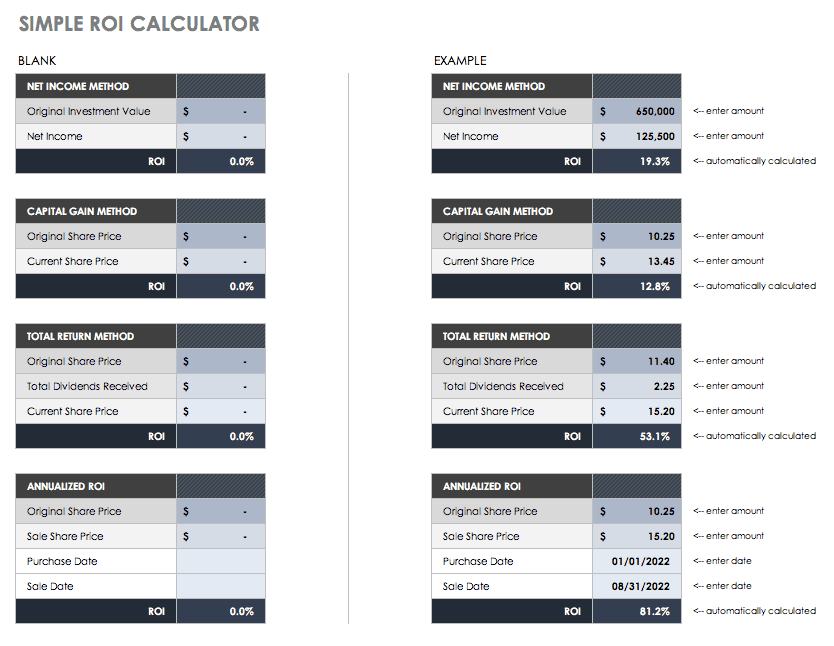
Simple ROI Calculator Excel Template
The attached simple ROI calculator is an Excel template. ROI may be calculated in Excel, but there is no specific formula for it — it simply displays inputs and outputs to help you come up with the final number. In this template, you will find four different methods to calculate ROI. But, you will always need to enter either your original investment value or share price.
Download Simple ROI Calculator Template
The four methods in the above template include net income method, capital gain method, total return method, and the annualized method:
Net Income Method: Divide net profit by total assets. Enter your original investment value and its net income, which is what was earned less the taxes and deductions.
Capital Gain Method: Subtract your cost base from your capital proceeds. Enter your original share price and the current share price.
Total Return Method: The actual rate of return on an investment over a period of time, including capital gains, interest, and any dividends. Enter the original share price, your dividends, and the current share price.
Annualized Method: This is the geometric average amount earned every year over a given time. It is geometric to show compounding. Enter the original share price, the sale share price, when you purchased the share(s), and when you sold them.
What Is a Return on Investment (ROI)?
Companies use ROI to gauge the profits from any type of investment, whether time, money, or energy. Return on investment (ROI) is a performance measure that can be calculated in simple cases through a formula or in more complex cases via a template with multiple formulas. Calculations occur when you input what is spent versus what is earned. It can also be an investment view of a company’s cash flow via an action they took. In other words, the benefit of an investment is divided by the cost to see if it was worth making. ROI has many interpretations, depending on the business industry. For many businesses, ROI is simply the measurement of financial gain or loss relative to the costs such as deductions, fees, labor, or resources.
In project management, ROI helps businesses determine whether they want to invest in specific projects, and in the case of several projects, to decide between them. In the case of long-term projects, businesses must take into account inflation and future income to accurately calculate ROI. In the case of some quality projects, the ROI may be difficult to calculate because it’s hard to turn non-quantifiable data such as ideas and good feelings into monetary values. For example, spending money to put in a new breakroom may make your employees happier and feel more positive towards their environment. However, it’s difficult to calculate the revenue of a new break room.
ROI is used as a concept and a specific formula. As a concept, it can measure profitability or efficiency. People refer to ROI when discussing what they get back for their input. However, ROI is a true metric that can be calculated as a ratio or percentage. The basic formula to calculate ROI is:
ROI = Net Profit / Total Investment *100
You would use ROI for several reasons:
Provide Quantifiable Value: ROI provides leaders with information about a project’s worth, and can help garner their support by removing uncertainty and subjective benefits.
Build Stakeholder Support: When a project is up for decision (whether or not it gets approved), calculating the ROI gives stakeholders the information they need to either provide or deny their support.
Show Additional Benefits: Calculating ROI becomes a forcing function for staff to determine benefits they may not have considered at the start of a project.
Prioritize Projects: Many companies use ROI as a metric to rank their projects.
However, ROI modeling has some limitations. Some models do not adequately factor in accurate-enough costs and returns. Soft, or intangible, costs are difficult to assess. Another issue is that the costs and returns of a project may not match predictions. Finally, some ROI models may not give more than a financial measure of a project, giving stakeholders an inadequate measure of return or making the project’s actual return misunderstood.
There is more than one way to model ROI, and different analysts can model differently, possibly mischaracterizing the outcome. Therefore, stakeholders and business leaders should ask not only the ROI of a project but how it was modeled. The effects that a project has on more than just the business are sometimes left out. For example, social return on investment (SROI) is a modern metric that considers social, economic, and environmental outcomes in projects. SROI uses impact mapping, which is a strategic planning technique.
The ROI Formula
ROI is calculated by subtracting the project cost from the financial value. Financial value is what the project pays you back, but occasionally there is uncertainty in assigning monetary values to outcomes. To do so, break the values into known components and define them. These components usually include time, volume, and dollars for both the present and the project, such as this formula:
Financial value = TVD present – TVD project
T = time
V = volume, quantity of units
D = dollars/cost
Present = the current value
Project = the value of a successful project
One example of using this formula considers a project that decreases the production cycle by 20 percent. The team calculated that the production cost of their product was $5,000. The time to produce one unit was 10 hours, with a $90/hour wage and $41,00 worth of materials. For the production of 500 of these units, the product line cost was $2.5 million.
The project decreased the production cycle time by 20 percent, from 10 hours to eight hours, while keeping the remaining costs the same. The new production cost is $4,820 per unit and $2.41 million for the yearly product line. Therefore, using the formula above, the project's financial value is:
Financial value = $2,500,000 - $2,410,000 = $90,000 in annual savings
The project cost is the second component of the ROI formula. There are two main variables that compose project cost: work decomposition over time and cost of the work. The work decomposition over time breaks down the work or tasks into the most granular level possible, and in best practice by chronological order. In project management, this may also be known as the work breakdown structure (WBS). Here’s an example:
Insert Chart Here
For more information about WBS, see “Getting Started with Work Breakdown Structures (WBS).”
The costs of the required work need the practitioner to consider certain factors when they allot costs. Even these factors they can vary widely, they can include the following:
Any rentals/leases
Resources, such as workers
Wage rates
Hours to complete the work
Capital costs (hardware/software)
Once you have these costs defined, you can add them to your WBS, such as in the following example:
Insert Chart Here
Some other methods of breaking down work include the following:
Gantt Charts: These are the WBS over time, and put your tasks into phases of work. To create your own, see “How to Create a Gantt Chart in Excel.”
Process Maps or Process Flow Diagrams: These show the project work as workflow steps. This is a visual representation of your work. For more information on process maps, see “Essential Guide to Business Process Mapping.”
These are all helpful tools to cost out your projects, but practitioners should also consider the following:
One-time Costs Versus Costs Over Time: Some equipment may be a one-time purchase or a rental over years. Include those costs over the period to get accurate ROI figures.
Consider What the Opportunity Cost May Be: When you have more than one project to compare, there may be savings you can attribute back to your company. Remember that the opportunity to perform the project may have value.
Estimate Liberally: Whenever there is a gray area for cost estimation, estimate higher. Cost overruns delay projects and erode confidence.
Once you have calculated all the financial values and project costs, the ROI formula is simple. Let’s assume in the following example that there is a one-time cost of $400,000 for our project to decrease the production time by 20 percent. In this example, Year 5 breaks even, and as the company goes forward, there is an appreciable saving:
Insert Chart Here
ROI and Returns-Based Analysis
Another calculation that is important in a discussion of ROI is returns-based analysis. The financial industry performs style analyses when they are trying to determine the type of investment behavior either an investor or a money manager is using. Two distinct types of styles are holdings-based and returns-based. Returns-based is more widely used by financial professionals because monthly input data is readily available. The returns-based analysis compares three to five years of a portfolio’s monthly returns to the total returns of various style-based indexes. Inferences can be made about how closely the portfolio resembles the different indexes. In other words, a fund manager or investor professes that they will invest in a certain manner. A returns-based analysis is a model that shows if they have done so. Although not directly calculating ROI, a returns-based analysis can help determine whether your investment manager is worth their cost.
Make Better ROI Decisions, Faster with Charts in Smartsheet
Empower your people to go above and beyond with a flexible platform designed to match the needs of your team — and adapt as those needs change.
The Smartsheet platform makes it easy to plan, capture, manage, and report on work from anywhere, helping your team be more effective and get more done. Report on key metrics and get real-time visibility into work as it happens with roll-up reports, dashboards, and automated workflows built to keep your team connected and informed.
When teams have clarity into the work getting done, there’s no telling how much more they can accomplish in the same amount of time. Try Smartsheet for free, today.