Basic Email Marketing Report Template
Download a Sample Basic Email Marketing Report Template for
Excel
| Google Sheets
Download a Blank Basic Email Marketing Report Template for
Excel
| Google Sheets
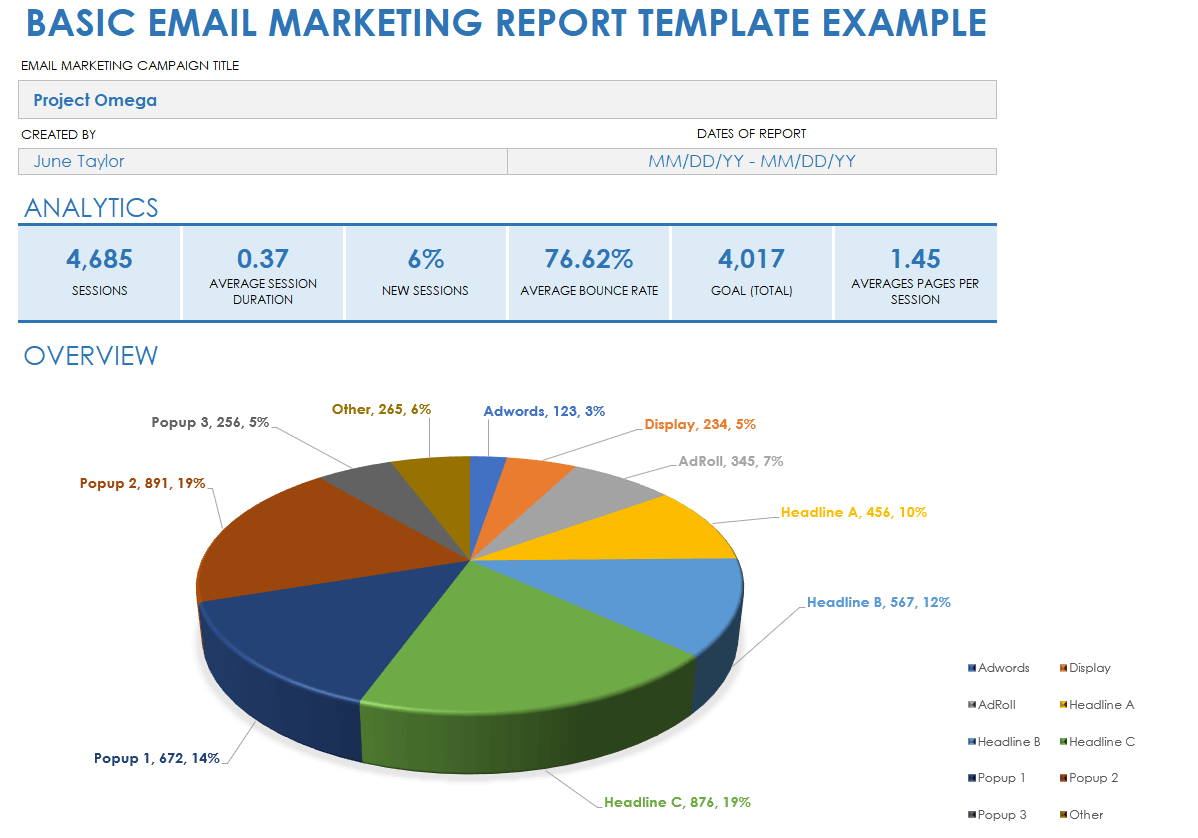
Use this basic email marketing report template with or without sample copy to analyze and present key email campaign-related data to stakeholders. Input your collected email data for the template’s KPIs, such as sessions, average session duration, percentage new sessions, bounce rate, and goal completions. By focusing on the KPIs that this template offers, your team can optimize user engagement, minimize bounce rates, and enhance goal completion.
For helpful automated email workflows to help spark ideas for your upcoming email marketing campaigns, read this article on automated email workflows with examples and best practices.
Revolutionize your marketing approach
From campaign planning to content calendars, Smartsheet helps marketers stay aligned, hit deadlines, and prove impact.
While traditional spreadsheets can track basic tasks, they fall short when it comes to real marketing execution. Smartsheet is purpose-built for marketing teams, combining the flexibility of a spreadsheet with powerful tools like automated reminders, content approvals, calendars, dashboards, and more.
Start your free trial today and see how much more you can do with Smartsheet.
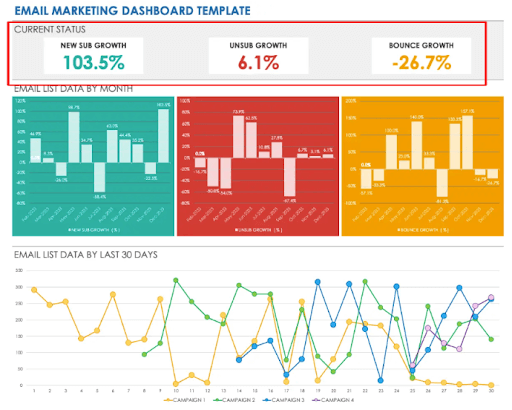
Email Marketing Dashboard Report Template
Download a Sample Email Marketing Dashboard Report Template for
Excel
| Google Sheets
Download a Blank Email Marketing Dashboard Report Template for
Excel
| Google Sheets
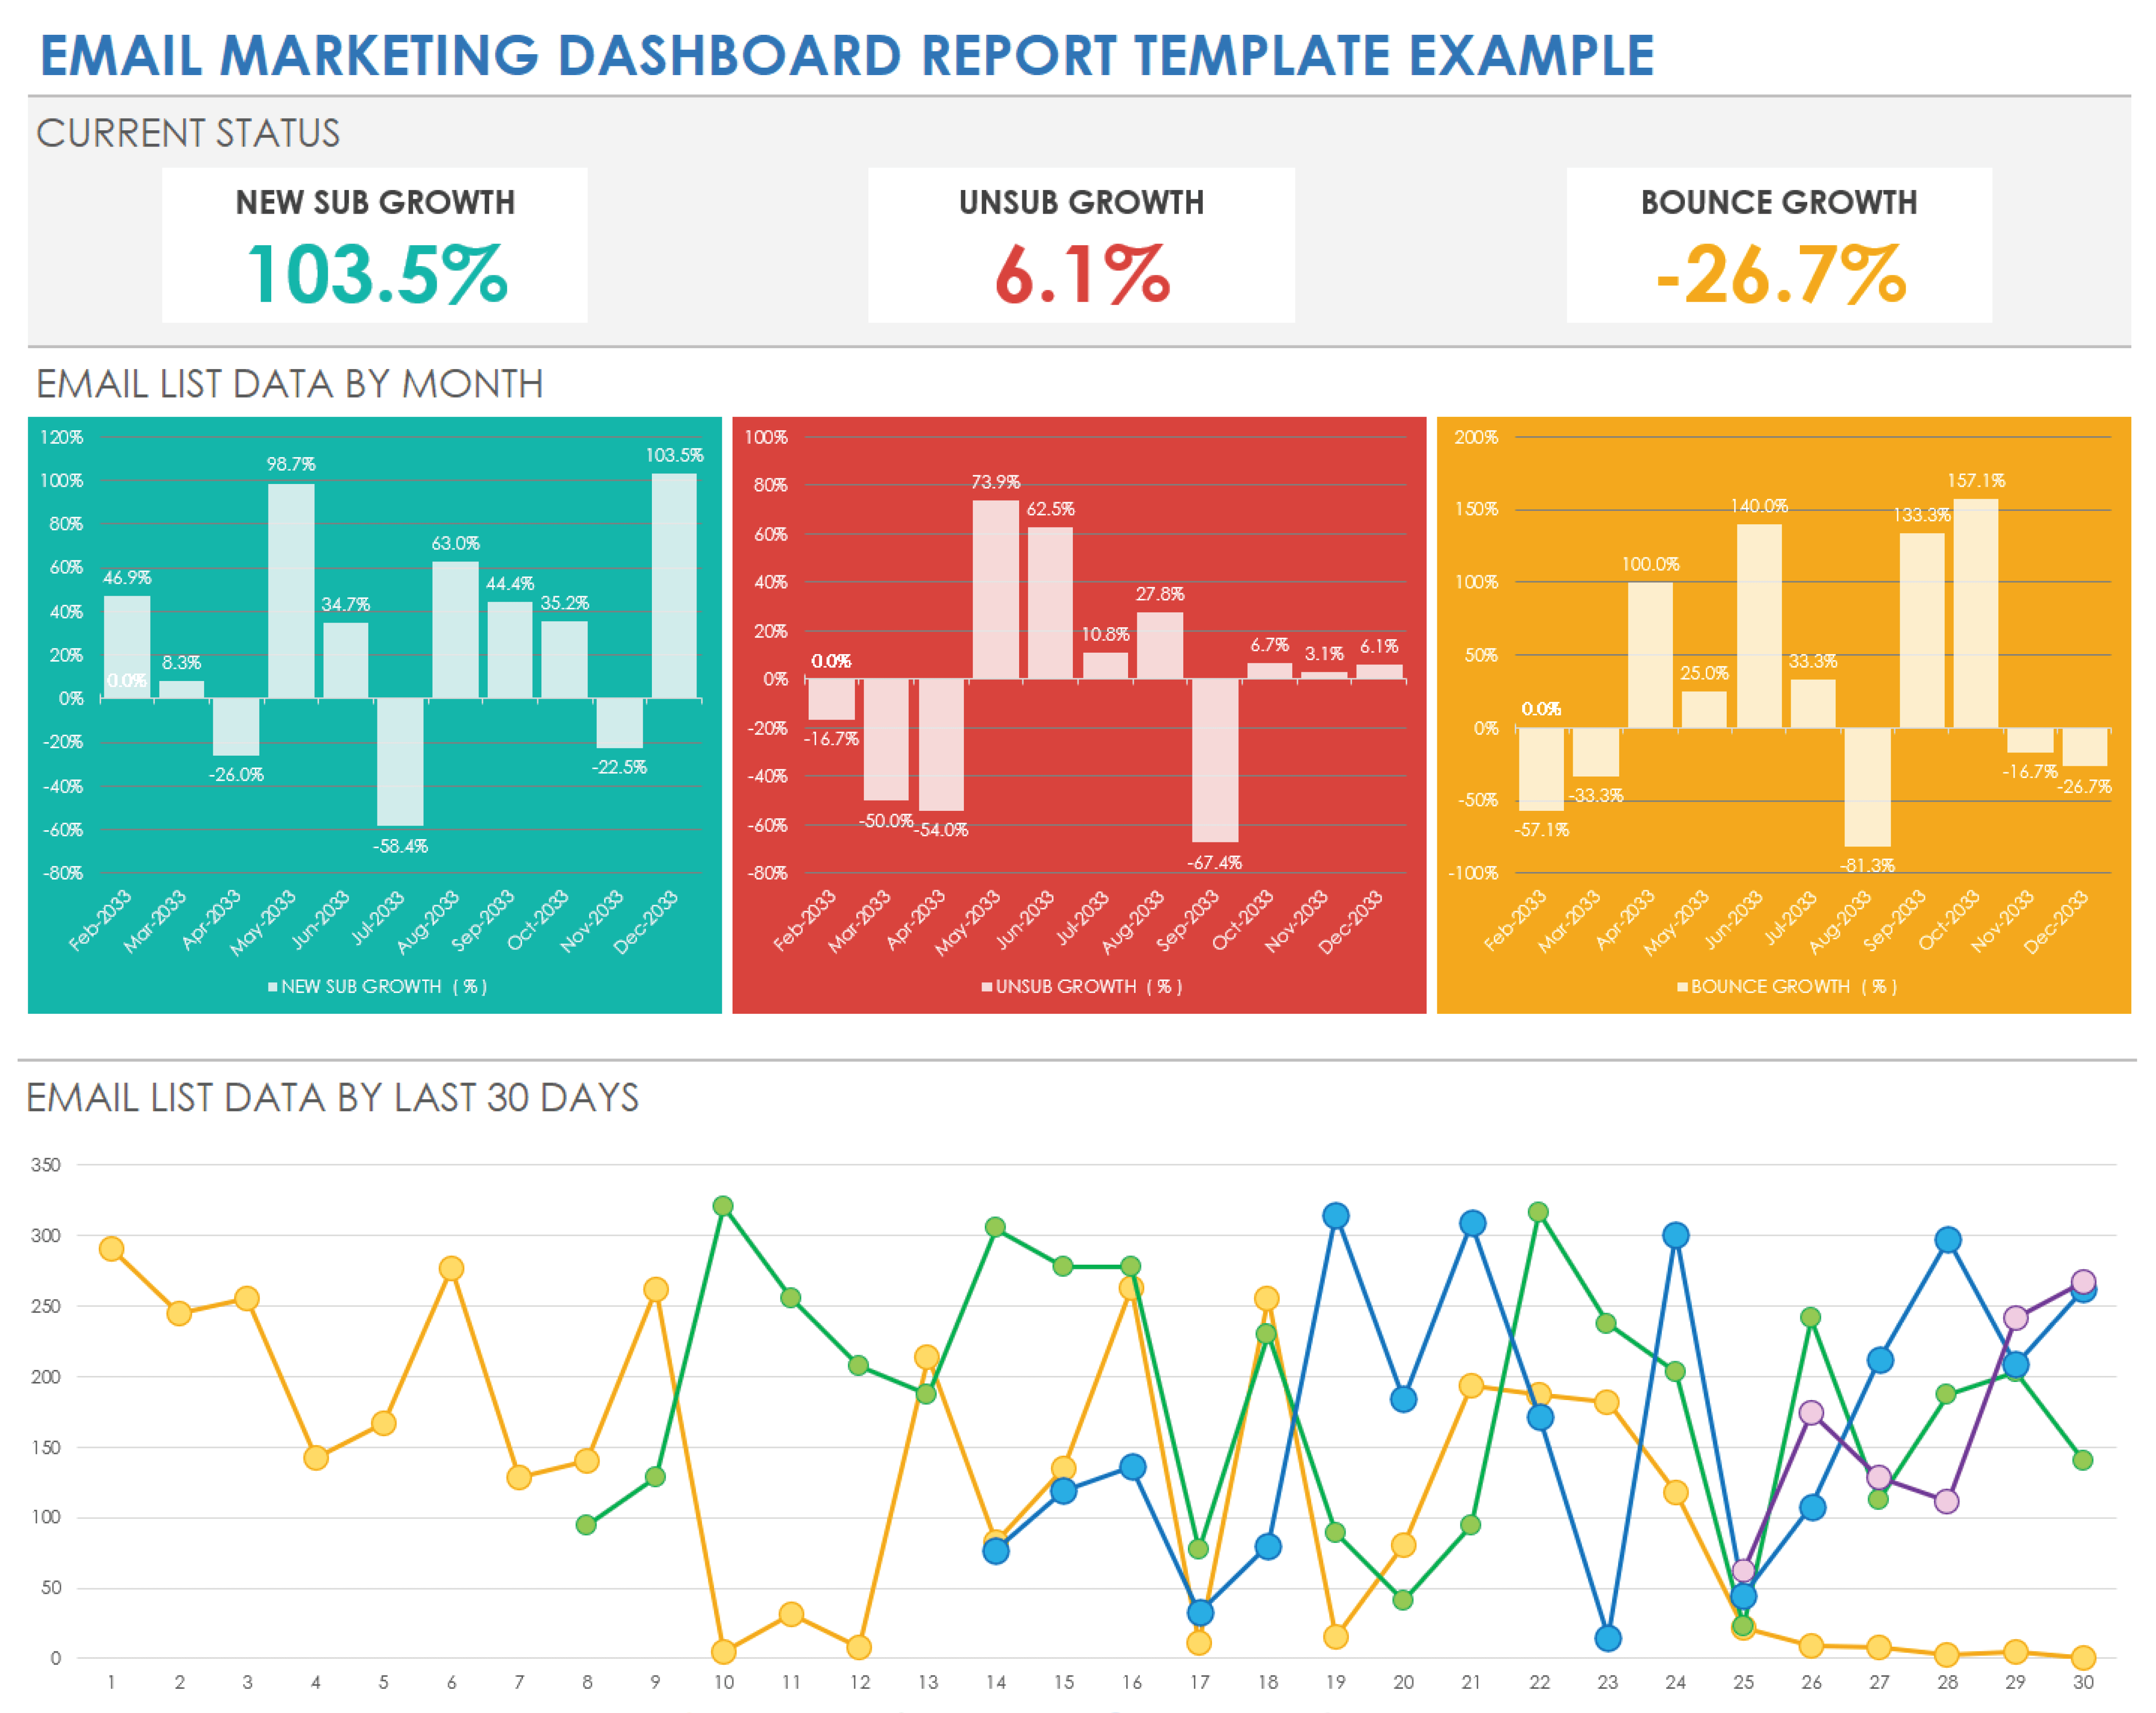
Gain quick, visual insights into email marketing campaign performance with this visually dynamic email marketing report dashboard template available with or without sample text. To use it, input the relevant data for each campaign regarding new subscriber growth, unsubscribe growth, and bounce growth, and the template will populate the dashboard automatically. This visual representation allows your team to swiftly identify trends and areas needing attention, while also managing bounce rates.
Check out this article on free marketing dashboard templates that can help you consolidate and visualize crucial marketing metrics.
PowerPoint Email Marketing Analytics Report Template
Download the Email Marketing Analytics Report Template for PowerPoint
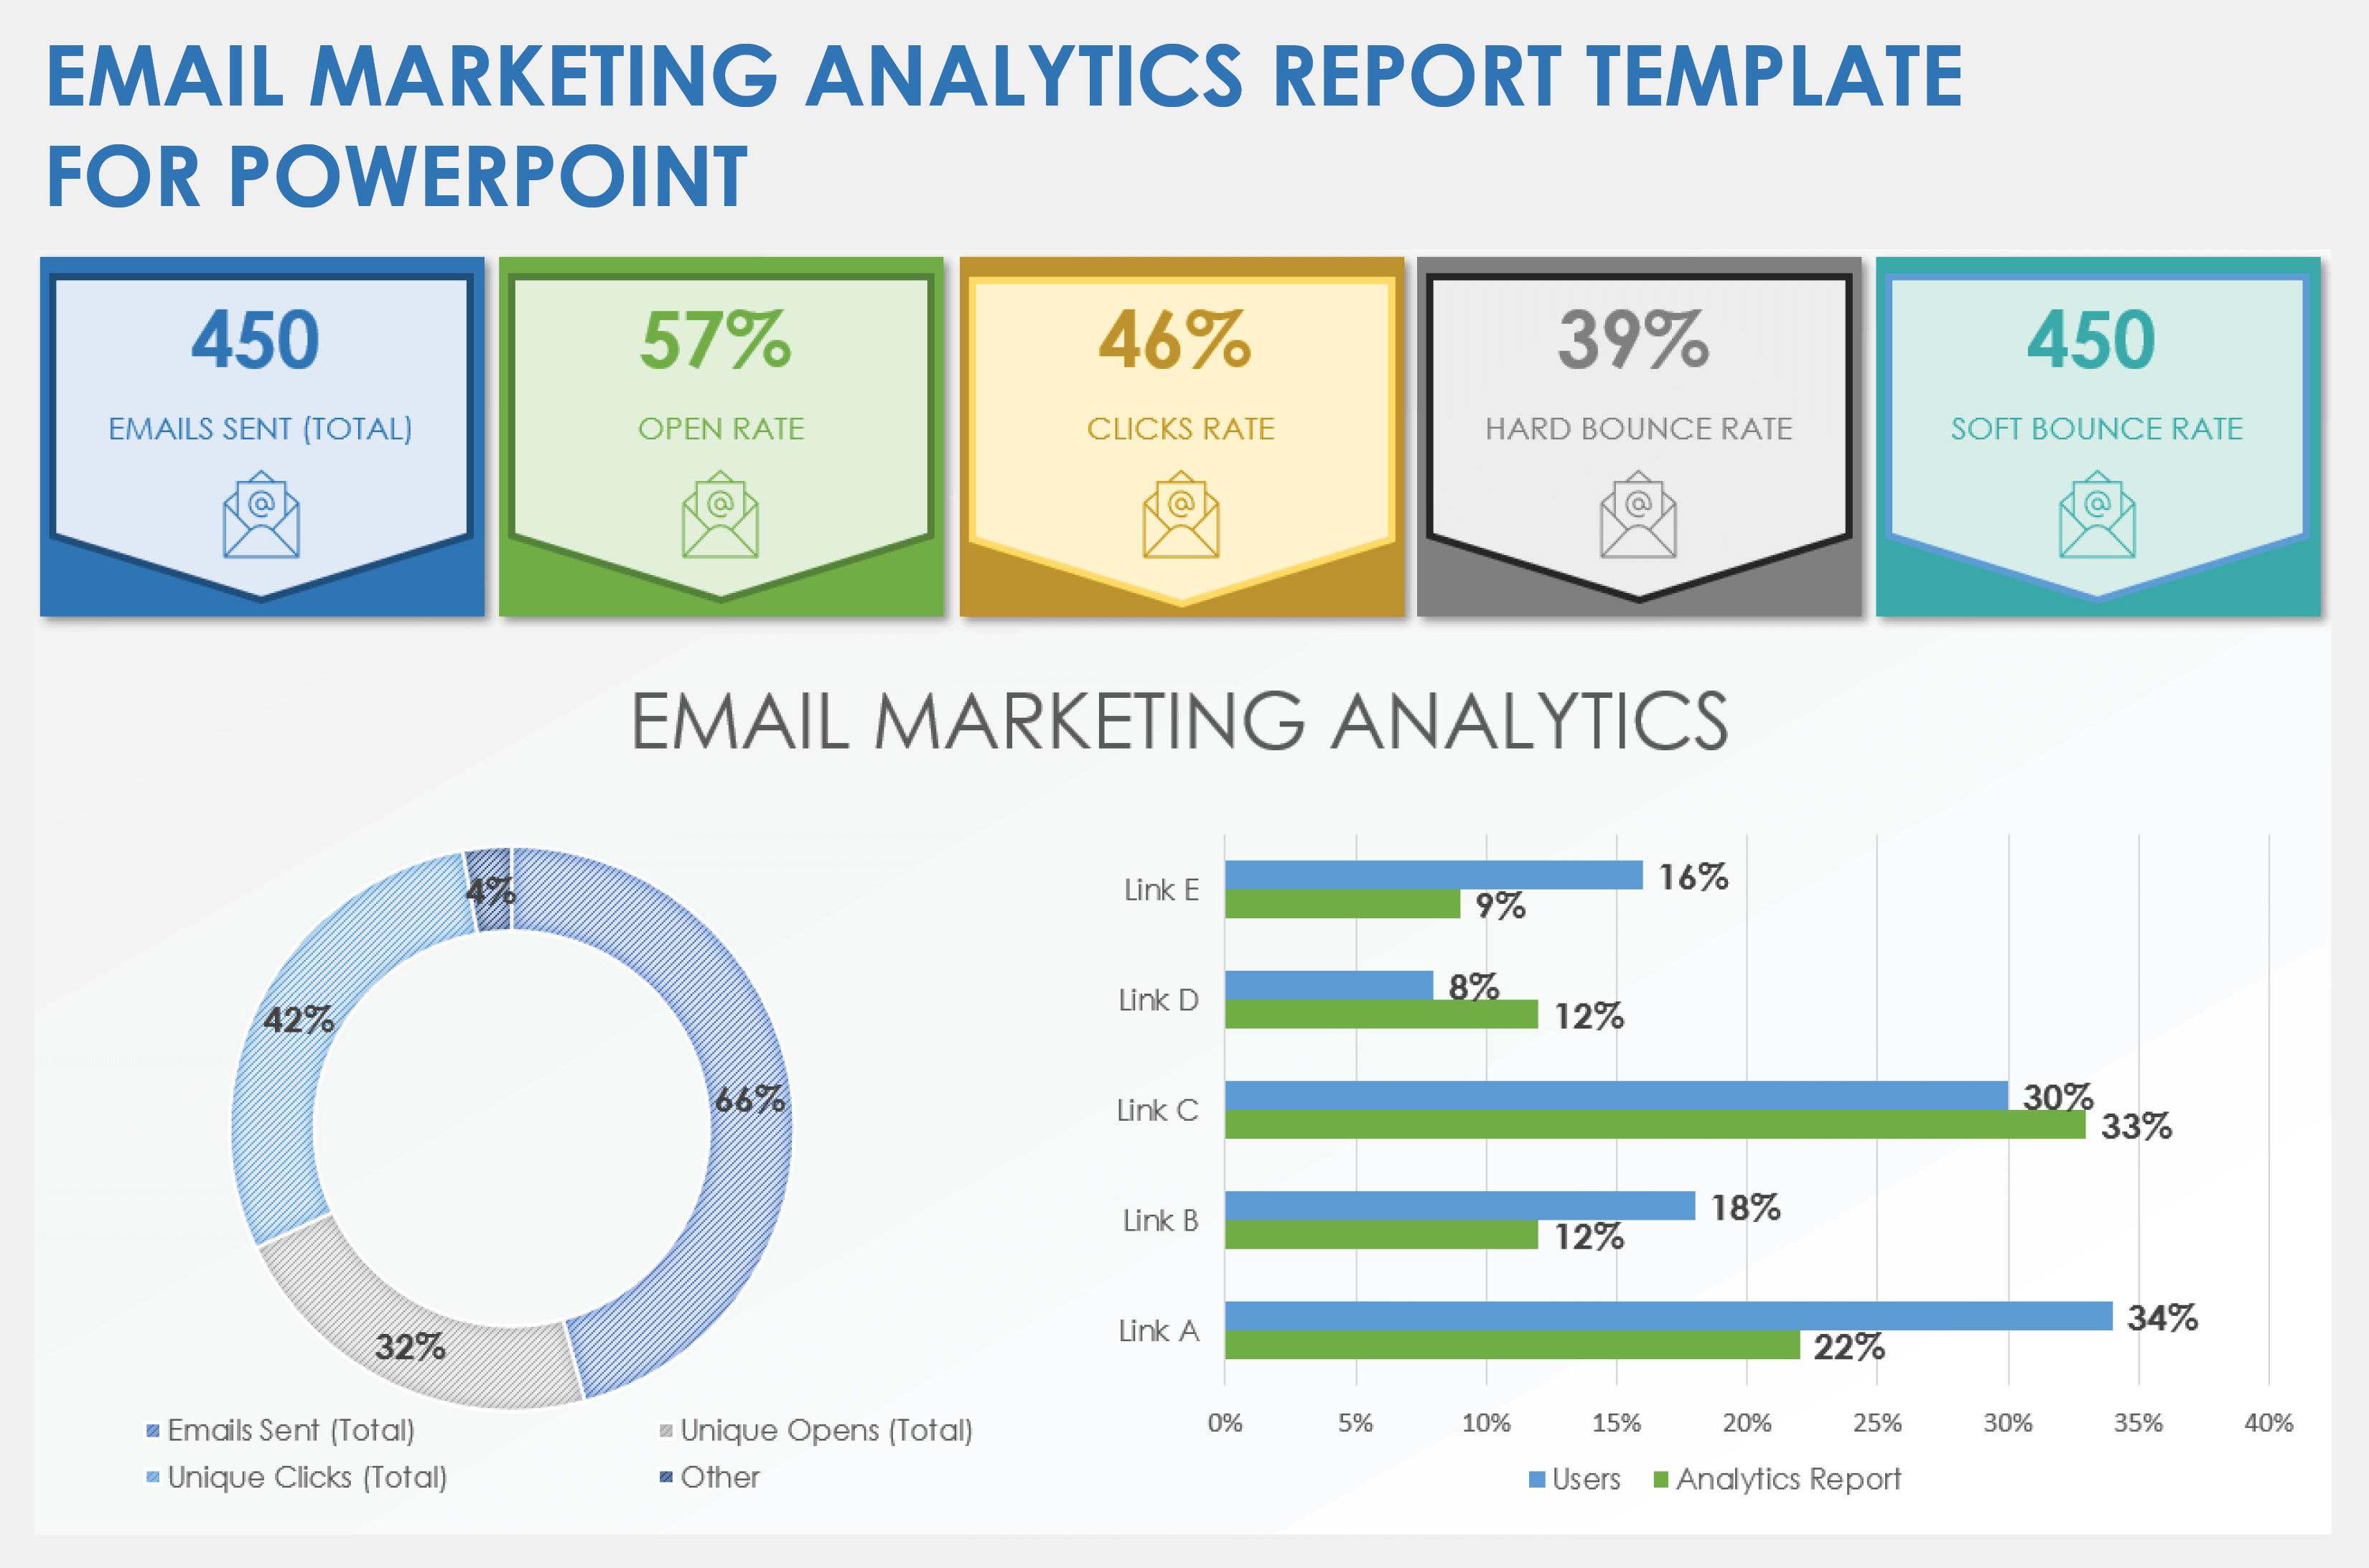
This completely customizable email marketing analytics report template for PowerPoint offers the flexibility to tailor presentations to your specific email-marketing-reporting needs and objectives. To use the template, populate it with your campaign data, including total emails sent, open rate, campaign click rate, hard bounce rate, and soft bounce rate. By tracking and analyzing these particular metrics, your team can gain insights into recipient engagement and delivery issues.
For resources and templates to help you conquer inbox overload with email management best practices, check out this roundup article with best tips and suggestions for email management.
Email Metrics Report Template
Download an Email Metrics Report Template for
Excel
|
PowerPoint
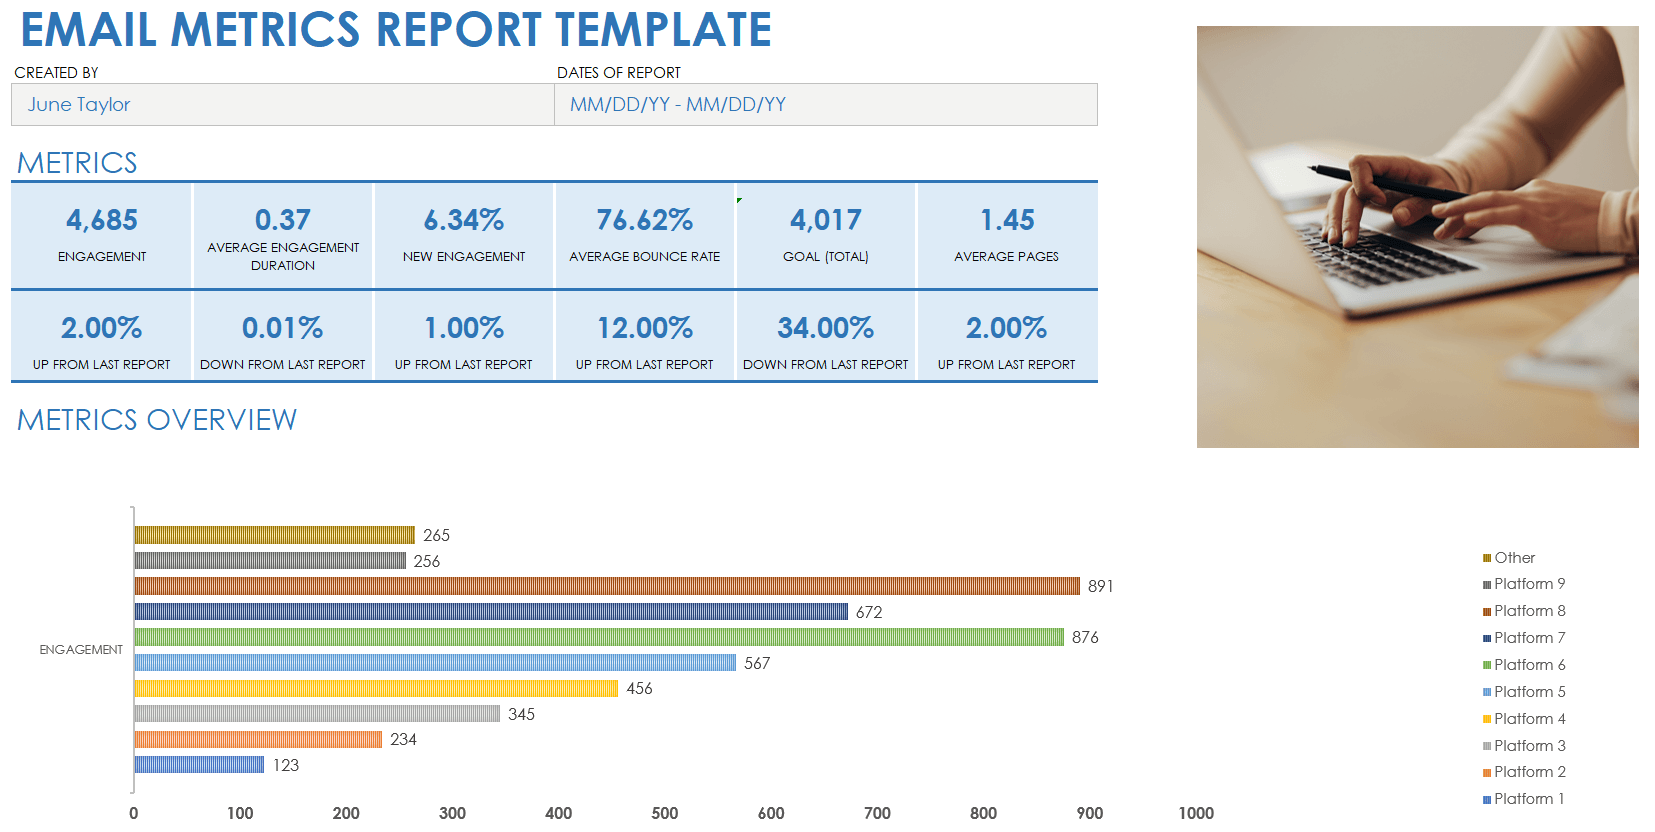
Use this email metrics report template to streamline the process of tracking and analyzing the performance of your email marketing campaigns. Enter KPI data, such as number of sessions, pages per session, average session duration, percentage of new sessions, bounce rate, and goal completions. The template will use data to generate a comprehensive, visually dynamic view of user engagement and campaign effectiveness. This template is a great fit for marketing teams looking to foster clear and consistent email-campaign reporting and to quickly identify trends and make data-driven decisions.
Read our article on free digital marketing report templates to learn more about how to guide future marketing strategies.
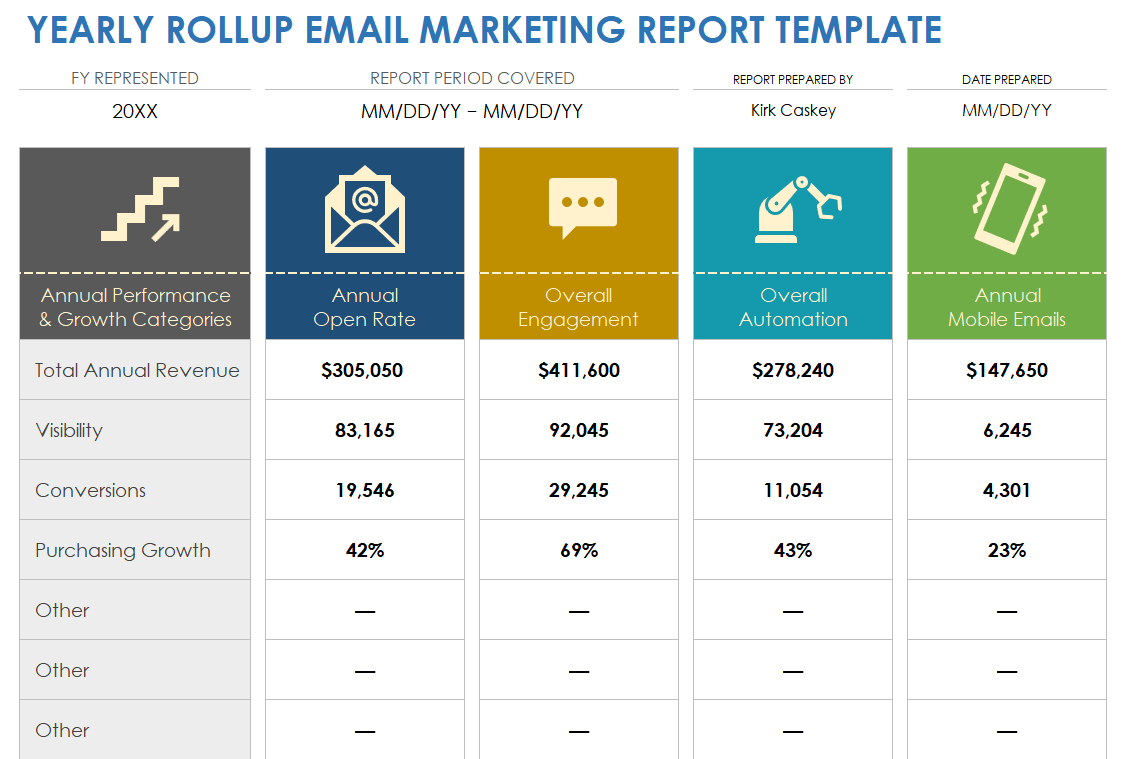
Yearly Rollup Email Marketing Report Template
Download a Yearly Rollup Email Marketing Report Template for
Excel
|
PowerPoint
| Google Sheets
A yearly rollup in marketing refers to the process of compiling and summarizing key marketing data, metrics, and achievements over the course of a year. This comprehensive yearly rollup email marketing report template is useful for reviewing the performance of different marketing campaigns, channels, and strategies; measuring their ROI; and identifying areas of improvement or growth. Use this template to track growth and performances, open rate, and more.
The Main Elements in Email Marketing Reports
Email marketing reports include an overview of campaign objectives, detailed analysis of key metrics, audience insights, conclusions, and actionable recommendations. These components provide insight into performance. Marketers use the reports to optimize engagement, refine email marketing efforts, and enhance ROI.
These elements help structure the report in a way that is informative and actionable, guiding the reader through the objectives, findings, insights, and recommendations for future strategy. Here are the main sections typically included in email marketing reports:
- Introduction/Overview
- Brief description of the campaign
- Objectives and goals of the campaign
- Target audience and segmentation strategy
- Campaign Details
- Description of the email content
- Visuals of the email design
- Timing and frequency of emails sent
- Key Metrics Findings
- Detailed analysis of key metrics (without going into the specific KPIs)
- Comparative data (e.g., comparing performance against past campaigns or industry averages)
- Audience Insights
- Analysis of audience engagement
- Subscriber growth/loss
- Segmentation performance
- Conclusions/Insights
- Summary of what the data is showing
- Insights into what worked well and what didn’t
- Analysis of any anomalies or unexpected results
- Recommendations/Next Steps
- Suggested actions based on insights
- Recommendations for optimizing future campaigns
- Proposed tests or experiments to try
- Appendix/Supplementary Data
- Any additional data or analysis that supports the main report
- Detailed breakdowns of performance by segment, geography, demographic, etc.
KPIs to Include in Email Marketing Reports
The key performance indicators (KPIs) to include in an email marketing report are open rates, click-through rates (CTR), conversion rates, and unsubscribe rates. These metrics help you see which emails are effective and which aren’t.
Email marketing KPIs are specific, quantifiable metrics included within the report, such as open rate, CTR, and conversion rate. While the main elements provide the structural framework of the report, KPIs offer insights into performance within that framework.
Here are some KPIs to consider tracking with an email marketing report:
- Bounce Rate: Represents the percentage of sent emails that could not be delivered.
- Click-through Rate (CTR): Indicates the percentage of viewers who clicked on a link within the email.
- Conversion Rate: Shows the percentage of email recipients who completed a desired action.
- Email Forward Rate: Indicates the percentage of recipients who forwarded the email.
- Engagement Over Time: Analyses when recipients are opening and engaging with emails. This data can help you fine-tune when you send marketing emails.
- List Growth Rate: Tracks the rate the email subscriber list is growing.
- Open Rate: Measures the percentage of recipients who opened the email.
- Return on Investment (ROI): Calculates the financial return on the cost of the email campaign.
- Spam Complaint Rate: Tracks the number of recipients marking the email as spam.
- Unsubscribe Rate: Measures the percentage of recipients who opted out of future emails.
Incorporating KPIs in an email marketing report is crucial. They quantify campaign performance, enabling marketers to assess the effectiveness of their strategies, identify areas for improvement, and optimize their efforts for better engagement and ROI.
How to Create an Email Marketing Report
Use an email marketing report template to collect, analyze, and present data on the performance of your email campaigns. Gather the key data you’ll include in the report. Be sure to compare benchmarks and end the report with recommendations.
The goal of an email marketing report is not only to present data, but to provide actionable insights. Tailor your report to the needs of your audience, focusing on clarity and relevance. Here’s a step-by-step guide to help you create an effective email marketing report:
- Define Objectives
Explain the objectives of the email marketing campaign. What do you want to achieve? Whether it's increasing sales, engagement, or brand awareness, having clear objectives will guide you in deciding which data to include. - Identify KPIs
Based on your objectives, identify the KPIs you’ll track. Common KPIs include open rate, click-through rate, conversion rate, bounce rate, unsubscribe rate, and ROI. - Gather Data
Collect data from your email marketing platform and any other relevant sources, such as Google Analytics. Export the data related to your KPIs for the reporting period. - Segment Data
Segment the data based on different criteria such as the type of email, demographics, or campaign. This will allow for more detailed analysis and tailored recommendations. - Visualize Data
Use charts, graphs, and tables to visualize your data. This makes your report more readable and helps stakeholders quickly grasp the key findings. - Use a Template to Present the Data
Use a template, such as this article’s email marketing dashboard report template , to visually organize and display key email campaign metrics.
- Enter Your Data
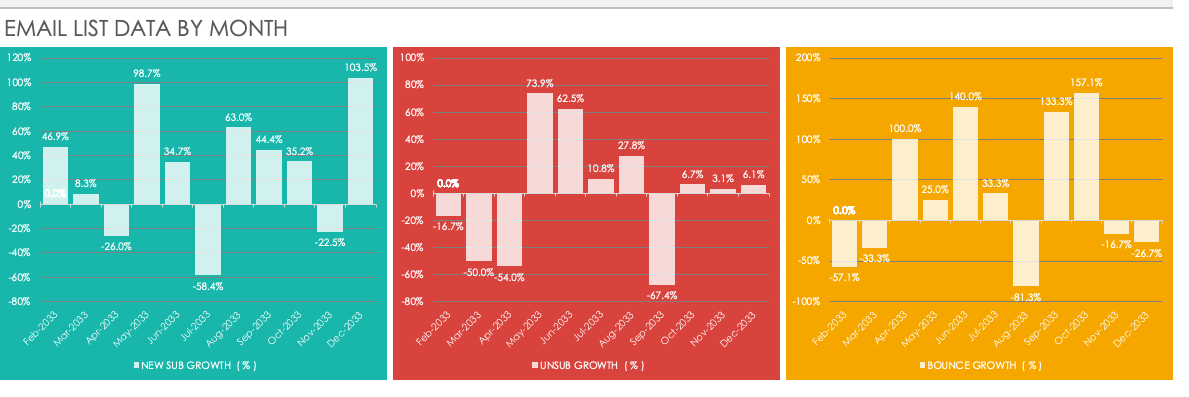
In the email marketing dashboard report template’s data-input section, enter your data in the corresponding cells for New Subscriptions, Unsubscriptions, and Bounced. The chart will turn those numbers into a percentage rate for New Subscriber Growth, Unsubscriber Growth, and Bounce Growth, respectively.

- As you replace the sample data in the Email List Data by Month chart with your data, the Email List by Data Month bar chart will automatically update to reflect your metrics.
- Customize the Email Marketing Template
You can customize the template columns to serve your needs. You can change the template’s fields to measure the level of interest your subscribers have in your emails by tracking open rate, click-through rates (CTR), and conversion rates. Follow these steps:- Click the BLANK Email Marketing Dashboard tab at the bottom of the spreadsheet.
- Click cell 13B, highlight EMAIL LIST DATA BY MONTH, and enter a new title: EMAIL LIST OPEN AND CONVERSION DATA.

- Update the chart column names:
- Click cell 14C, highlight NEW SUBSCRIPTIONS, and enter OPEN RATE.
- Click cell 14D, highlight UNSUBSCRIPTIONS, and enter CLICK-THROUGH RATES.
- Click cell 14E, highlight BOUNCED, and enter CONVERSIONS.
- Click cell 14F, highlight NEW SUB GROWTH ( % ), and enter OPEN RATE GROWTH ( % ).
- Click cell 14G, highlight UNSUB GROWTH ( % ), and enter CLICK-THROUGH GROWTH ( % ).
- Click cell 14H, highlight BOUNCE GROWTH ( % ), and enter CONVERSION GROWTH ( % ).

- As you update the names in the data chart, the template will automatically update the bar charts at the top of the sheet. You will have to update the names in the CURRENT STATUS field by clicking on the name and changing NEW SUB GROWTH, UNSUB GROWTH, and BOUNCE GROWTH to OPEN RATE GROWTH, CLICK-THROUGH GROWTH, and CONVERSION GROWTH, respectively.
- Enter your data in the EMAIL LIST OPEN AND CONVERSION DATA chart and it will auto-populate the charts at the top of the sheet.
- Analyze Performance
Analyze the data to assess the performance of your email campaigns against the objectives and benchmarks. Look for trends, patterns, and areas of improvement. - Compare with Benchmarks
Compare your performance against industry benchmarks and previous results to gain an understanding of how well your campaign is doing relative to others. - Draw Insights
Based on your analysis, draw insights about what worked well and what didn’t. Identify the factors contributing to the success or failure of the campaign. - Make Recommendations
Develop recommendations for future campaigns based on your insights. Suggest ways to improve performance, such as optimizing email content, timing, or audience segmentation. - Compile the Report
Compile your findings, insights, and recommendations into a structured report. Include an introduction, methodology, key findings, insights, recommendations, and conclusion. - Review and Present
Review the report to ensure accuracy and clarity. Present the report to stakeholders and discuss the key findings and next steps.
Easily Track and Manage Data for Email Marketing Reports with Smartsheet
The best marketing teams know the importance of effective campaign management, consistent creative operations, and powerful event logistics -- and Smartsheet helps you deliver on all three so you can be more effective and achieve more.
The Smartsheet platform makes it easy to plan, capture, manage, and report on work from anywhere, helping your team be more effective and get more done. Report on key metrics and get real-time visibility into work as it happens with roll-up reports, dashboards, and automated workflows built to keep your team connected and informed.
When teams have clarity into the work getting done, there’s no telling how much more they can accomplish in the same amount of time. Try Smartsheet for free, today.