Excel Fishbone Root Cause Analysis Template
Download the Fishbone Root Cause Analysis Template for Excel
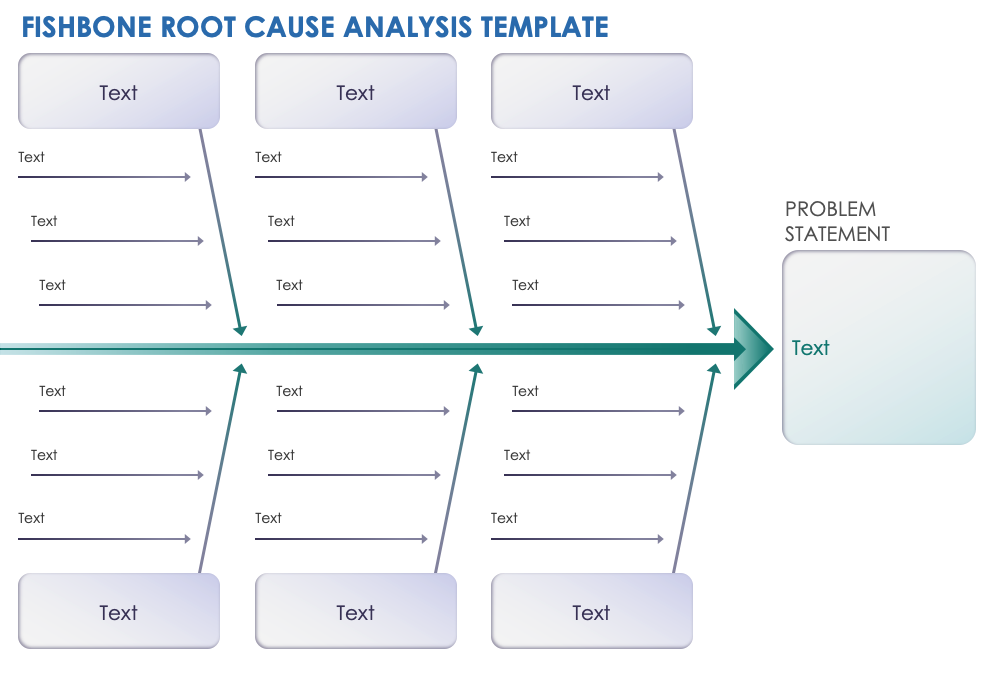
When to Use This Template: Project managers, quality assurance teams, and operations analysts across industries can use this template to dissect and understand complex challenges. Analyze situations with many contributing factors — such as environment, policies, systems, and personnel — to identify underlying problems and drill down to the root causes. You can also use this fishbone framework for gap analysis or in conjunction with other problem-solving techniques.
Notable Template Features: This fishbone diagram allows you to list multiple sub-causes as you discover the root of each primary cause. The fishbone format highlights connections between elements, and by identifying core issues, you promote team consensus on what factors to address. You get a detailed analysis of potential causes, ranging from human error to material quality, ensuring a comprehensive evaluation.
See this Fishbone Root Cause Analysis template in additional formats.
Excel Simple Ishikawa Cause-and Effect-Template
Download the Simple Ishikawa Cause-and-Effect Template for Excel
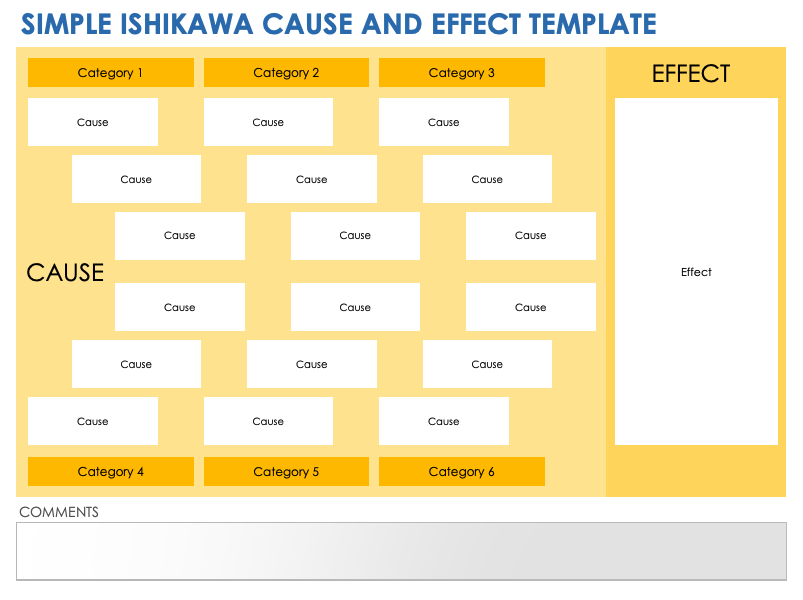
When to Use This Template: Use this simplified Ishikawa diagram to brainstorm potential causes of a particular issue. Sort ideas into categories, and organize a wide range of factors in a structured manner. This tool can help teams understand challenges, generate ideas, and solve problems systematically.
Notable Template Features: Like other fishbone diagrams, this template offers a visual structure that simplifies complex relationships between causes and effects. Teams can enter tailored headings into the blank categories to modify the template for various scenarios, from operational failures to strategic planning. The template includes a section at the bottom for additional notes.
Excel 5 Whys Fishbone Chart Template
Download the 5 Whys Fishbone Chart Template for Excel
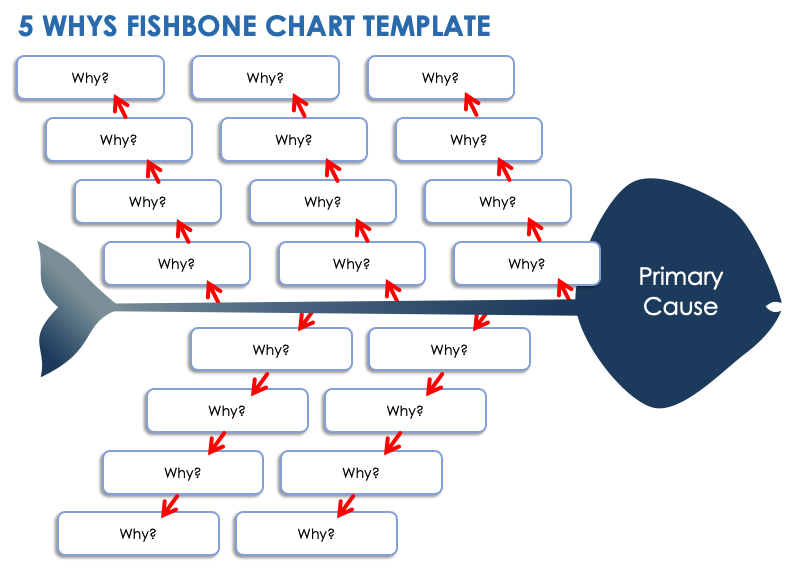
When to Use This Template: Choose this 5 Whys fishbone diagram template when you need to delve deeper into each level of a problem. The template guides you through a questioning process to uncover underlying issues and reach the root causes of a problem.
Notable Template Features: The 5 Whys problem-solving method is often part of a fishbone analysis, but this template makes that process explicit. Enter a problem’s cause in the head of the fish, then use the why questions in each fishbone until you reach the underlying, fundamental cause. The visual layout aids in tracking multiple lines of inquiry, providing clarity and allowing you to maintain a straightforward path to the origin of an issue.
Excel Manufacturing Fishbone Diagram Template
Download the Manufacturing Fishbone Diagram Template for Excel
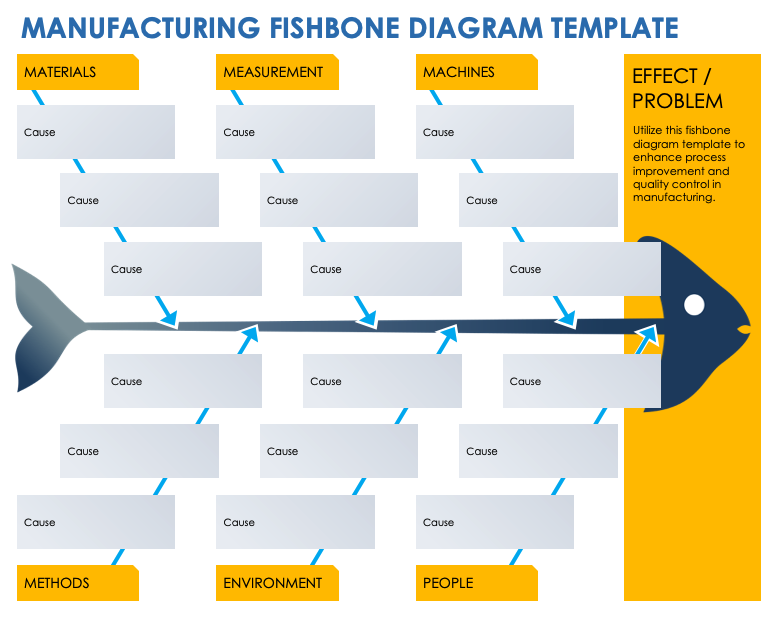
When to Use This Template: Utilize this fishbone diagram template to enhance process improvement and quality control in manufacturing. The template is ideal for dissecting complex issues, allowing teams to categorize and scrutinize different aspects of production. Use it to pinpoint areas that require attention and to strategize continuous improvements.
Notable Template Features: The template includes categories that are commonly used in manufacturing: materials, measurement, machines, methods, environment, and people. Edit these categories to create a customized analysis. For each main category, list primary and secondary causes, along with subcategories for a thorough breakdown of underlying causes. The template provides a visual map for diagnosing and solving manufacturing challenges.
Excel 8 Ps Fishbone Diagram Template
Download the 8 Ps Fishbone Diagram Template for Excel
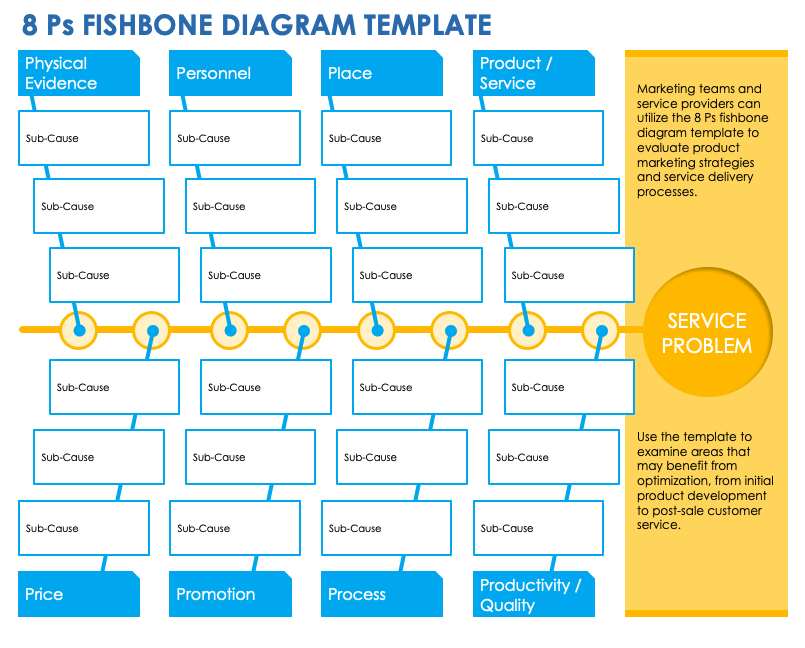
When to Use This Template: Marketing teams and service providers can utilize the 8 Ps fishbone diagram template to evaluate product marketing strategies and service delivery processes. Use the template to examine areas that may benefit from optimization, from initial product development to post-sale customer service. You can also use this tool to review marketing campaign strategies in order to ensure they align with business objectives.
Notable Template Features: This template covers the 8 Ps — physical evidence, personnel, place, product/service, price, promotion, process, and productivity/quality — which are fishbone categories often used in product marketing or service industry settings. The visual arrangement aids stakeholders in identifying correlations and interactions between different areas, promoting an integrated approach to quality and process enhancement.
Excel 4 Ss Fishbone Diagram Template
Download the 4 Ss Fishbone Diagram Template for Excel
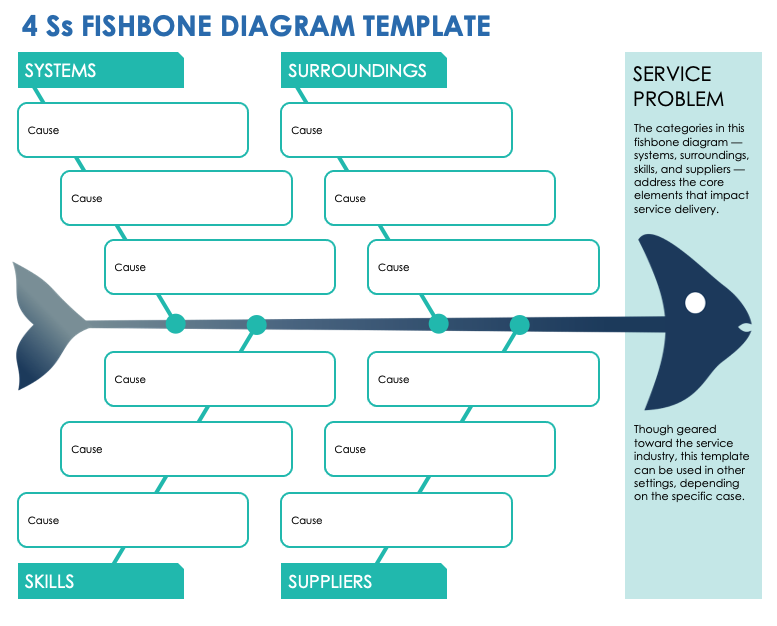
When to Use This Template: The categories in this fishbone diagram — systems, surroundings, skills, and suppliers — address the core elements that impact service delivery. Though geared toward the service industry, this template can be used in other settings, depending on the specific case. A smaller diagram is particularly useful for targeted problem-solving sessions where the goal is to quickly identify service improvement opportunities.
Notable Template Features: This template's fishlike design offers visual appeal to engage stakeholders. The template's head represents the problem area, while the bones branch out into the four Ss for tracing issues back to their sources. The compact structure enables a quick yet thorough root cause analysis that doesn't overwhelm with too many variables.
For more ways to visualize and share information, see this guide to project management charts and data visualization.
Zone In on the Root Causes of Problems with Free Fishbone Templates from Smartsheet
From simple task management and project planning to complex resource and portfolio management, Smartsheet helps you improve collaboration and increase work velocity -- empowering you to get more done.
The Smartsheet platform makes it easy to plan, capture, manage, and report on work from anywhere, helping your team be more effective and get more done. Report on key metrics and get real-time visibility into work as it happens with roll-up reports, dashboards, and automated workflows built to keep your team connected and informed.
When teams have clarity into the work getting done, there’s no telling how much more they can accomplish in the same amount of time. Try Smartsheet for free, today.