Milestone Chart Templates
Project Milestone Chart Template for Excel
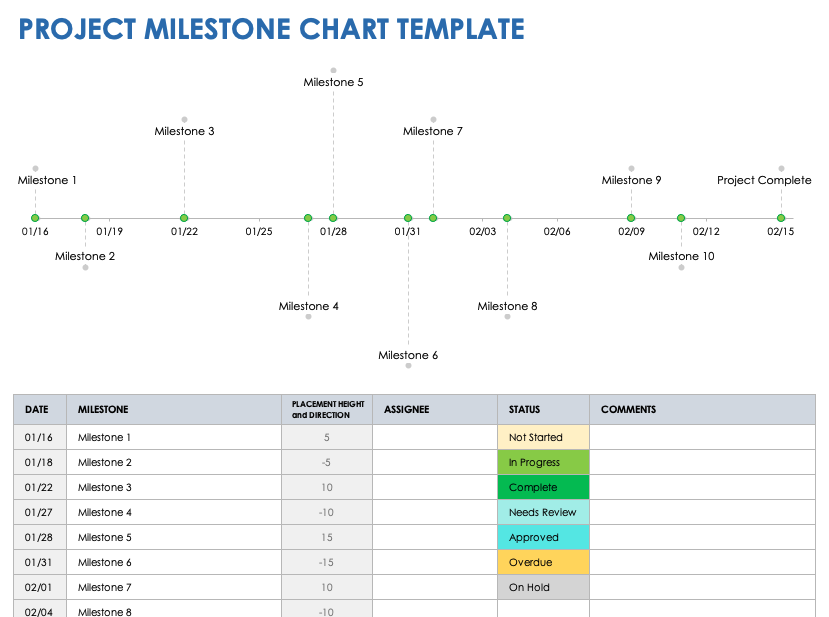
Download the Project Milestone Chart Template for Excel
This project milestone template features a horizontal chart paired with a chronological spreadsheet. Enter project milestones, due dates, and completion status directly into the spreadsheet, and your information will automatically populate in the chart. The chart is a great visual resource to share with stakeholders and team members, while the spreadsheet allows for more detailed project planning.
For additional milestone chart templates to help organize any project, check out these free project milestone templates.
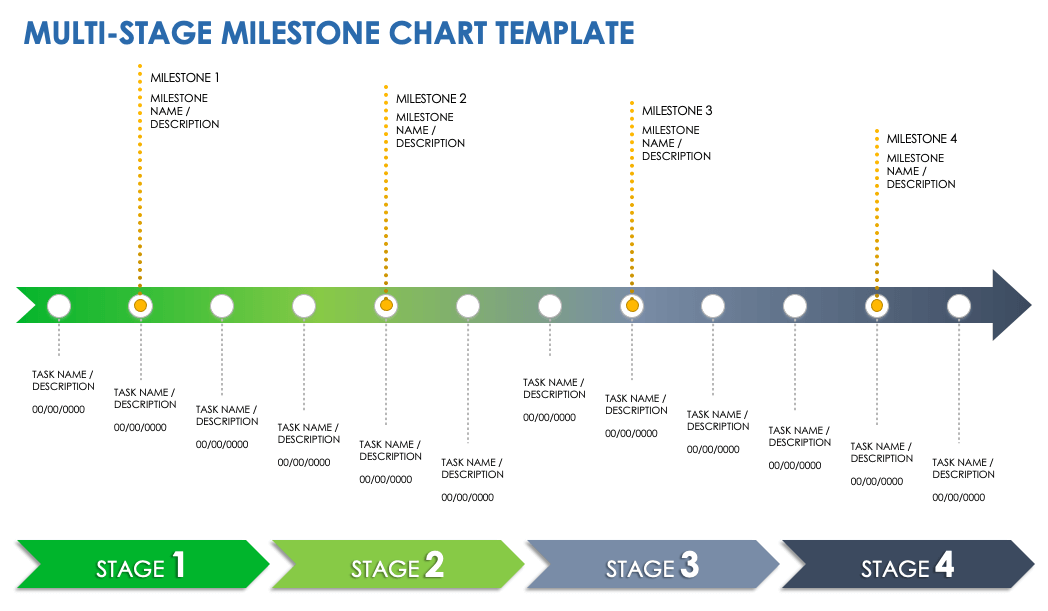
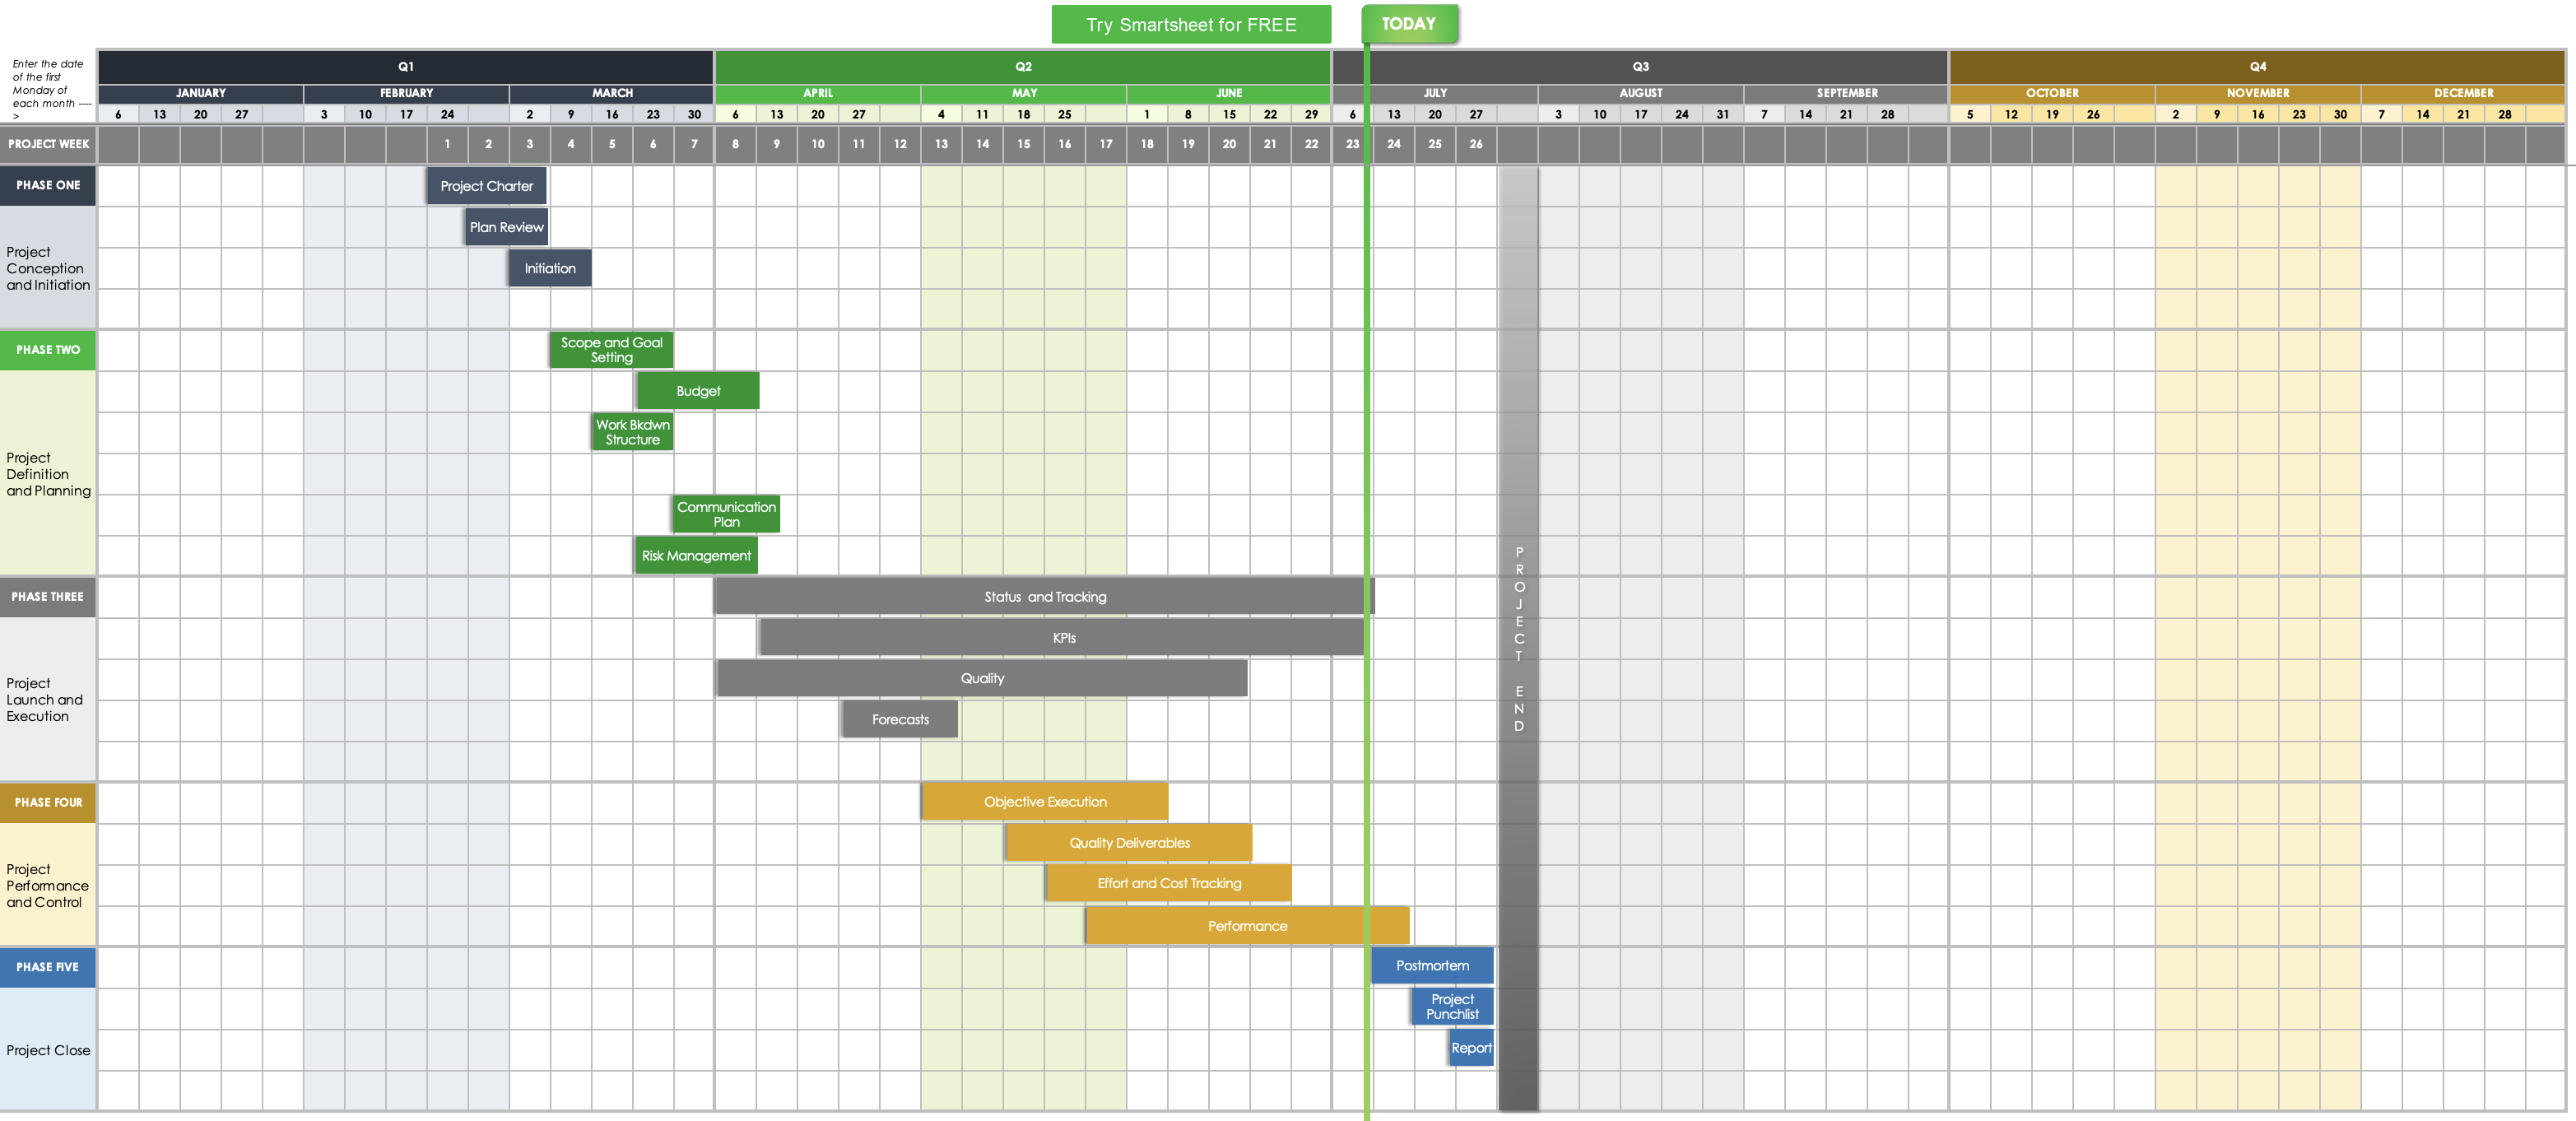
Multi-Stage Milestone Chart Template
Download a Multi-Stage Milestone Chart Template for
Excel
|
PowerPoint
Breaking a project into stages can boost momentum and simplify management. Use this multi-stage milestone chart template to oversee all phases of your project’s lifecycle. Enter key project checkpoints and brief descriptions under the Milestone headings. Then customize each task with your deliverables, and add dates to keep the project on schedule.
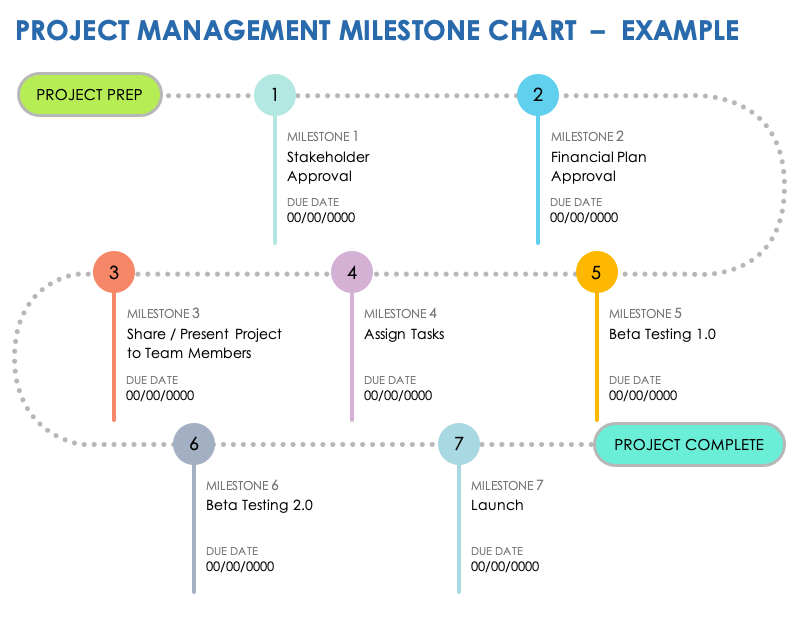
Project Management Milestone Chart Template
Download the Blank Project Management Milestone Chart Template for
Microsoft Word
|
PowerPoint
Download the Sample Project Management Milestone Chart Template for
Microsoft Word
|
PowerPoint
This straightforward project management milestone chart template, with or without sample text, helps ensure that you cover every step of your project. Chronologically assign each number in the chart to its respective milestone. Then add a brief description of the milestone and its completion date. Once done, you’ll have a clear visual guide to the project’s lifecycle. This template is perfect for sharing with stakeholders and team members so that they have a clear understanding of the project’s timeline.
To learn more about how to manage a project through its entire lifecycle, see this guide to the five phases of project management.
What Is a Milestone Chart?
A milestone chart is a horizontal visual of a project's timeline that highlights crucial checkpoints or milestones. These milestones signal pivotal shifts in the project's trajectory, serving as progress markers and momentum drivers.
Think of a milestone chart like a roadmap. The project manager drives from point A to point B, following the directions on the map. The milestones indicate how far you've come and how far you have left to travel.
What Should Be Included in a Milestone Chart?
A milestone chart should include a visual representation of a project's timeline with significant project milestones. For each milestone, the chart should include a due date, its current status, and any relevant tasks or deliverables that lead up to it.
Here is a list of what to include in your milestone chart to guarantee your project is successful:
- Project Start and End Date: A start and end date define the boundaries of your project timeline. All milestones and tasks are expected to be completed within this timeframe.
- Milestones: Milestones act as significant checkpoints indicating either a major accomplishment or the completion of crucial deliverables. Examples include securing funds, holding stakeholder meetings, undergoing a testing phase, or finalizing a contract.
- Milestone Due Dates: Every milestone should have a designated due date. This informs team members and stakeholders of when to expect important deliverables.
- Milestone Statuses: Teams should track milestones by indicating their current status, or whether they have not been started, are in progress, or have been completed.
- Tasks: Tasks are the specific actions or deliverables that occur between milestones. Each task represents the work that needs to be completed in order to reach the next milestone.
- Task Due Dates: Each task needs a set due date to keep the project on track.
- Assignees: An assignee takes responsibility for a particular task or milestone. Assigning individuals to tasks and milestones helps ensure clarity and accountability.
Why Milestone Charts Are Important
Milestone charts are important because they provide a clear visual representation of a project’s timeline, highlighting significant checkpoints and their associated deadlines. These charts ensure that teams stay on track, understand project progress, and can communicate to stakeholders effectively.
Here is a list of reasons why milestone charts are important:
- Schedule Maintenance: Milestone charts ensure adherence to your project’s timeline constraints so that you meet your final deadline. Their horizontal format allows for early timeline adjustments so that you can prepare for upcoming deliverables.
- Task Prioritization: Milestone charts clearly indicate where to direct your efforts based on the project’s current phase. For example, during the project’s second week, you’re not going to work on tasks scheduled for week eight. The progression from one milestone to the next streamlines the project and ensures its success.
- Progress Sharing: By sharing your milestone chart during meetings with team members and stakeholders, you help ensure everyone is on the same page and understands the project’s lifecycle.
- Team Motivation: Visualizing progress and understanding each team member’s contribution to the project’s success motivates teams. When a milestone is completed, it creates a sense of accomplishment and momentum, which boosts team morale.
- Managing Large Projects: Large projects usually involve significant organization, stakeholder engagement, frequent meetings, and numerous deliverables. Milestone charts simplify this process by neatly organizing project deliverables and providing a clear path to the project’s deadline.
- Ease of Creation: Choose one of the templates in this article to start creating your milestone chart. All of the templates are intuitive and easy to use.
When to Use a Milestone Chart
Use a milestone chart when managing any major project, regardless of its duration. Suitable scenarios for a milestone chart include renovations, software implementations, the development of new products or services, and event planning.
What Is the Typical Format of a Milestone Chart?
A milestone chart is typically formatted as a horizontal bar chart. The chart also highlights milestones with distinct shapes or colors, and it features text describing their titles and due dates. Deliverables between milestones are often annotated in a smaller font.

Different Types of Milestone Charts and Examples
The two main types of milestone charts are the timeline chart with milestones and the Gantt chart with milestones. While both track project progress, the former offers a simpler view, and the latter provides a more detailed representation.
Ultimately, the purpose of both charts is the same: to outline the project’s timeline. Both usually fit on a single page or slide, using a horizontal chart with milestones distinctly marked to represent the project’s timeline. Some charts might pair with a spreadsheet or list for more detailed information.
Here are the two main types of milestone charts:
Timeline Chart With Milestones
The timeline chart with milestones format offers a straightforward layout, providing a high-level view, ideal for presenting a snapshot of the project without delving deep into task specifics. Use this template to introduce your proposed project or provide a quick update on the project’s progress.
Gantt Chart With Milestones
The Gantt chart with milestones format depicts time blocks for each task, with the horizontal axis denoting time and the vertical axis signifying tasks. Use the Gantt chart with milestones for large projects involving interdependent tasks that involve several team members.
The Difference Between a Gantt Chart and a Milestone Chart
Gantt charts visually detail a project's timeline for every task. Tasks can overlap on the timeline since they aren't strictly sequential. Conversely, in a milestone chart, the timeline for each task remains distinct, completing one milestone before proceeding to the next.

Steps to Create a Milestone Chart
Creating a milestone chart begins with defining your project's goal and laying out the necessary tasks chronologically. As you set a timeline and identify key milestones, you'll establish a clear framework for project progression and stakeholder communication.
Here are the steps to follow when creating a milestone chart:
- Define Your Goal: What is the goal of the project? Craft a clear, concise statement to guide your efforts.
- Write a Task List: What tasks are essential to meet your goal? List them chronologically, linking milestones and shaping the project’s trajectory.
- Set a Timeline: What are your project’s start and end dates? Keep your task list in mind, ensuring a buffer for unexpected delays.
- Determine the Key Points: What are the significant turning points in the project? Highlight these as your milestones.
- Share the Chart With Stakeholders: How will you communicate your plan? Present your plan and ask for feedback.
- Make Adjustments: What if conditions or feedback dictate a change? Make the necessary adjustments to your chart to stay on track.
- Start Your Project: Are you ready to begin your project? With your framework in place, you can begin executing your project tasks.
How to Create a Milestone Chart With Smartsheet
Smartsheet makes it easy to create milestone charts using pre-built, customizable templates. With Smartsheet, you can chart, edit, and track project tasks and milestones in real time, from anywhere.
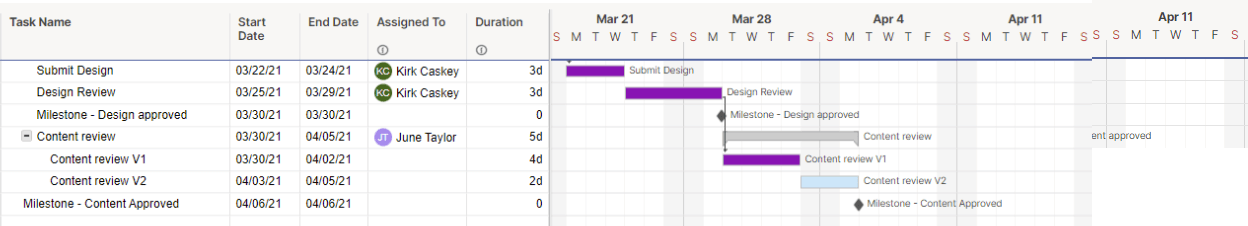
This is an example of a project plan template with a built-in Gantt chart to track tasks and milestones found in the Smartsheet Template Gallery. It comes preformatted with example project information and includes everything you need to chart milestones on a Gantt chart or as a list of tasks on a timeline.
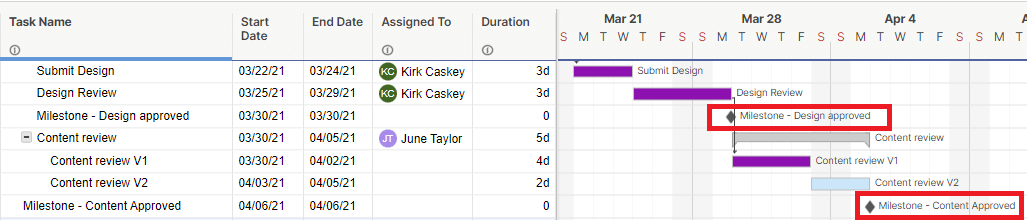
To create a milestone icon in this template, first enter a description of the milestone in the Task Name column. Then, set the Start Date and End Date to the date the milestone will be achieved. Note that you will need to set both the start and end dates to the same date to create a milestone icon.
Next, set the Duration to 0. This will create a small diamond icon on the Gantt chart to signify a milestone. Continue this process with all project tasks and milestones to view your project milestones in the context of all of your project tasks.
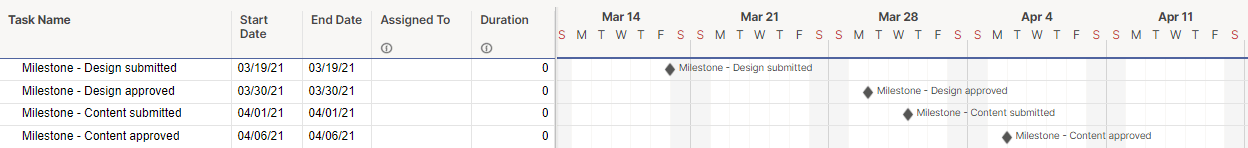
You can also use the same template to create a milestone timeline chart. Enter a description of each milestone in the Task Name column, and set the Start Date and End Date to the date the milestone is due. Ensure that both dates are the same to create the milestone icon on the timeline.
Next, set the Duration of each task to 0. When you have entered all of your project milestones, the template will chart them as icons on a timeline on the timeline to the right.
Use Smartsheet to Effectively Track Project Milestones
From simple task management and project planning to complex resource and portfolio management, Smartsheet helps you improve collaboration and increase work velocity -- empowering you to get more done.
The Smartsheet platform makes it easy to plan, capture, manage, and report on work from anywhere, helping your team be more effective and get more done. Report on key metrics and get real-time visibility into work as it happens with roll-up reports, dashboards, and automated workflows built to keep your team connected and informed.
When teams have clarity into the work getting done, there’s no telling how much more they can accomplish in the same amount of time. Try Smartsheet for free, today.
