Risk Assessment Heat Map Template for Excel

Download the Risk Assessment Heat Map Template for Excel
To conduct a heat map risk analysis, compile a list of all risks into the data table and enter the predicted impact and likelihood for each risk. Lower numbers represent less significant impact to a project or business, as well as a lower probability of occurrence; the higher numbers represent a more critical risk. Based on your data, the template calculates a score for each risk and populates the heat map. You then get a visual overview of all risks, which allows you to prioritize major threats and develop effective mitigation plans. The template also provides a color-coded table that shows the percentages of low, moderate, high, and critical risks.
Enterprise Risk Management Heat Map Template for Excel

Download the Enterprise Risk Management Heat Map Template for Excel
This template is designed for enterprise risk management (ERM), but you can also use it to analyze risks in any area that you can break down into multiple subsets, such as in operational or supply chain risk management. The template includes a data table, a heat map, and a bar chart that shows the total number of risks in each category. It also highlights mitigation strategies and monitoring frequency for each risk.
Use the risk criteria section to define the quantitative measures you will use to determine risk ratings. In the data table, after listing risks by category, score each risk for impact and probability on a range from minor or unlikely to critical or almost certain. The heat map shows risks by score, while the bar chart shows how many risks are in each category. Edit the categories to fit your business needs. For an ERM heat map, categories might include operational risks, IT security risks, financial risks, compliance risks, legal risks, and more.
To narrow the focus of the template, select one category to divide into subcategories. For example, a compliance risk heat map might include risks related to corruption, workplace health and safety, employee behavior, environmental standards, quality, data management, and other categories. A supply chain heat map analysis might include environmental, sociopolitical, economic, regulatory, technological, and other internal and external risks. You can also break down each of those categories into specific risk descriptions, and then rate them to determine significance.
Cyber Risk Heat Map Example Template for Excel

Download the Cyber Risk Heat Map Example Template for Excel
This example risk heat map analysis includes a mix of cyber security and IT risks, ranging from data breaches to environmental threats. Edit the template with your own list of risks to create a cyber security or IT risk heat map. The example heat map shows risks that range from green to red on the matrix, indicating insignificant, moderate, major, and severe issues. For each of your risks entered in the data portion of the template, assign a value from 1 to 5 for potential impact to your business and the likelihood of the risk. The heat map matrix displays each risk in the appropriate color area based on the scores you assigned, to provide a snapshot of cyber risks ranging from least to most urgent.
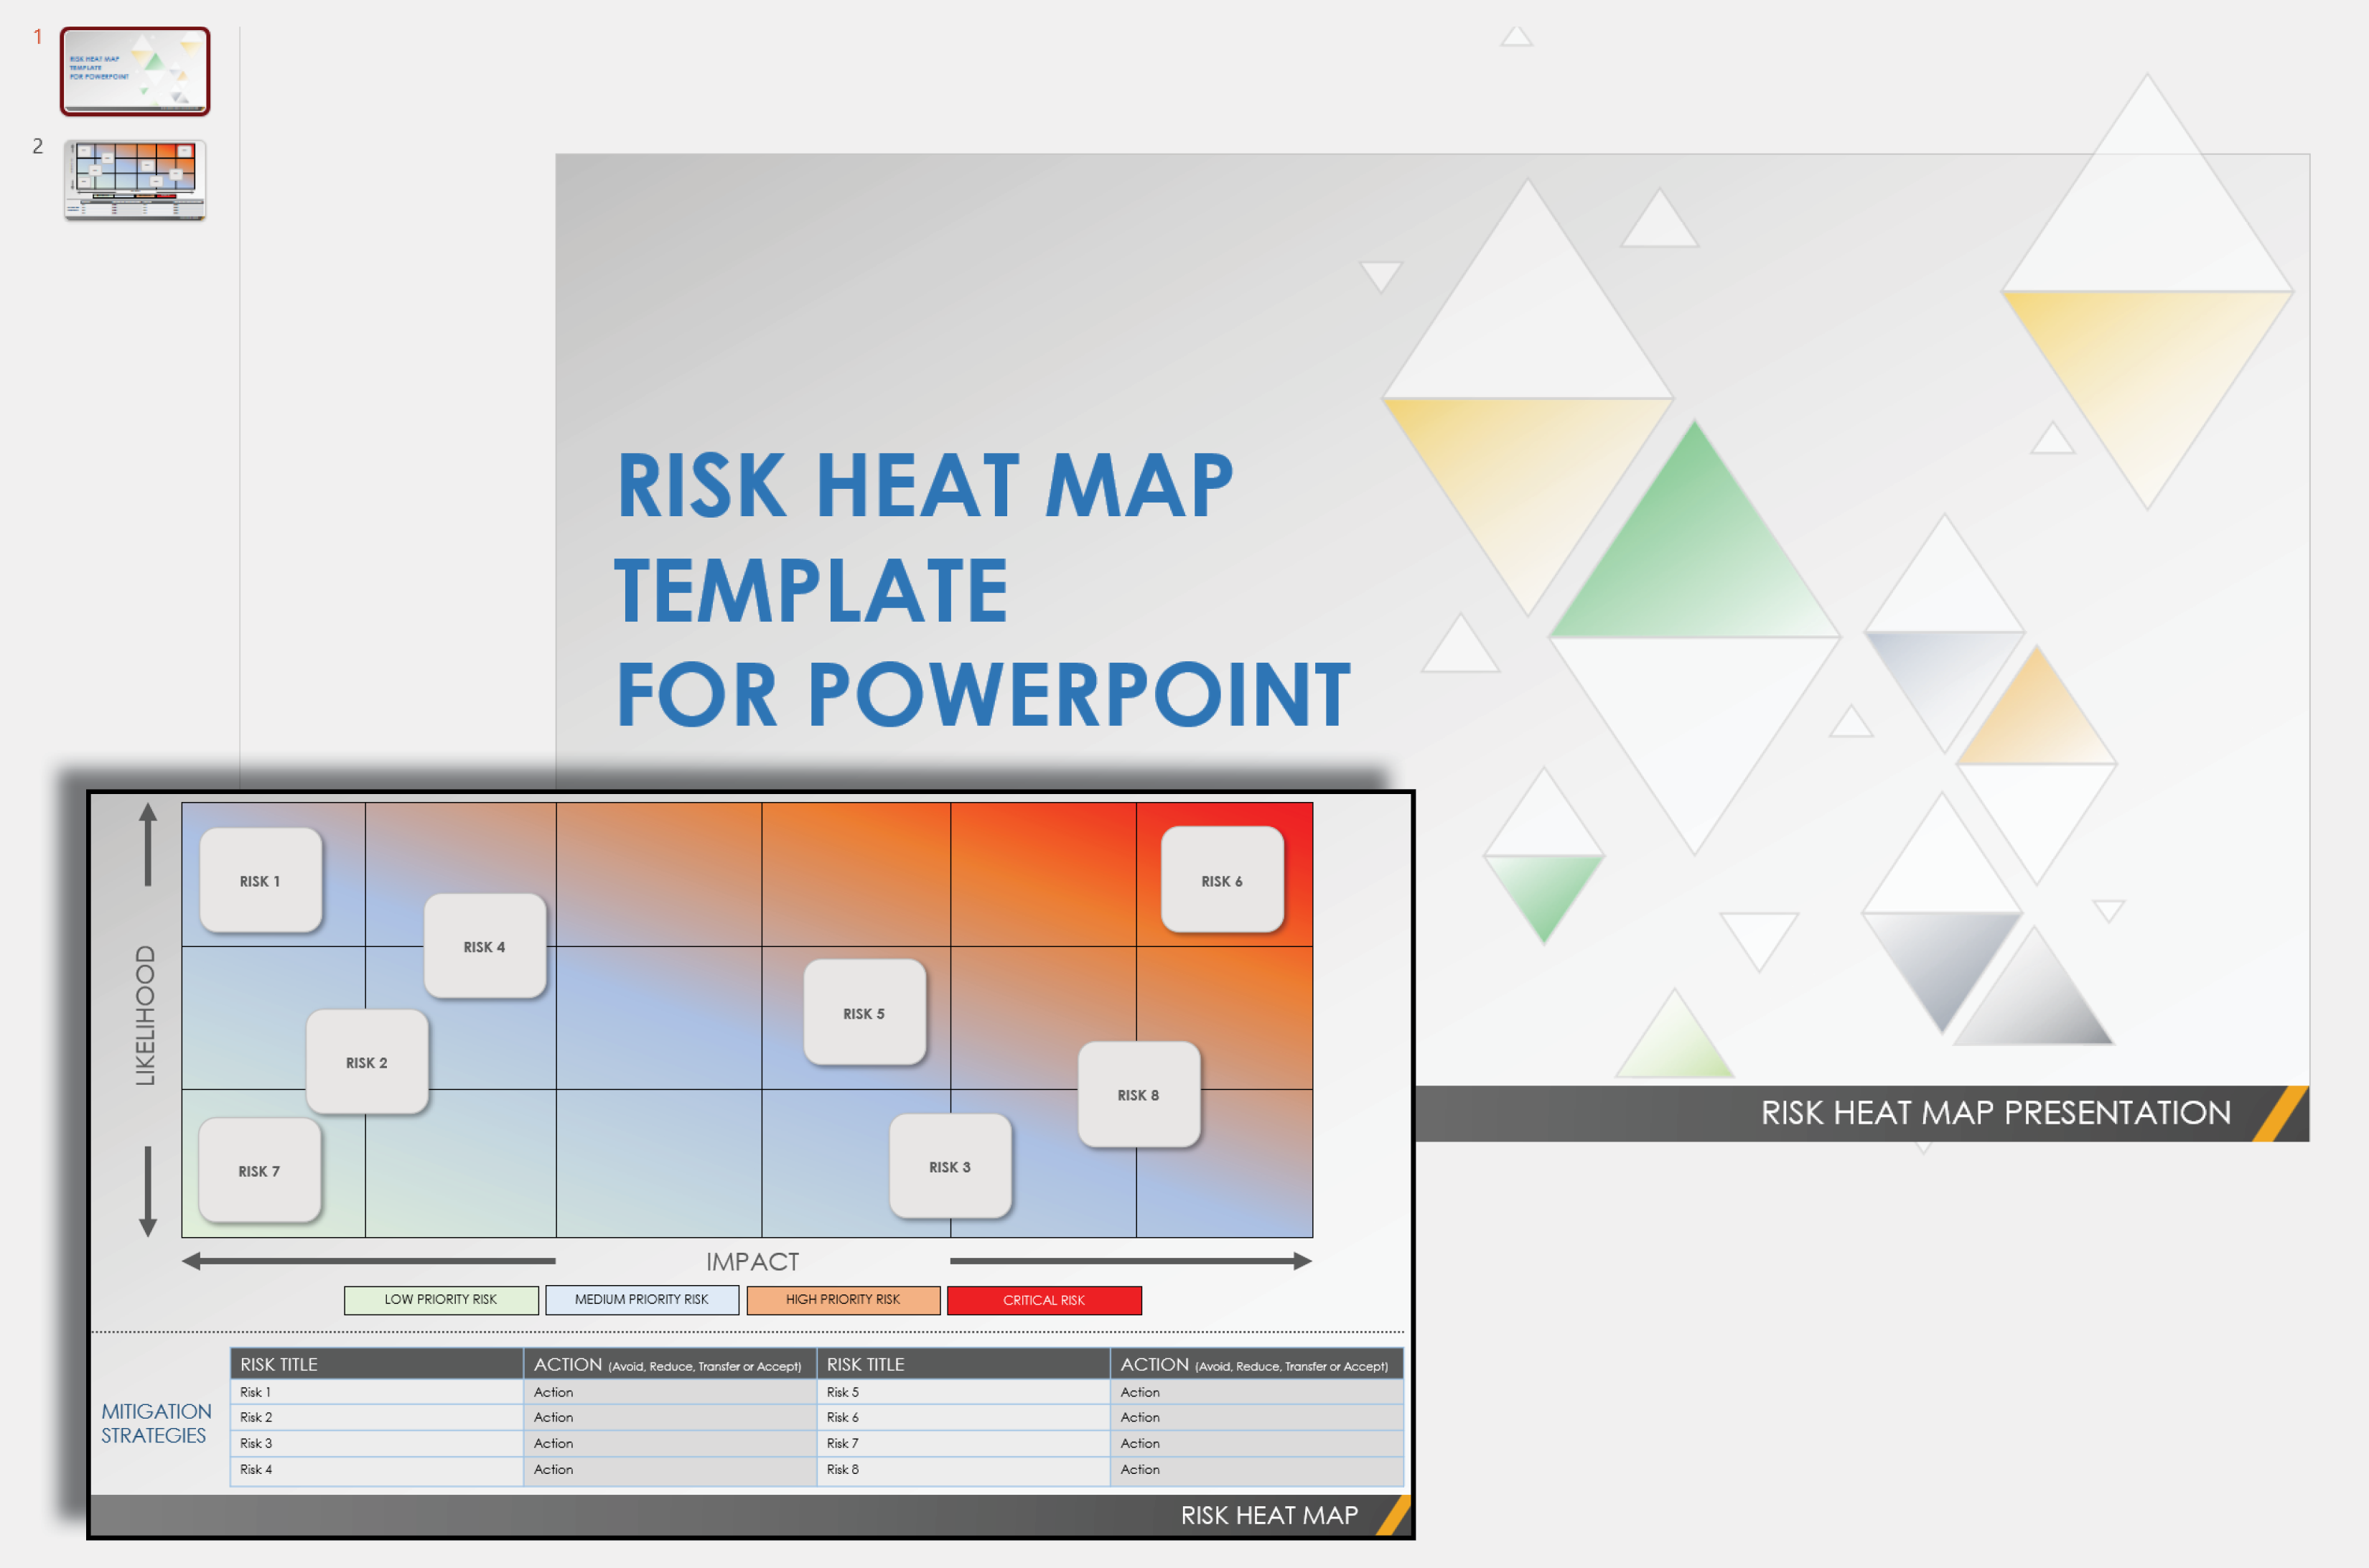
Risk Heat Map Template for PowerPoint
Download the Risk Heat Map Template for PowerPoint
This PowerPoint template includes a gradient heat map and list of mitigation strategies. Create a list of identified risks and enter mitigation actions for each one depending on severity: avoid, reduce, transfer, or accept. Each item on the list corresponds to a numbered circle on the heat map. Move the circles on the heat map to illustrate the risk level for each, from minor to extreme.
Velocity and Preparedness Risk Heat Map Template for Excel

Download the Velocity and Preparedness Risk Heat Map Template for Excel
Use this template to create a risk heat map with ratings for impact, probability, velocity, and preparedness. Velocity indicates the speed at which a risk could impact a project, a business, or an organization, as some events have an instantaneous effect while others take years to make an impact. Preparedness measures how ready an organization is to handle a given risk, which depends on the preventive and response controls that are in place and the effectiveness of those controls. After evaluating each risk for these factors, enter your data into the template to generate the heat map. Risks are represented as circles on the map, with numbers corresponding to the risk IDs in the data table. The heat map matrix shows how each risk scores for impact and probability, the color of each circle refers to probability, and the size indicates velocity.
What Is a Risk Heat Map Template?
Use a risk heat map template to analyze and mitigate risks. A risk heat map is often formatted as a risk matrix, with one axis measuring impact and the other measuring probability. Colors indicate risk severity, from minor to extreme.
Organizations use their own rating scales to determine how likely a risk is to occur and how impactful it might be. They can do so from a qualitative or quantitative perspective, taking financial or other measurable impacts into consideration. Once the organization identifies and scores risks, the heat map displays the information graphically, placing risks into low, moderate, or high levels (often represented with green, yellow, and red colors). When you have a visual representation, you can easily prioritize risks from least significant to most critical.
Use Risk Heat Maps to Mitigate Risk with Real-Time Work Management in Smartsheet
Empower your people to go above and beyond with a flexible platform designed to match the needs of your team — and adapt as those needs change.
The Smartsheet platform makes it easy to plan, capture, manage, and report on work from anywhere, helping your team be more effective and get more done. Report on key metrics and get real-time visibility into work as it happens with roll-up reports, dashboards, and automated workflows built to keep your team connected and informed.
When teams have clarity into the work getting done, there’s no telling how much more they can accomplish in the same amount of time. Try Smartsheet for free, today.