What Is a Project Management Dashboard?
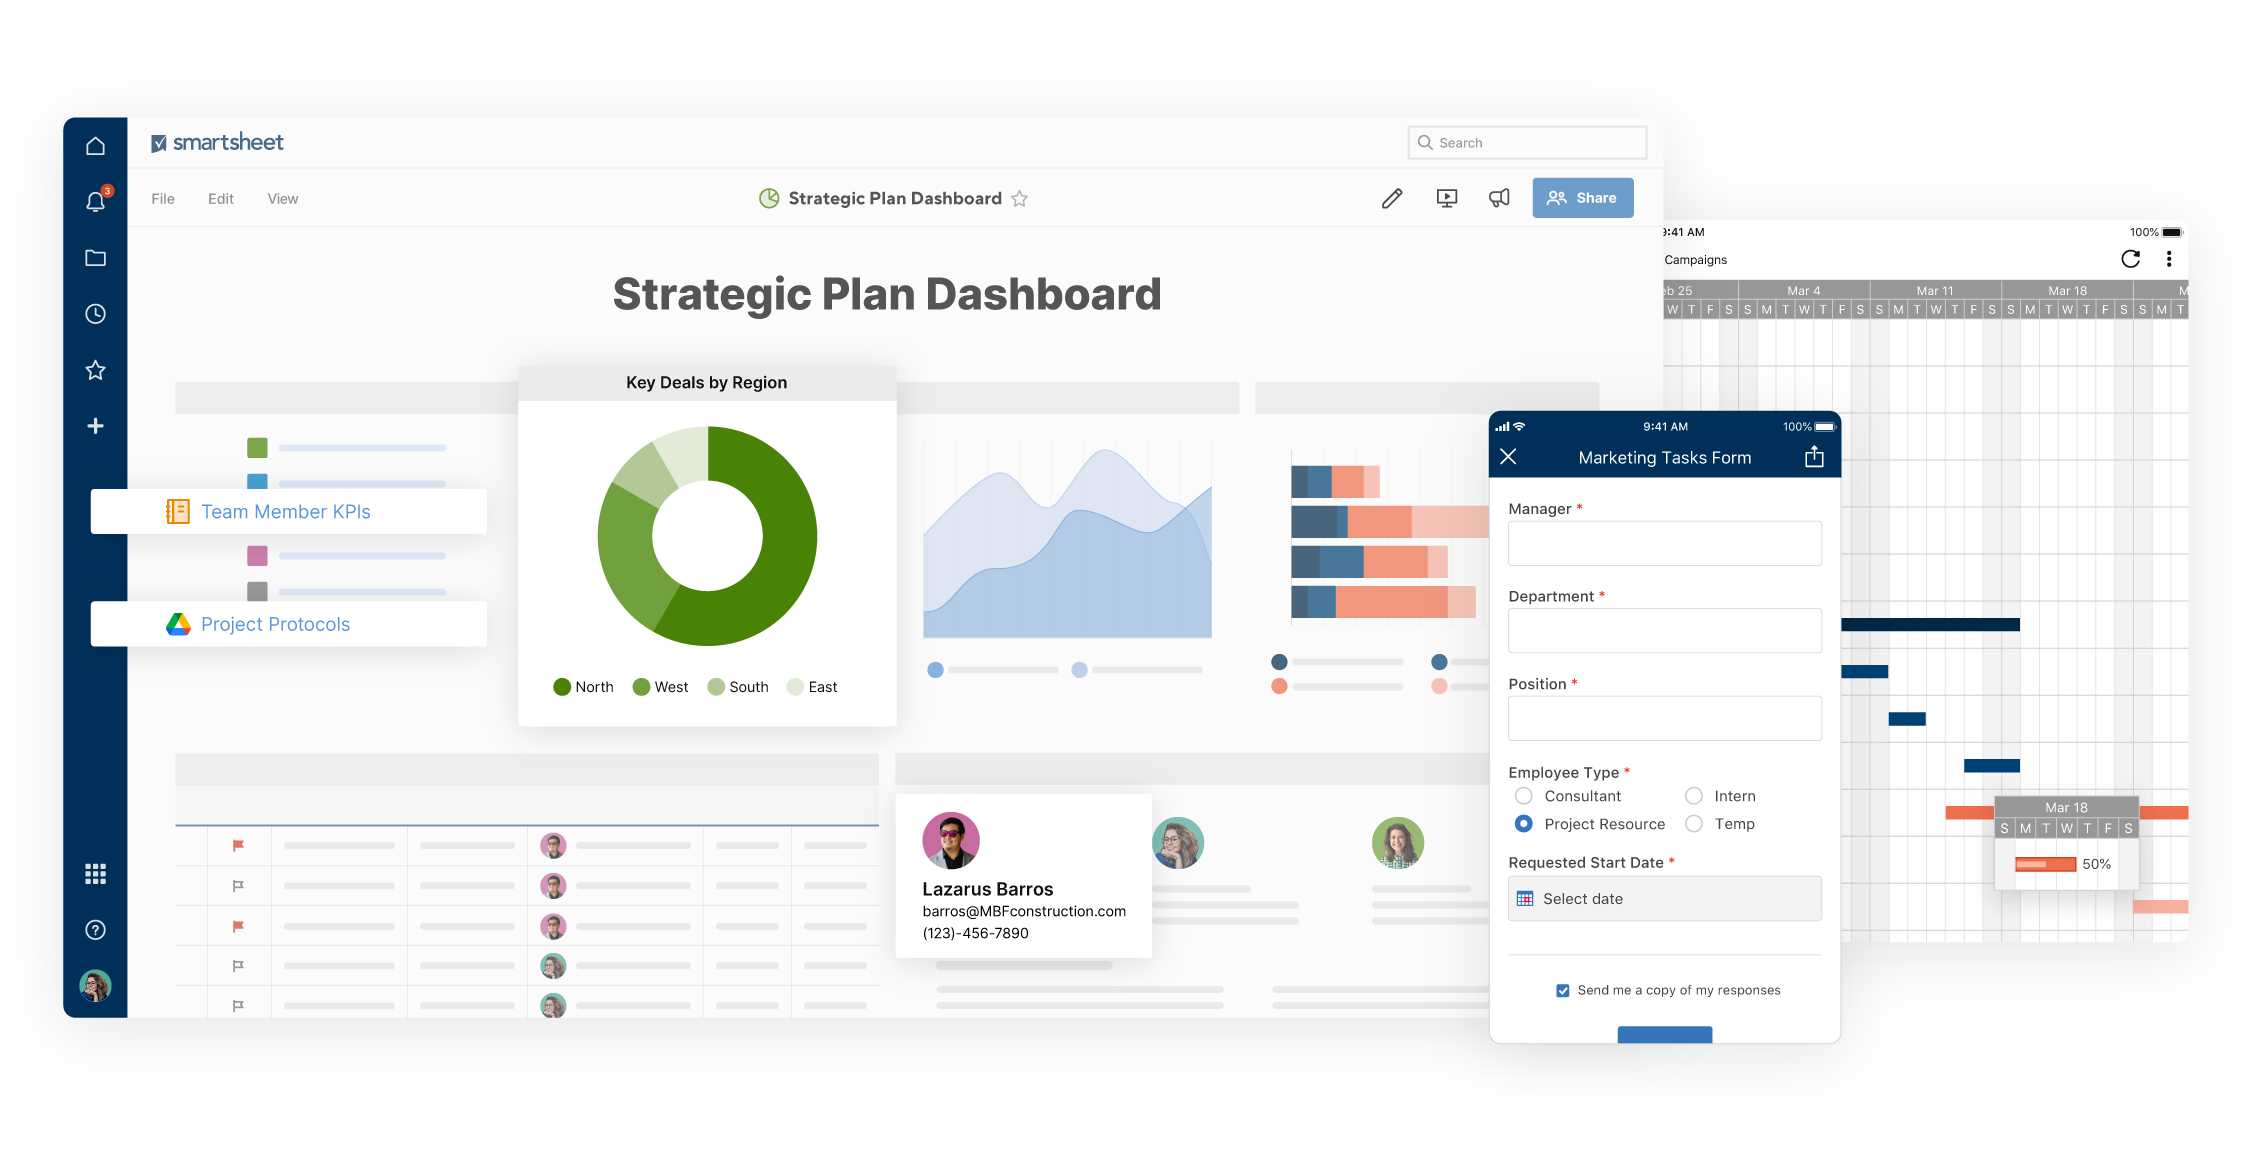
A dashboard is a high-level visualization of work being done. You can create a dashboard to review key statistics, build cross-departmental reports, or track big-picture status over time.
Dashboards provide an easy-to-read way to process important values and metrics and compare statistics. They’re also a key player in Agile project management because they allow teams to clearly see progress and react accordingly. Dashboards can help teams anticipate roadblocks, and adapt quickly and efficiently to achieve their goals.
Project management dashboards are helpful for managing projects with multiple parts. Plus, project management dashboards retain the core elements of a typical dashboard - a visual, high-level overview - but are ideal for keeping track of several teams, moving deadlines, upcoming challenges and tasks, and overall project trajectory and progress. When creating a project management dashboard, you’ll likely pull data from several spreadsheets, timelines, and resources to create a comprehensive information hub. Ultimately, aggregating all of these key data points into one dashboard enables project managers to both manage the work and showcase status to internal and external stakeholders.
Simple, powerful project management with Smartsheet. See for yourself.
Smartsheet is a cloud-based platform that allows teams and organizations to plan, manage, and report on projects, helping you move faster and achieve more. See Smartsheet in action.
Why Create a Project Management Dashboard?
Project management dashboards stemmed from a common need to deliver vital project information in a snapshot view. The most primitive dashboards highlight a few key metrics, but there are now many easy ways to weave in more complex data - even written information and images.
While you can certainly design a project management dashboard from scratch, there are many online tools that will save setup time so you can focus on guiding the project. For example, using a free dashboard template in Excel will help get you started quickly. In this list, you can find templates for a simple project management dashboard, a metrics dashboard, a project portfolio, and more. Each of these templates is easy to use and can apply to a multitude of different project types, from a product release to a construction project.
Make sure to choose the template that best suits and enhances your project management style. If used correctly, a dashboard can be a key component of your Agile project planning - it should help your team save time, identify setbacks early, and track performance. Whichever template you choose, a project management dashboard will hopefully increase efficiency by providing easy-to-understand, high-level reporting.
Discover a Powerful Project Management Dashboard in Smartsheet
Smartsheet is an enterprise work management platform that fundamentally changes the way teams, leaders, and businesses get work done. Over 70,000 brands and millions of information workers trust Smartsheet as the best way to plan, track, automate, and report on work.
The configurable, widget-driven dashboards in Smartsheet enable business users to highlight the information that’s most relevant to their business - without the need for technical support. Know the status of your projects at a glance, gain insights, and accelerate your team’s innovation all in one platform.

Let’s take a look at how you can get started building a project management dashboard with Smartsheet dashboards.
How to Set Up a Dashboard in Smartsheet
Step 1: Compile your data in sheets or reports
In order to create a dashboard in Smartsheet, you’ll need to fill other Smartsheet workspaces with data so you can pull it into your dashboard. You’ll also need to make sure that your sheets or reports are set up correctly. They should already display the results or totals that you want to surface in your dashboard. Key metrics need to be calculated directly in the source sheet or report, as the dashboard will simply pull these data points together.
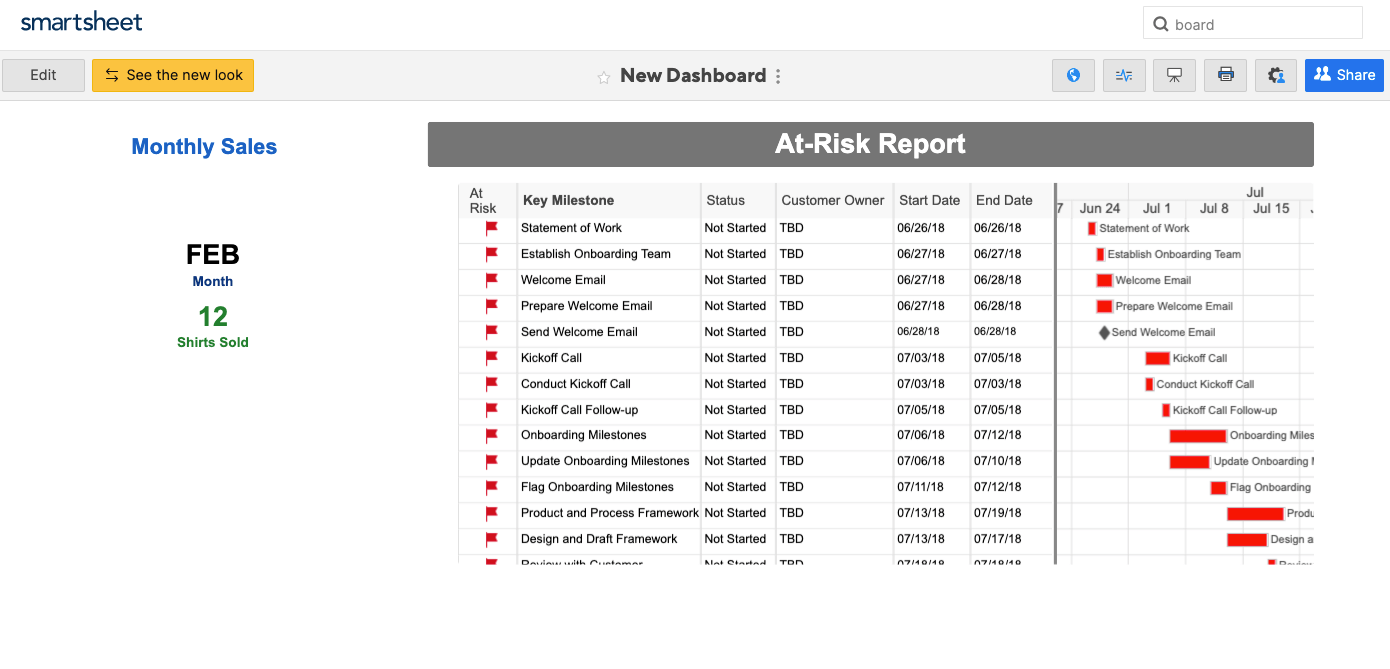
In this example, we’re going to create a dashbaord to monitor the status and tasks of a store opening project. This project management dashboard will give a us an easy-to-read, highly visual way to view the top-level data points and progress updates of our ongoing project.
Step 2: Create your Dashboard
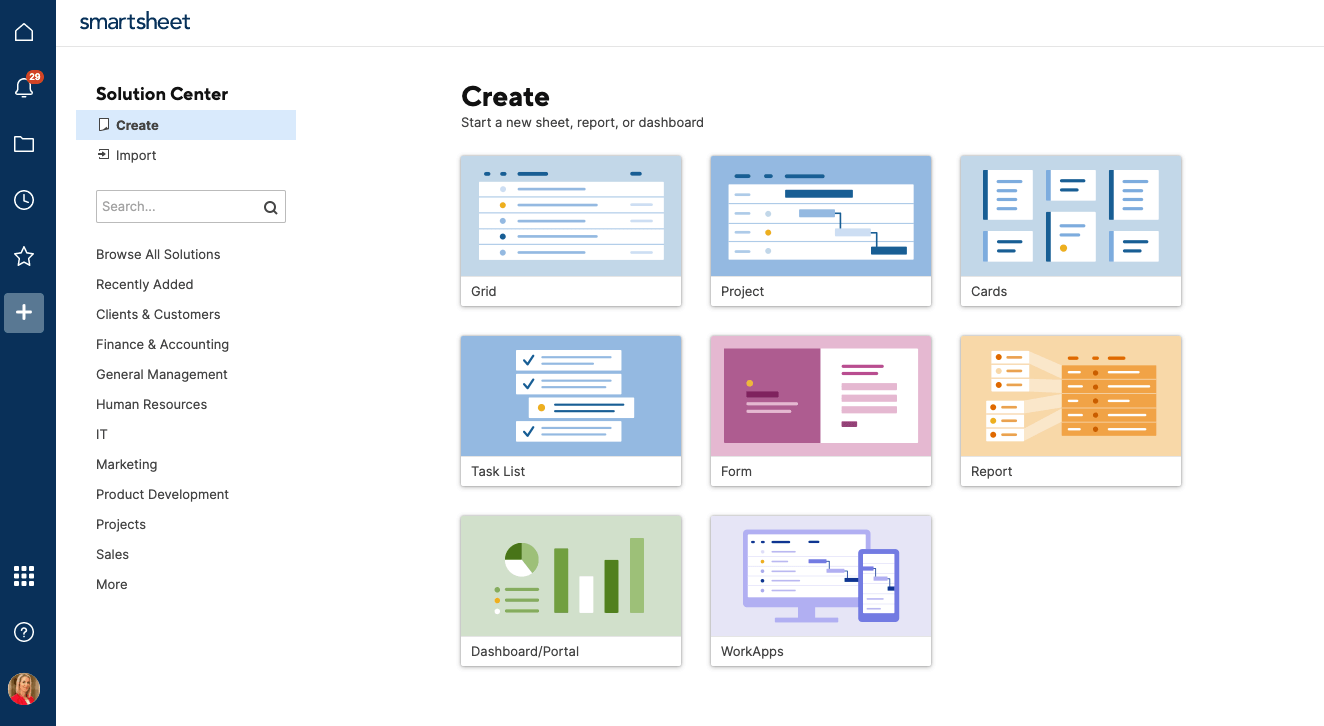
- To get started in Smartsheet dashboards, navigate to the + icon in Smartsheet and click Create.
- Select Dashboard from the list.
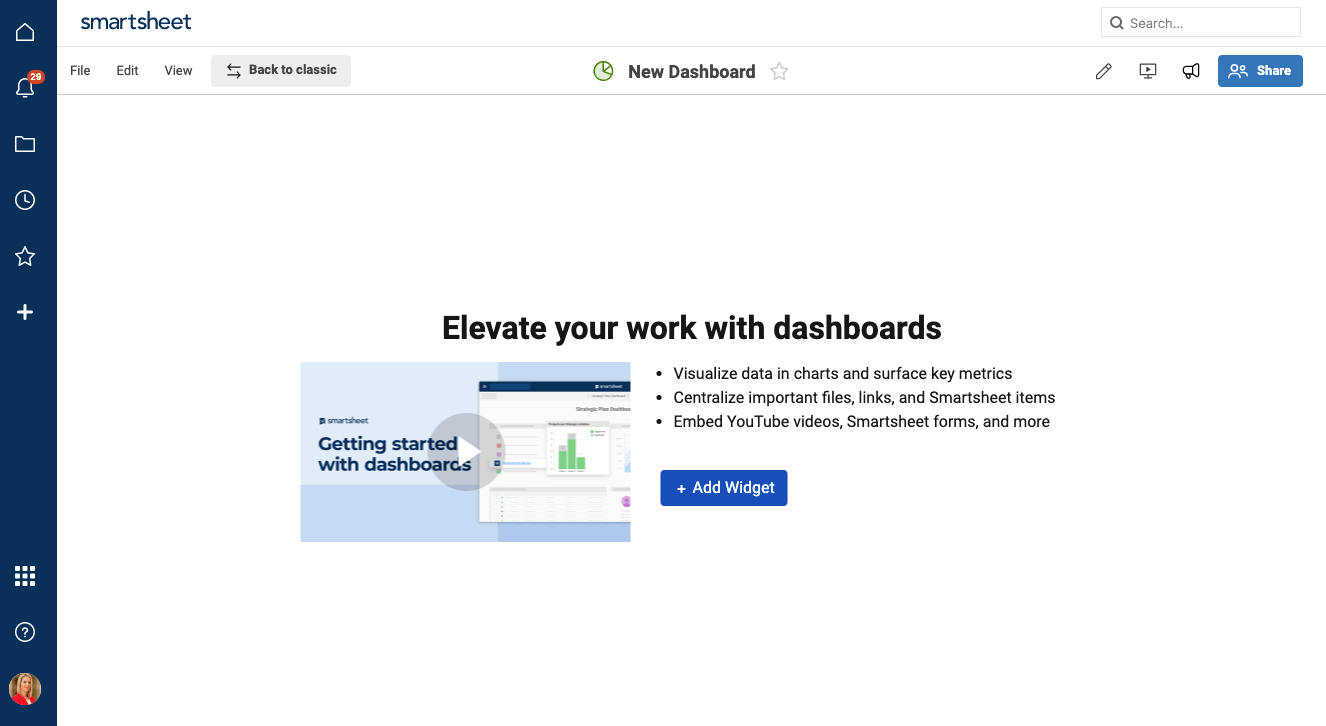
3. Name your dashboard. We’ll call ours Store Opening Dashboard. Click OK.
When you first open your dashboard, it will be a blank canvas. Smartsheet gives you full flexibility to create the dashbaord that best displays the information you want, so you’ll have to build your dashboard from the ground up.
Step 3: Build your dashboard with Widgets
- You’ll build your dashboard by adding Widgets, or interactive boxes of information designed to display key results, metrics, or other data points. Once created, widgets will look like tiles on your dashboard.
- Click +Add Widget at the top of your dashboard.
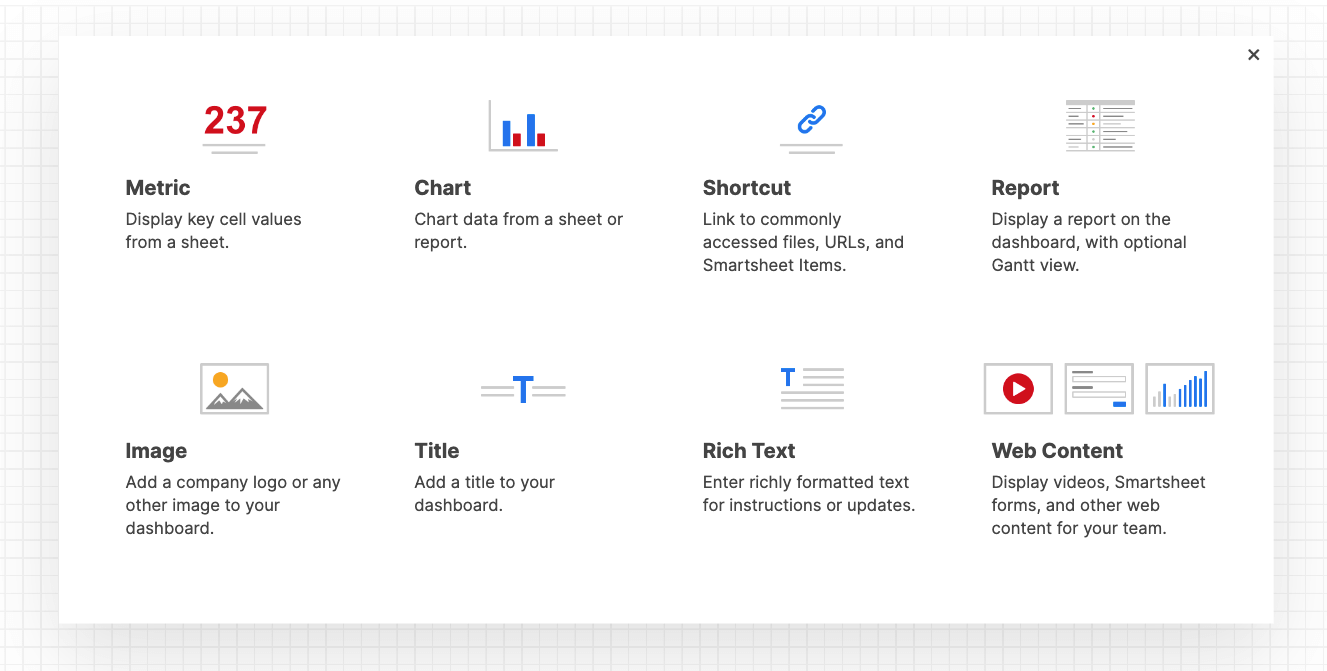
- There are seven different widget types to choose from.
- Metric and Sheet Data are used to surface specific data points from a sheet into your dashboard.
- Shortcut and Shortcut List widgets allow you to insert a URL into your dashboard, or link to other Smartsheet workspaces (sheets, reports, etc.).
- Use the Rich Text widget to create text boxes. This is useful for adding titles, instructions, or calling out certain met goals.
- The Report widget lets you display an entire report in your dashboard. A report acts like a high-level filter, and is great way to show summary information across multiple sheets.
- Finally, the Image widget allows you to insert an image directly into your dashboard.
4. Add Widgets
A. Add a Rich Text Widget
1. Select the Rich Text widget and add text to the field. You can adjust your text size and font, and play with colors and alignment directly in the widget - similar to the formatting functionality you would have in other text edit programs.
2. Click Done.
3. The newly created text widget will land on your dashboard canvas. You can move the widget around using drag and drop, or click and drag the widget’s corner to change the size. However, the best practice is to wait to adjust the size and layout of your widgets until you’ve created all of them.
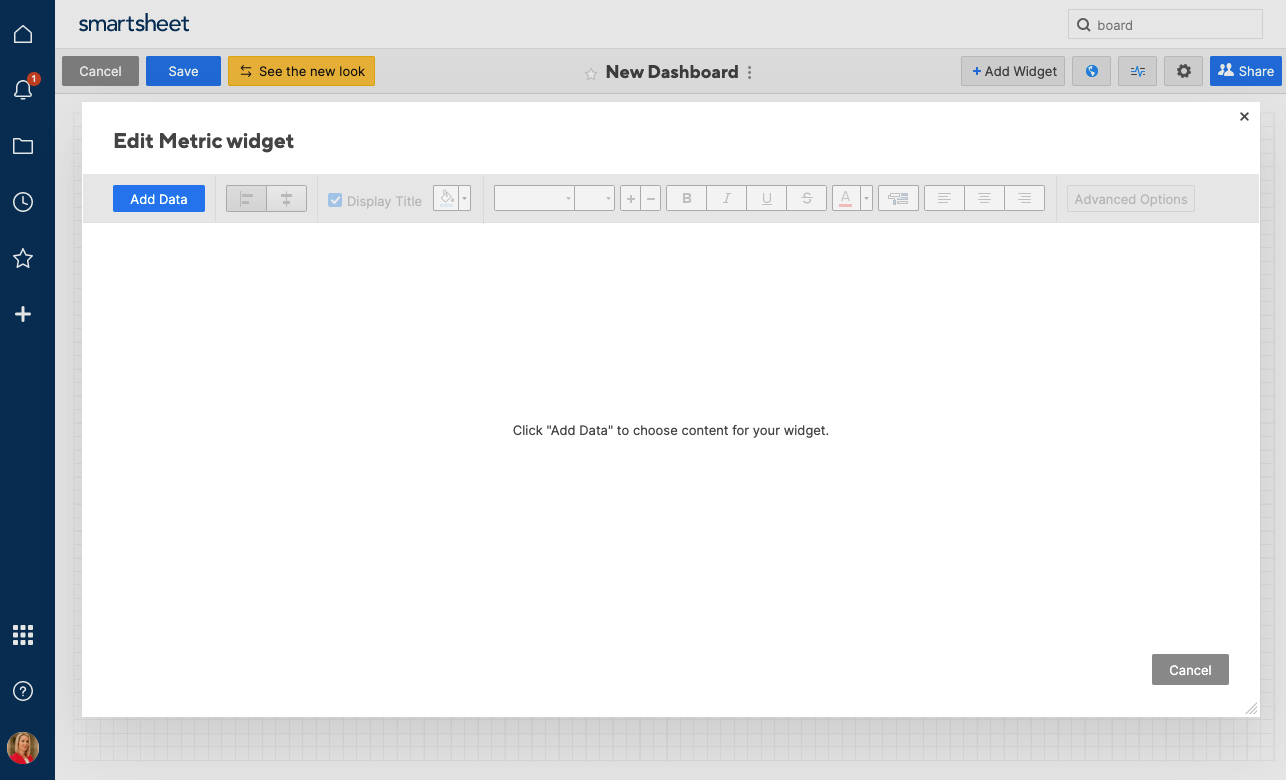
B. Add a Metric Widget
1. Click +Add Widget again, and select the Metric widget to display key values or metrics from the underlying sheet.
2. Click the Add Data button in the upper left hand corner.
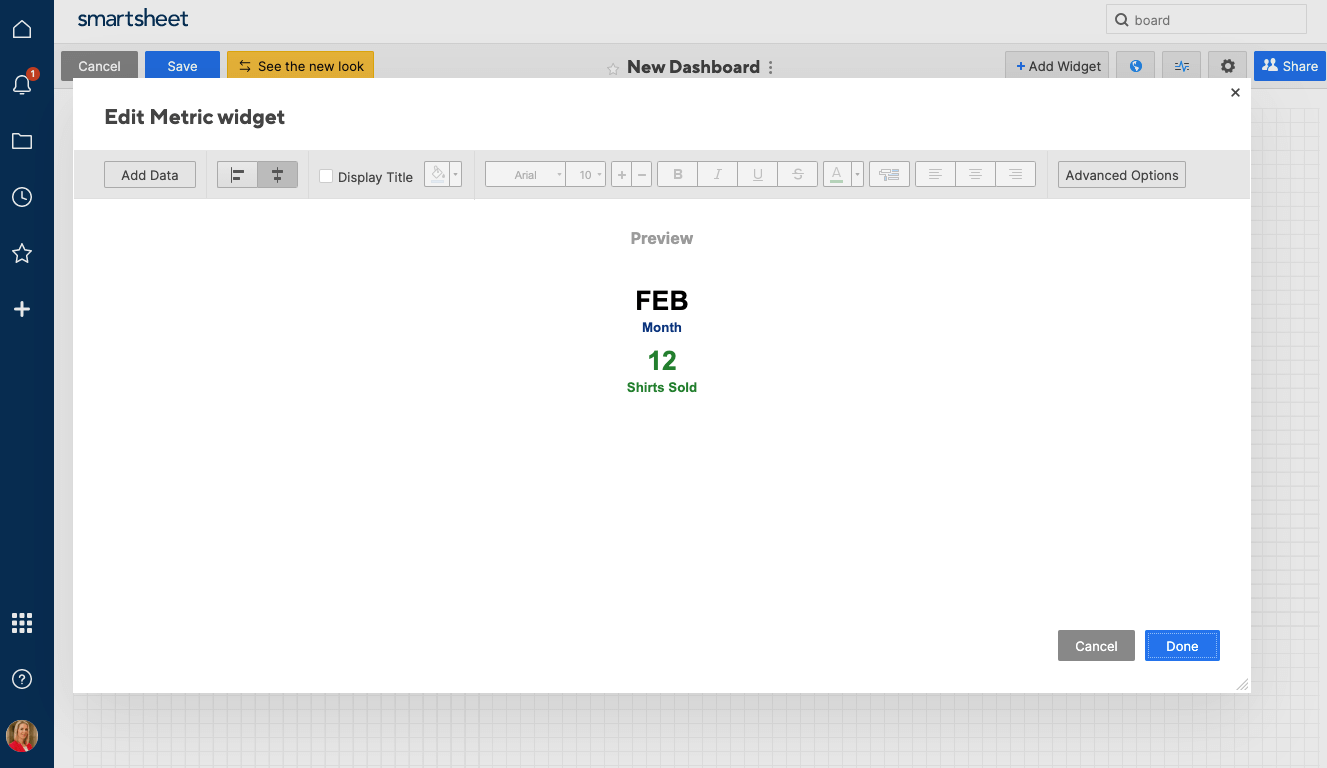
3. Search for your desired sheet, or scroll through all the available sheets and reports and select which one to pull data from.
4. Select the cell value or values you want to display in your dashboard, then click OK
*Your widget will now display these cells. It will create a default label based on the original column name, but you can re-label the cells by clicking into the label field. You can also create a title for the widget by checking the Display Title box and renaming the default title. You still have the full range of customizable options, so you can modify color, text size, alignment, etc.
5. Click Advanced Options in the top right-hand corner to create a clickable action for the widget.
6. Select the correct interaction from the options in the dropdown list:
- Do nothing
- Open the source sheet - this will link to the sheet that the Metric data is pulling from
- Go to a URL… - link to any URL
- Open a Smartsheet item - links to a different Smartsheet workspace
7. Click OK.
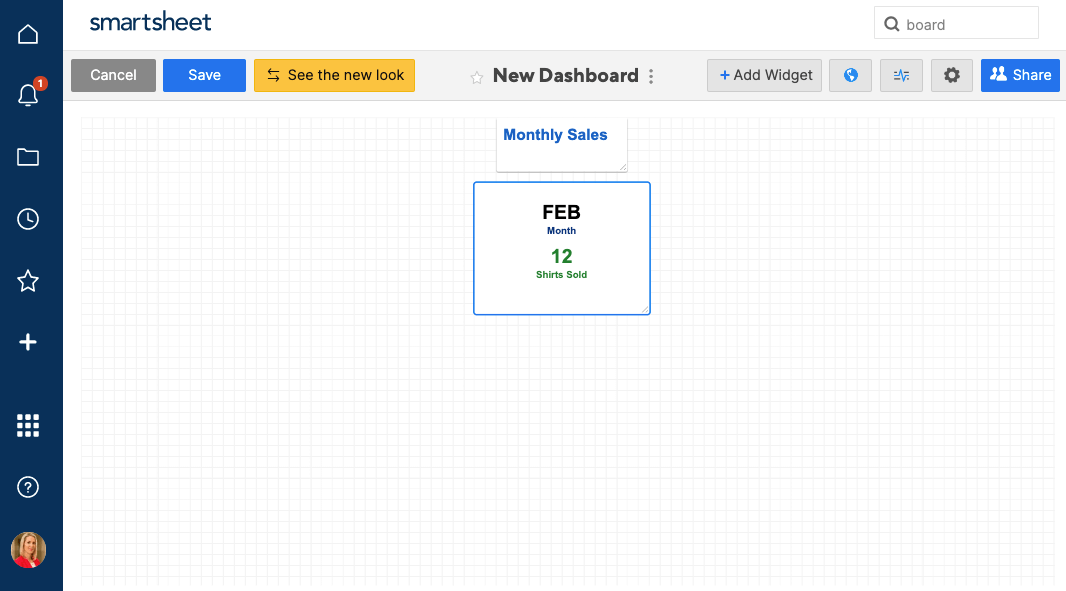
8. Click Done when you are finished editing your widget, and you’ll see it displayed on your dashboard.
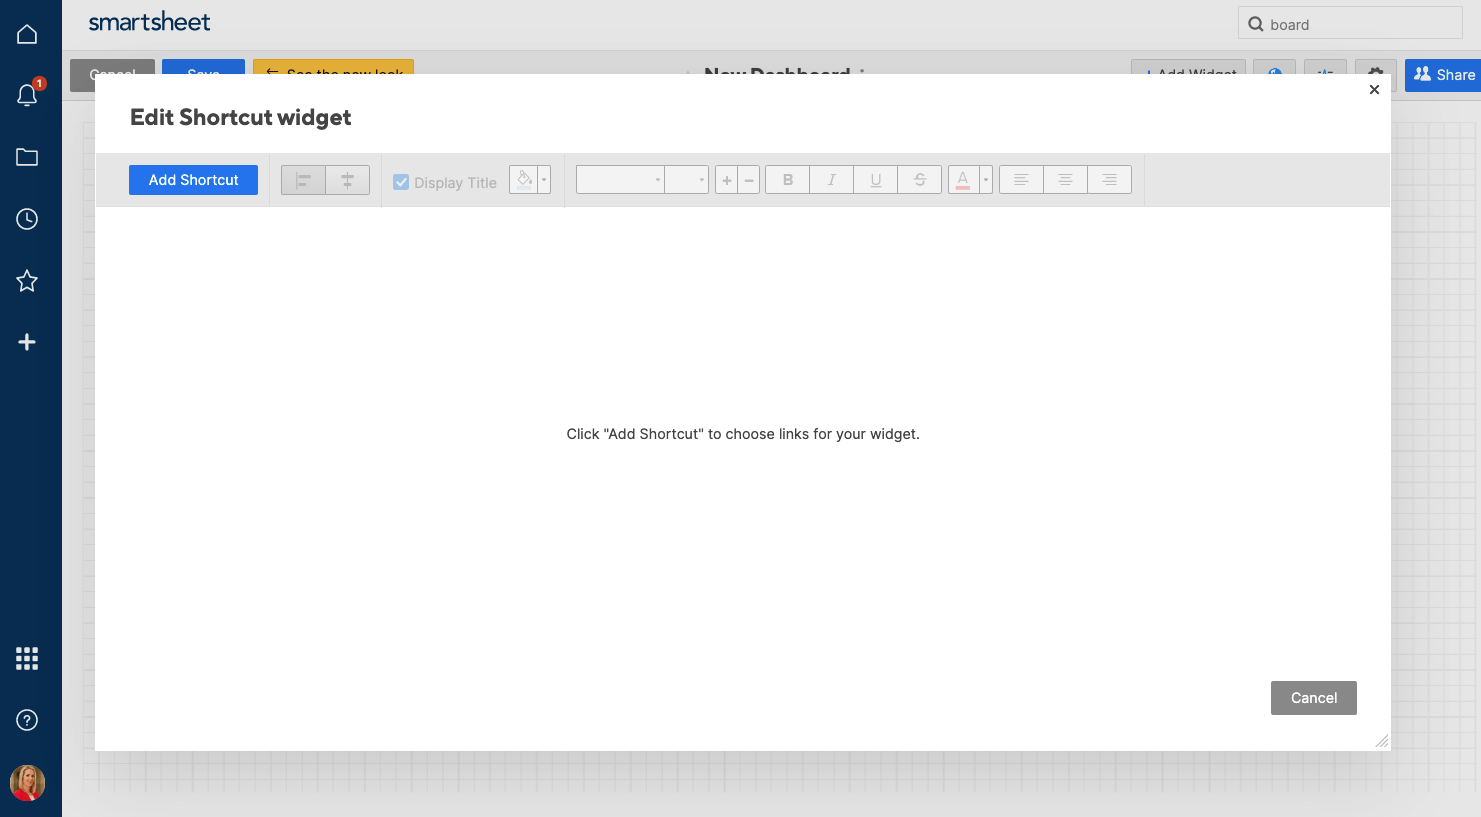
D. Add Shortcut Widgets
1. Shortcut Widgets will allow you create clickable links in your dashboard.
2. Click Add Shortcut… in the top left-hand corner.
*Now you have the option to link a URL, attach a live link to a file, or connect to another Smartsheet workspace.
3. In this example, we’ll link to two Smartsheet workspaces - a Contractor Performance dashboard as well as a Financial Performance dashboard. Scroll through the available Smartsheet items, or search for the one(s) you want. Click OK
4. The widget will pull these links into your widget in a list format with an icon. Change the default labels, text size and font, etc. to your visual preferences.
5. Click Done.
E. Create a Report widget
1. Click +Add Widget and select Report, which will surface an entire Smartsheet report - a high-level filter that allows you to view key insights into progress, data, or other work being done in Smartsheet.
2. Click Select Report in the upper left-hand corner.
3. Scroll through the available Smartsheet items and select the report you want to pull from. In this example, we’ll select the Retrofit Phase Report. Click OK
4. Once you’ve created the widget, you can choose to keep or remove original formatting from the report, or add a title. Just like the Metric widget, you can click Edit Interaction to give the widget a clickable property.
5. Click Done to drop your Report widget directly into your dashboard, and use drag and drop to adjust the size and orientation of your widgets.
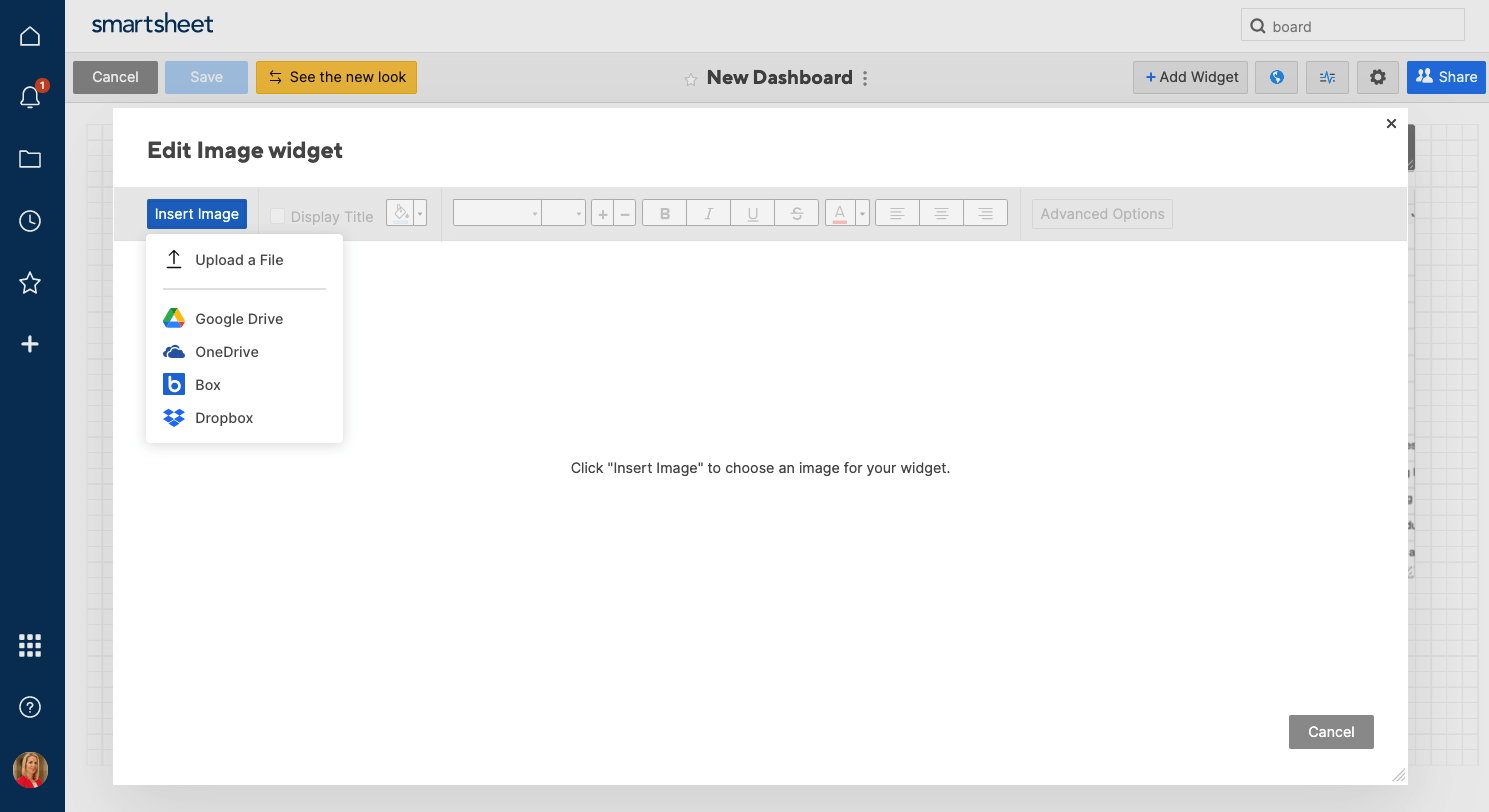
F. Add Image Widget
- Select the Image widget from the widget options.
- Select Insert Image in the top left-hand corner. You can now attach an image from your computer, or from one of several cloud services.
G. Add More Widgets
- If you want to add a similar widget to one you’ve already made, click the Plus icon. This is the Clone Widget button and will create a copy of the existing widget. Now, you can simply swap out the specific data point for another one you want to surface on your dashboard.
- Repeat these steps to include as many widgets as you would like to display in your dashboard.
This completed project management dashboard gives the project manager and other important stakeholders a clear, visual overview of the store opening project. The dashboard acts as an aggregate of all related tasks, project metrics, and status reports, so that team members can gain valuable insight into project progress at a glance.
Additionally, the data displayed in the dashboard is live, meaning that it will automatically update when data in the underlying sheets change. This ensures that all information is up-to-date so that the dashboard can give an accurate status update of all top-level data.
Step 4: Share your dashboard
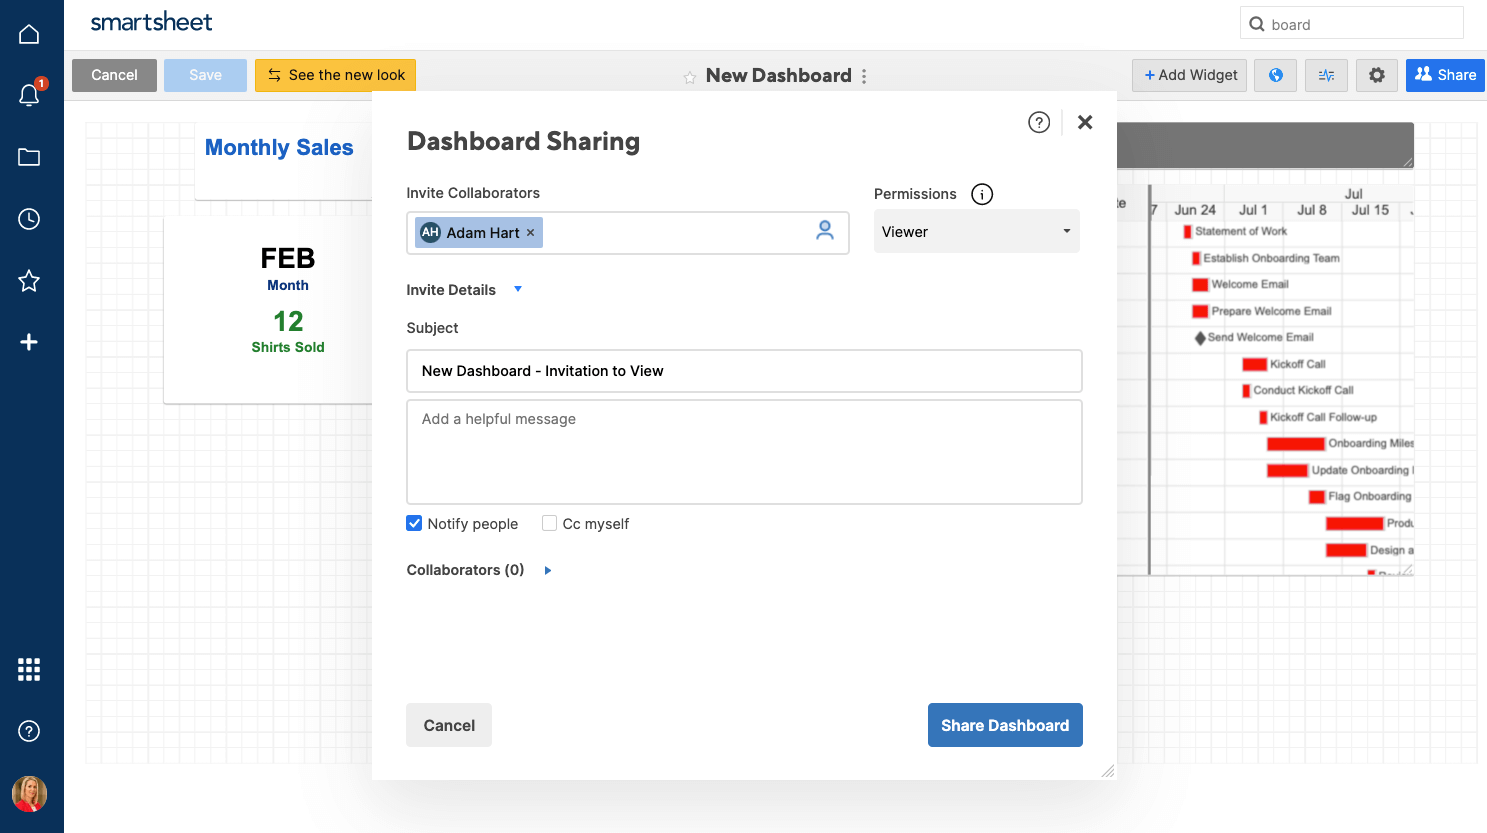
1. Select the Sharing button at the bottom of the page to share your dashboard with other team members.
2. Add the names of the people you want to share your dashboard to, and adjust their permission level. Admin permissions allow collaborators to edit the dashboard, while Viewer permissions only allow users to consume the information in a dashboard.
3. Add an optional personal message, and click Share Dashboard.
Follow the above steps to create a visual information hub to help you manage your project and track progress at a glance. A project management dashboard can be extremely useful for project managers of any project style or size. Remember, dashboard gives you the flexibility to curate and highlight the specific data types you want to surface, so you can manage your work your way.
Smartsheet Templates for Project Management
From simple task management and project planning to complex resource and portfolio management, Smartsheet helps you improve collaboration and increase work velocity -- empowering you to get more done.
The Smartsheet platform makes it easy to plan, capture, manage, and report on work from anywhere, helping your team be more effective and get more done. Report on key metrics and get real-time visibility into work as it happens with roll-up reports, dashboards, and automated workflows built to keep your team connected and informed.
When teams have clarity into the work getting done, there’s no telling how much more they can accomplish in the same amount of time. Try Smartsheet for free, today.

