How to Make a Gantt Chart Using the Table Function in PowerPoint
You can make a Gantt chart in PowerPoint using the table function to map tasks, timelines, and milestones. Add a table, adjust column widths, label the top row, and enter project tasks. Then insert and color task bars, add dates, and mark milestones with icons or shapes.
Follow the steps below to make a Gantt chart using the table function in PowerPoint:
Prepare Your PowerPoint Presentation
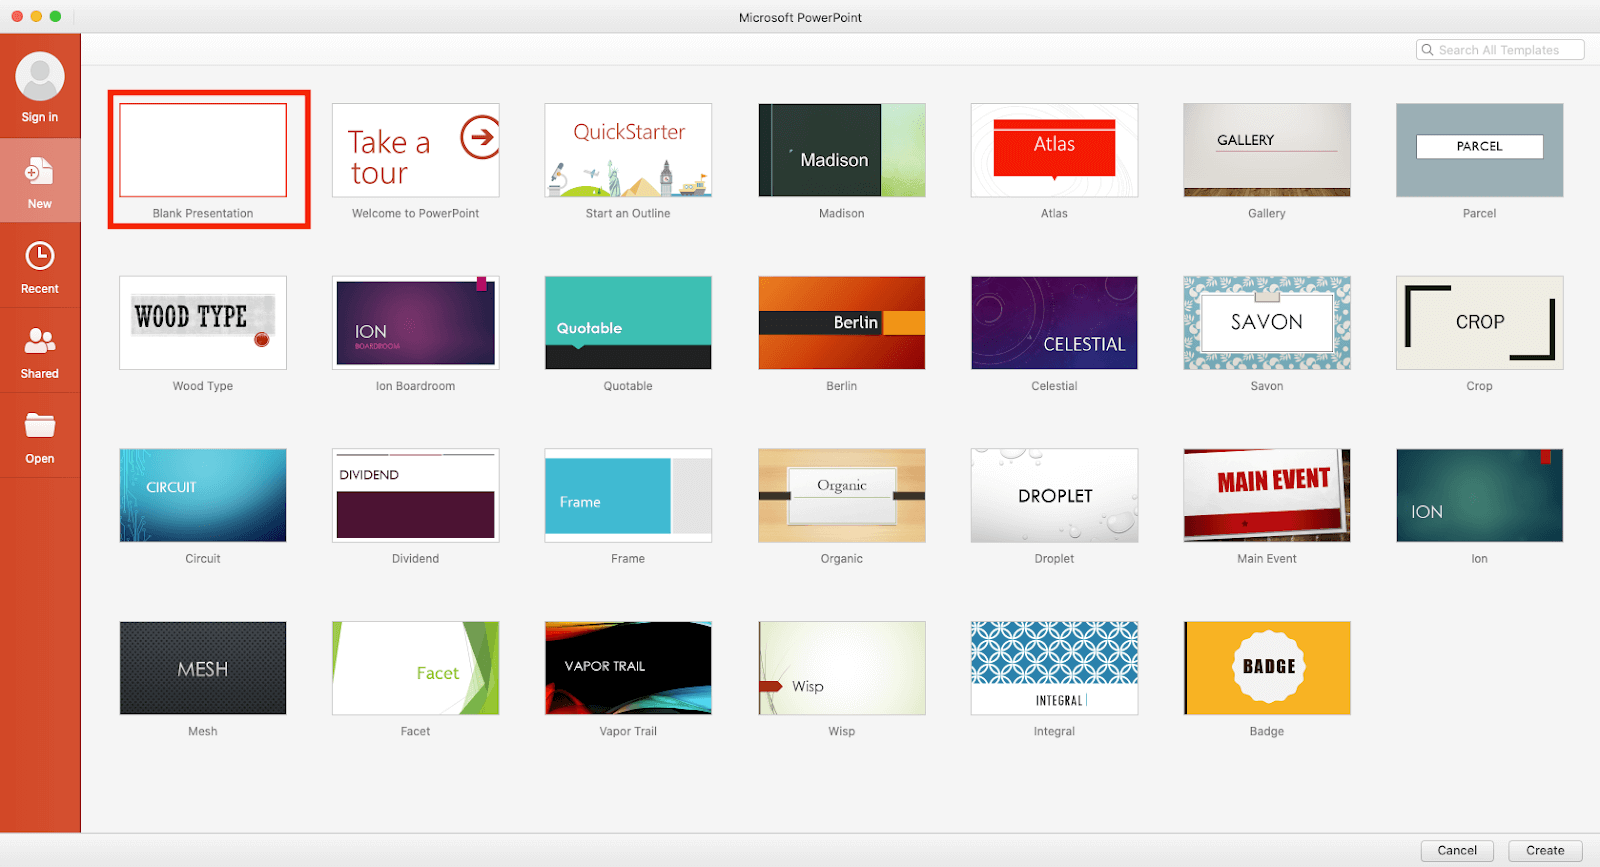
- Open a new PowerPoint presentation.
- Click Blank Presentation.
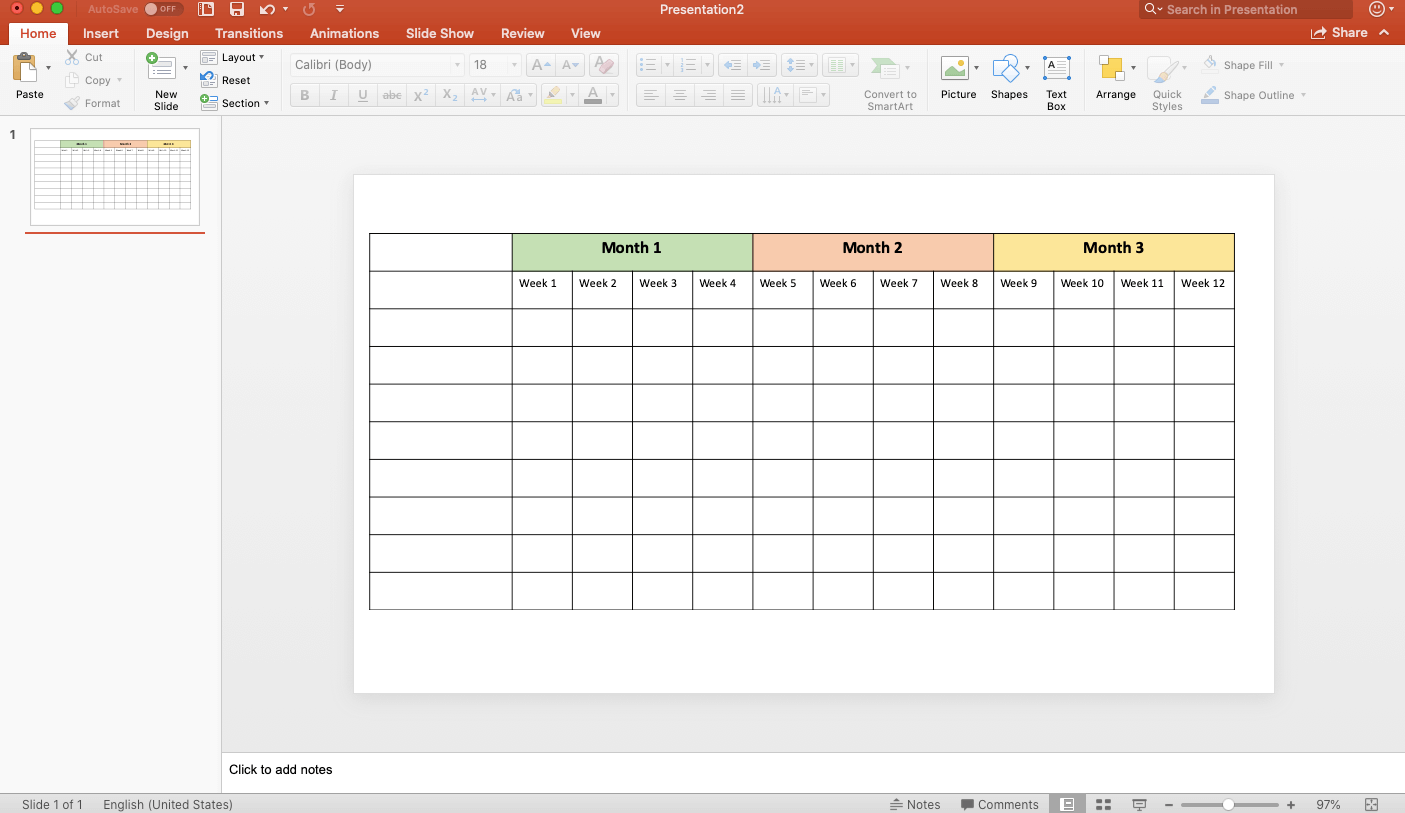
Add a Table to a PowerPoint Presentation
- Click the Layout dropdown menu on the Home tab on the top navigation bar, and click Blank to remove the Title and Subtitle text areas.
- Click the slide, click the Insert tab on the top navigation bar, and click Table.
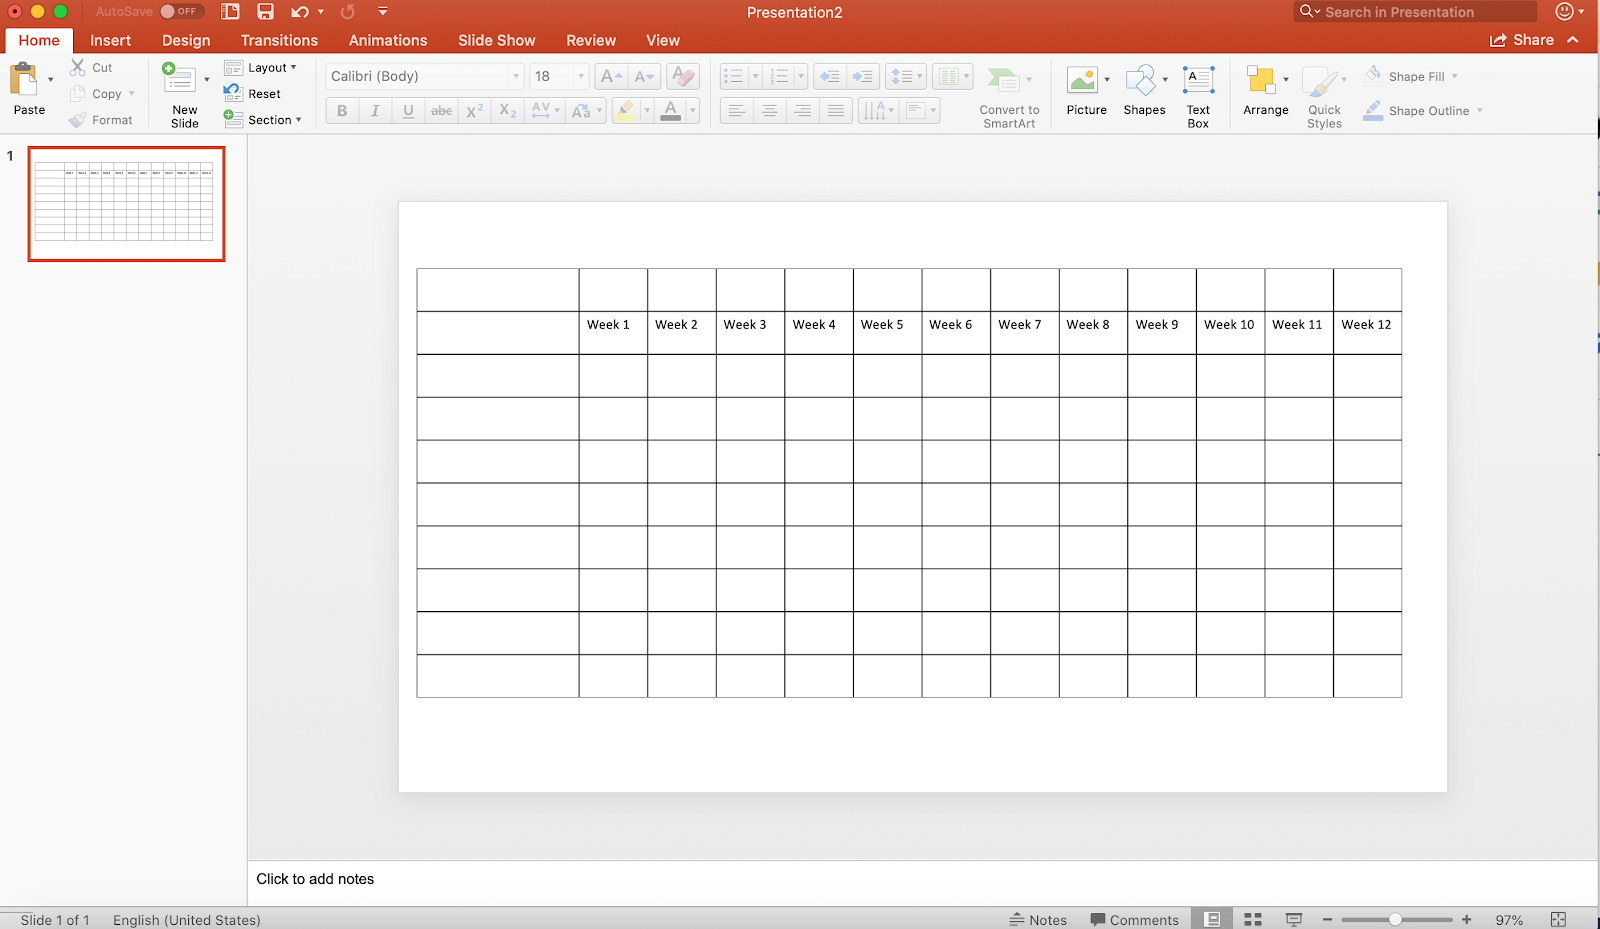
- Add a table either by selecting the number of rows and columns from the grid or by clicking Insert Table and inputting the number of rows and columns.
- For this example, add 13 columns and 10 rows to your table. Your numbers will depend on the amount of tasks that comprise your project (rows) and the duration, in weeks, that tasks will take to complete (columns). Click the OK button.
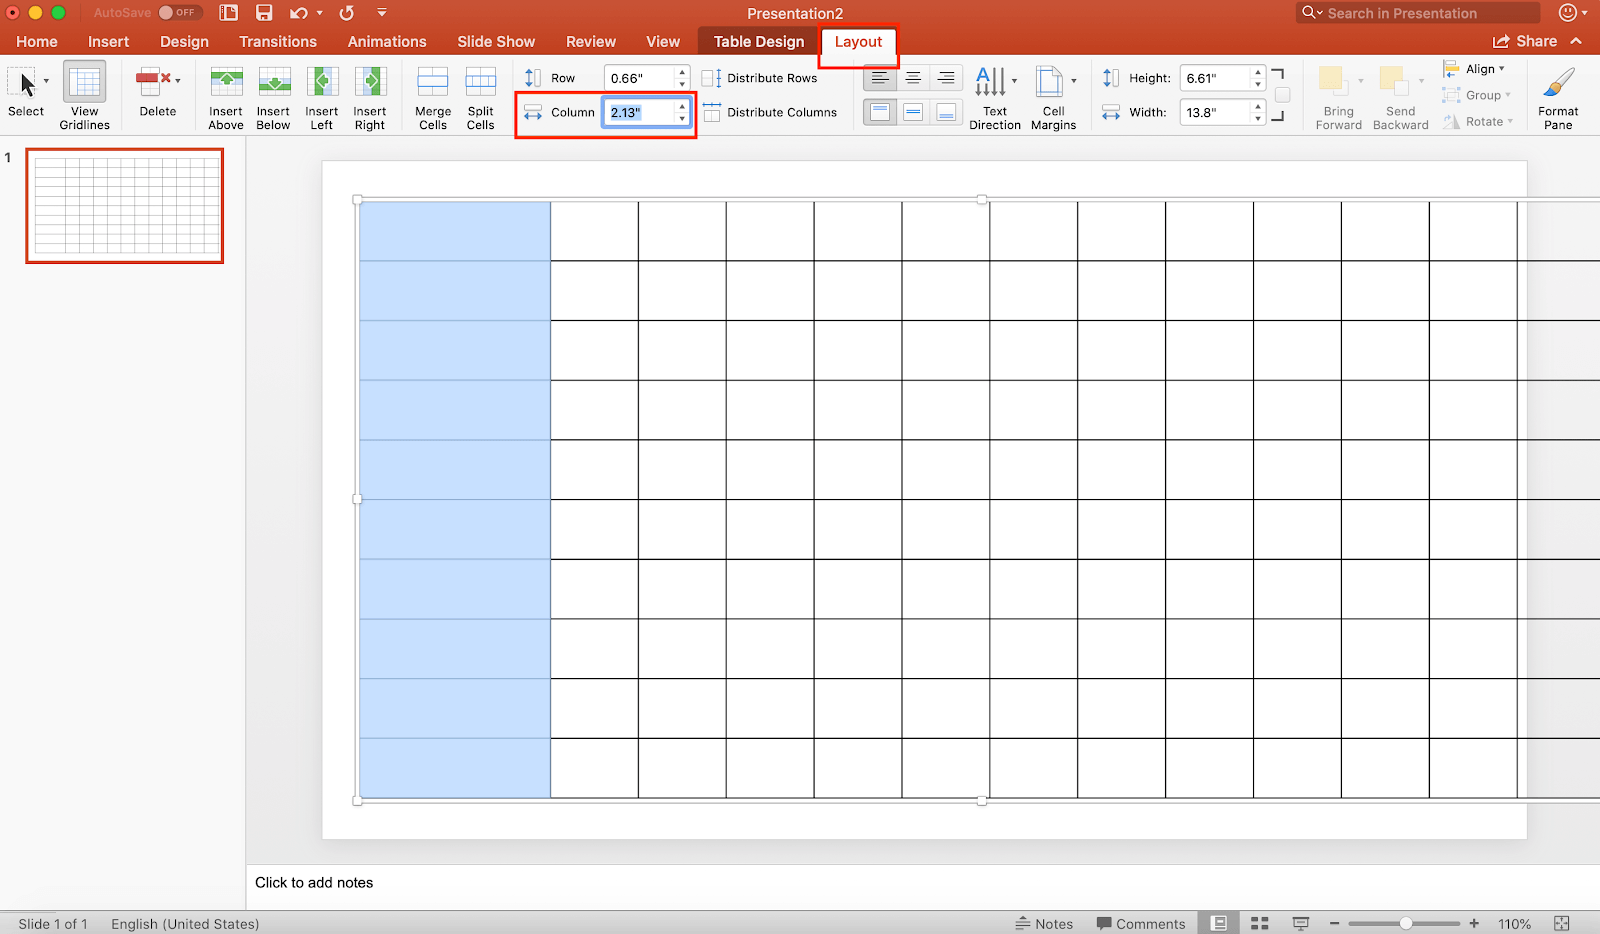
Adjust the Table’s Column Widths
- Highlight the first column.
- Click the Table Layout tab on the top navigation bar.
- In the Table Column Width box, enter 2.13.
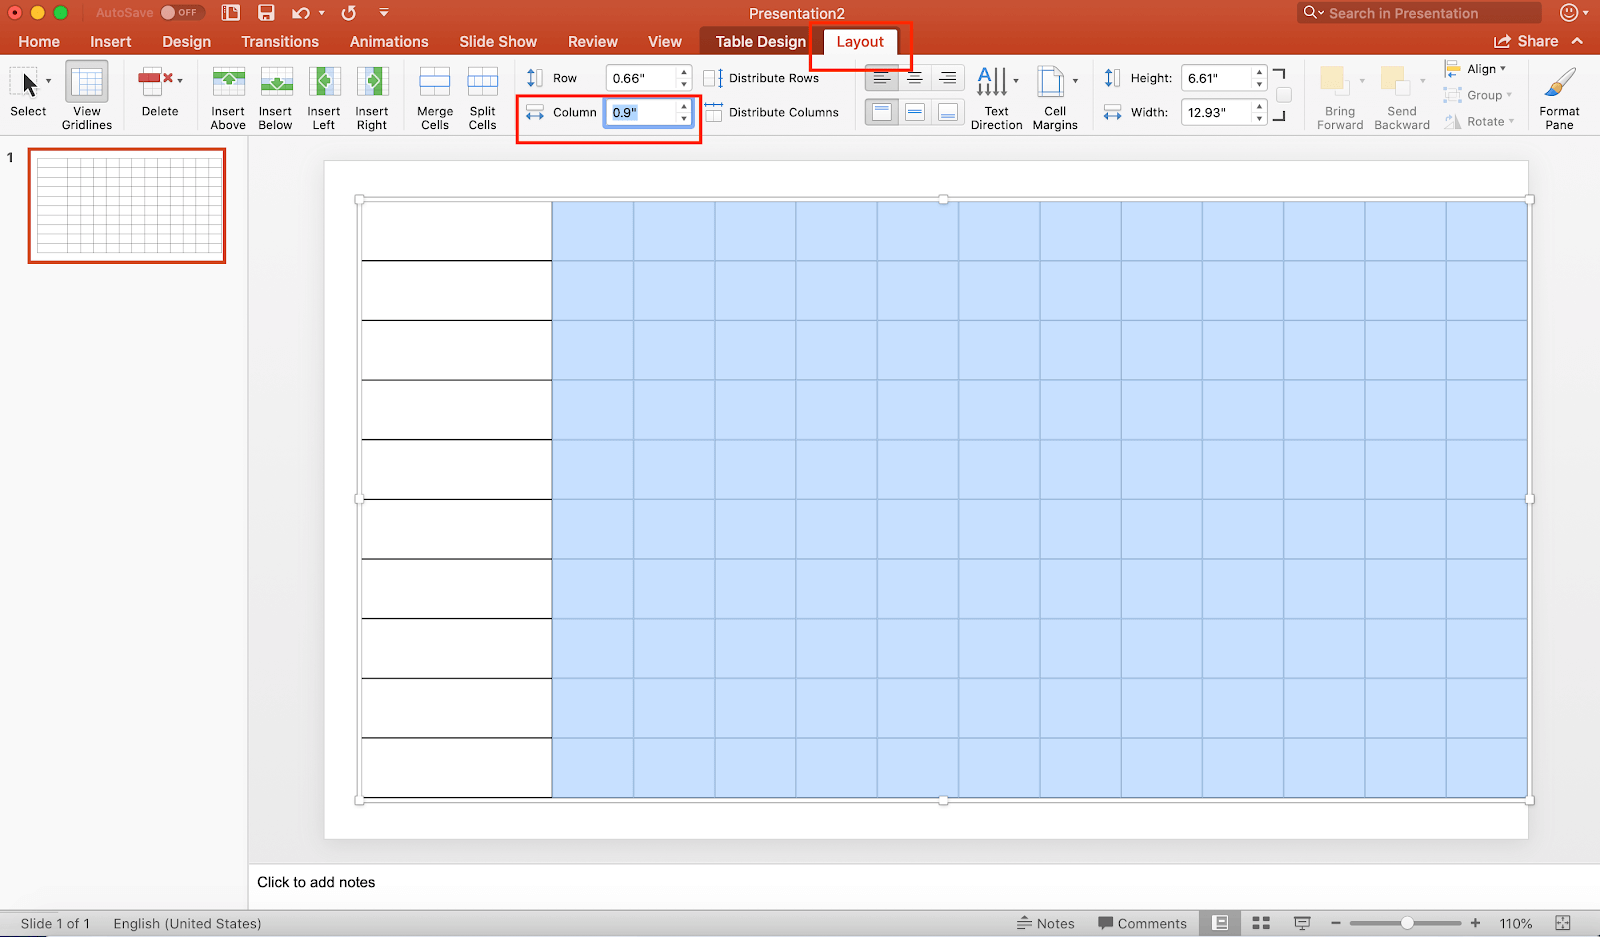
- Highlight the remaining columns in the table.
- In the Table Column Width box, enter 0.9.
Adjust the Color of Gridlines in the Table
- Highlight the table.
- Click the Table Design tab on the top navigation bar.
- From the dropdown menu, select 1pt.
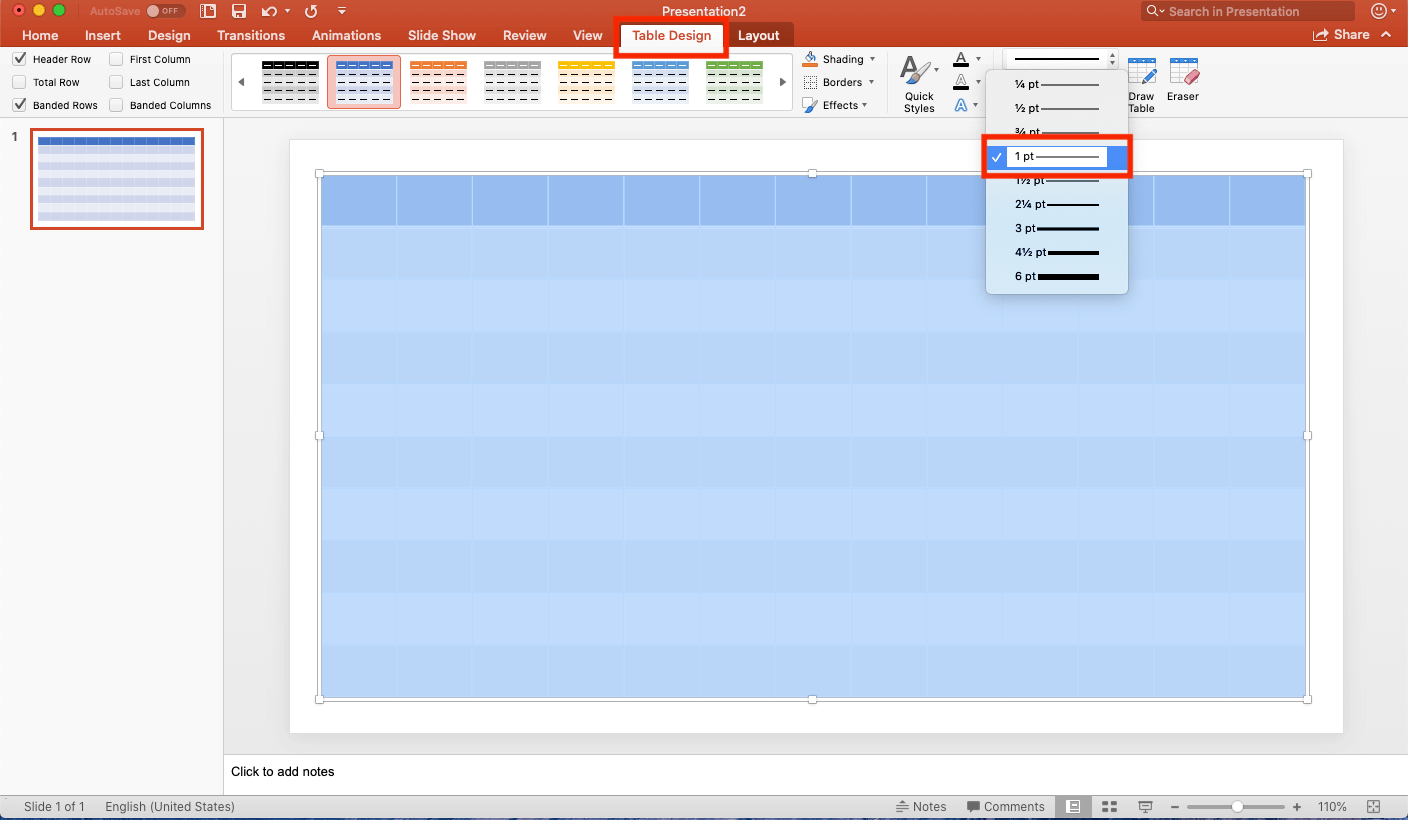
- Click the Borders dropdown menu, and click All Borders.
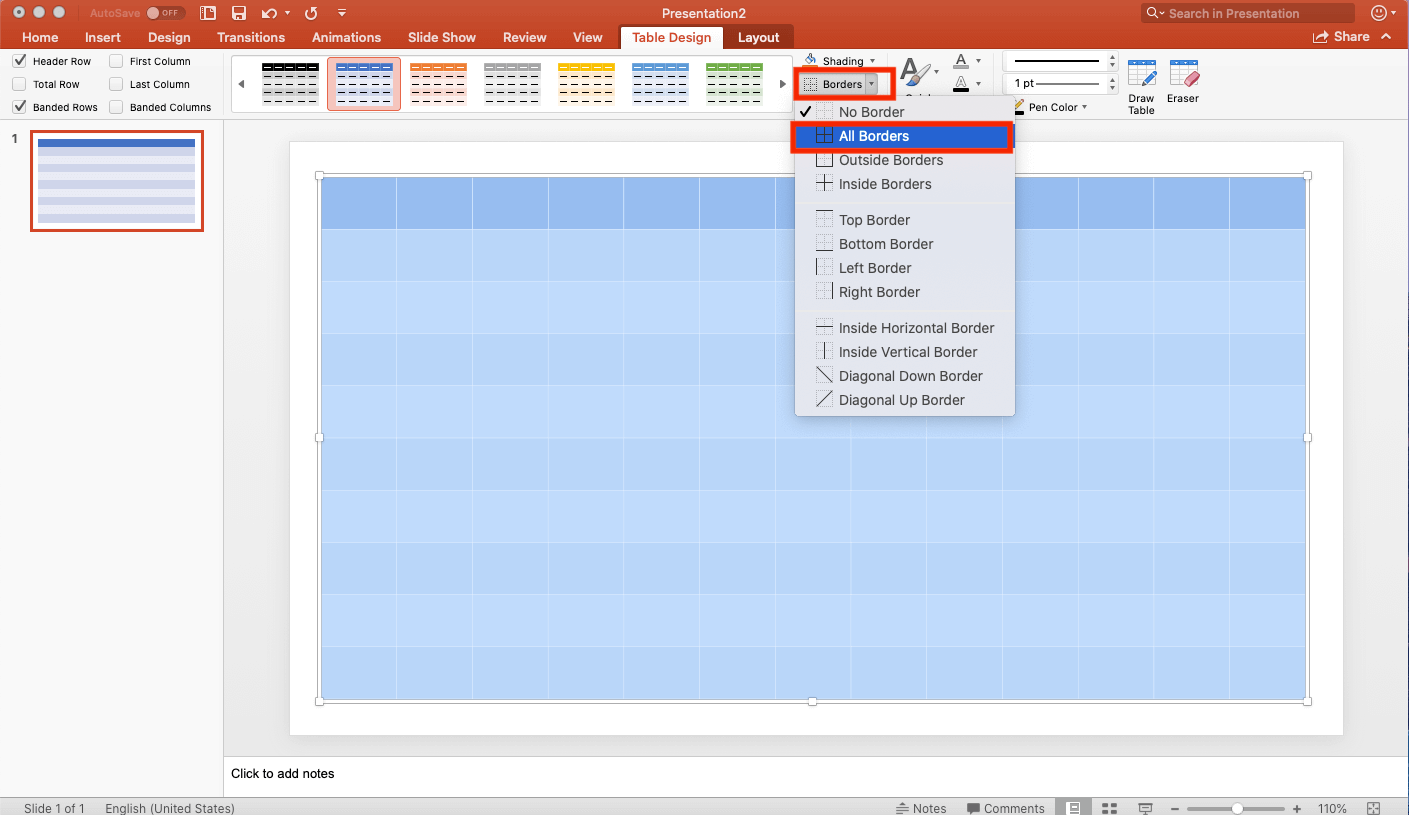
- Click the Shading dropdown menu, and click No Fill.
Add Labels to Table Columns
- In the second column, in the second row, type Week 1.
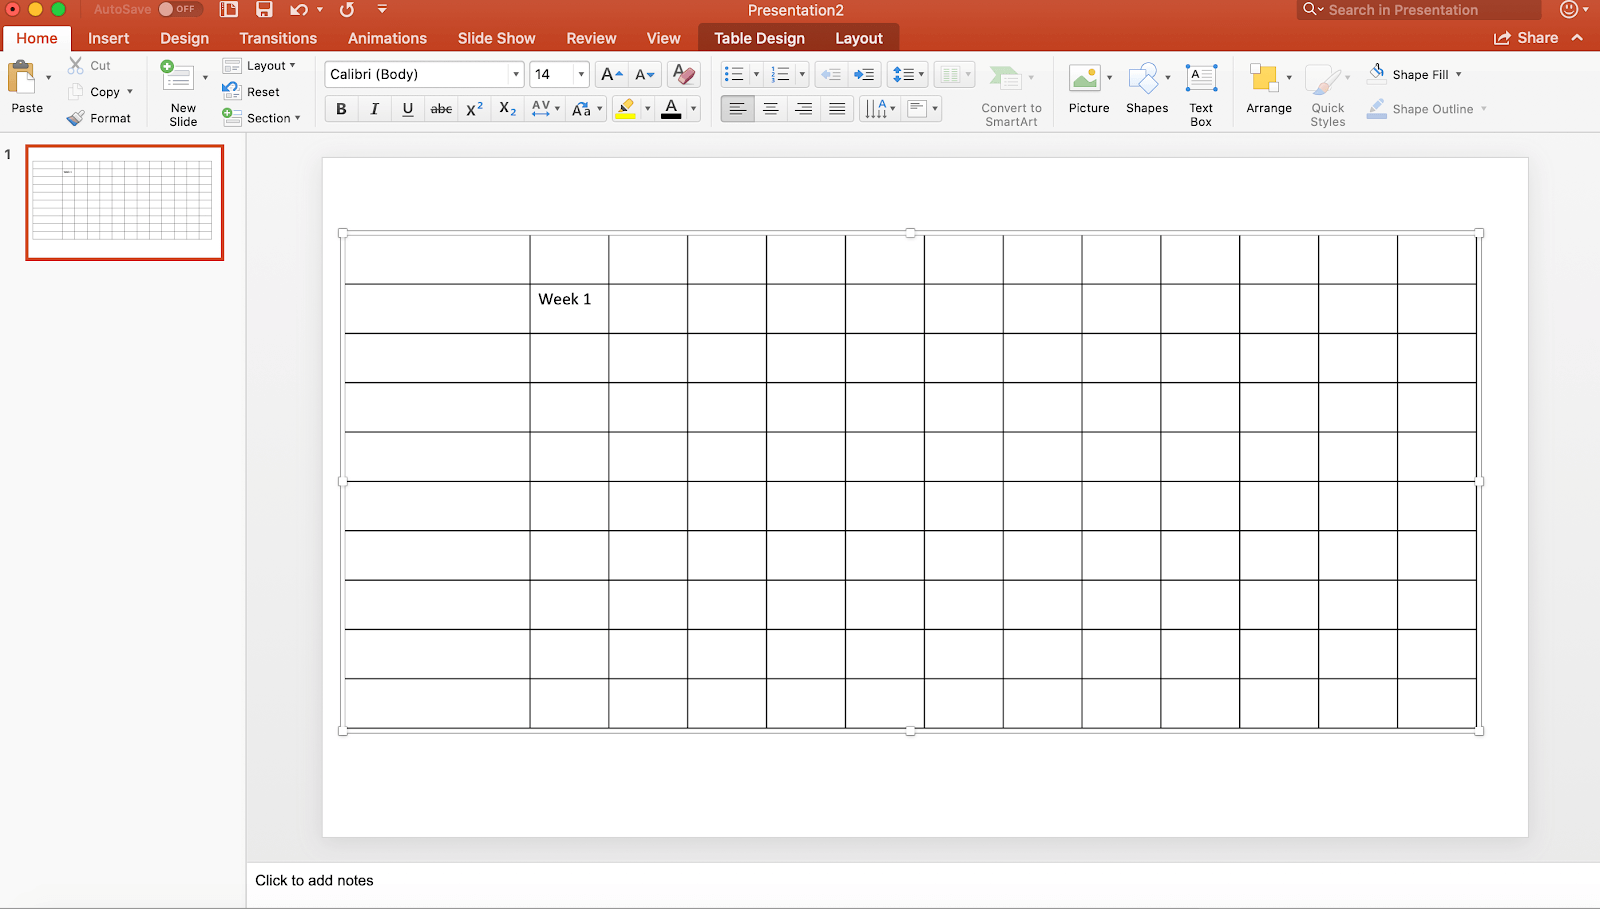
- In the following cells on row two, type the next corresponding Week (ex: Week 2, Week 3, and so on).
Merge Top Row Cells in the Table
- Click the Table Layout tab on the navigation bar.
- In the first row, highlight columns 2-5 (the cells above week 1-4).
- Click the Merge Cells button to create one cell from the selected cells.
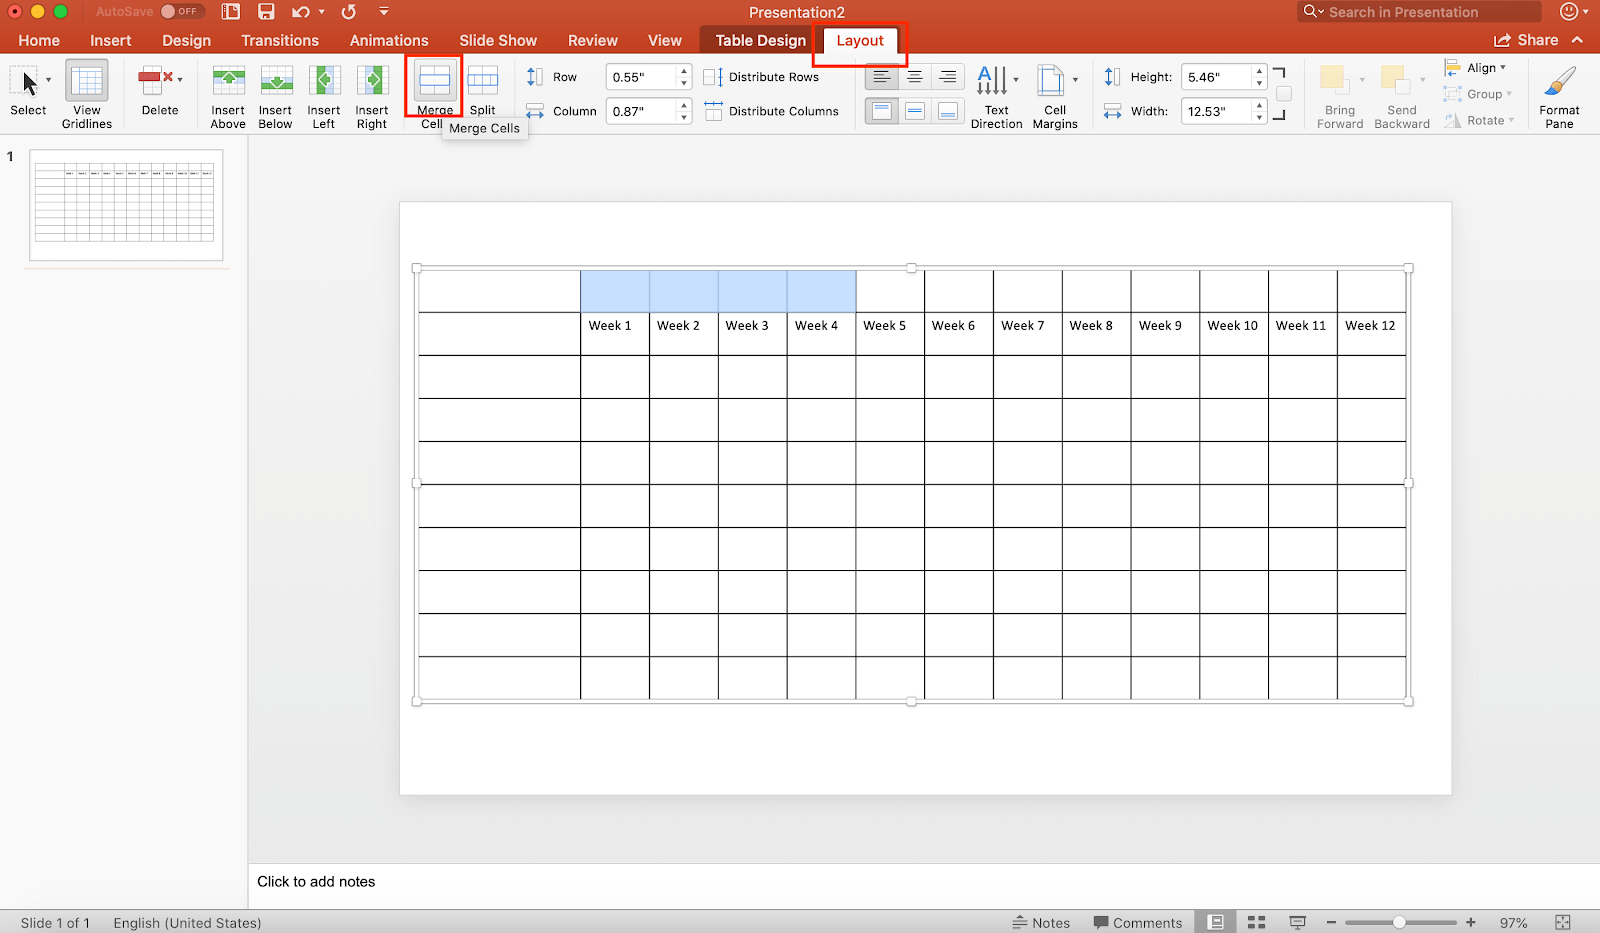
- In the newly merged cell, type Month 1.
- Repeat these steps for each set of the next four cells. Type Month 2 and Month 3 in the respective merged cells.
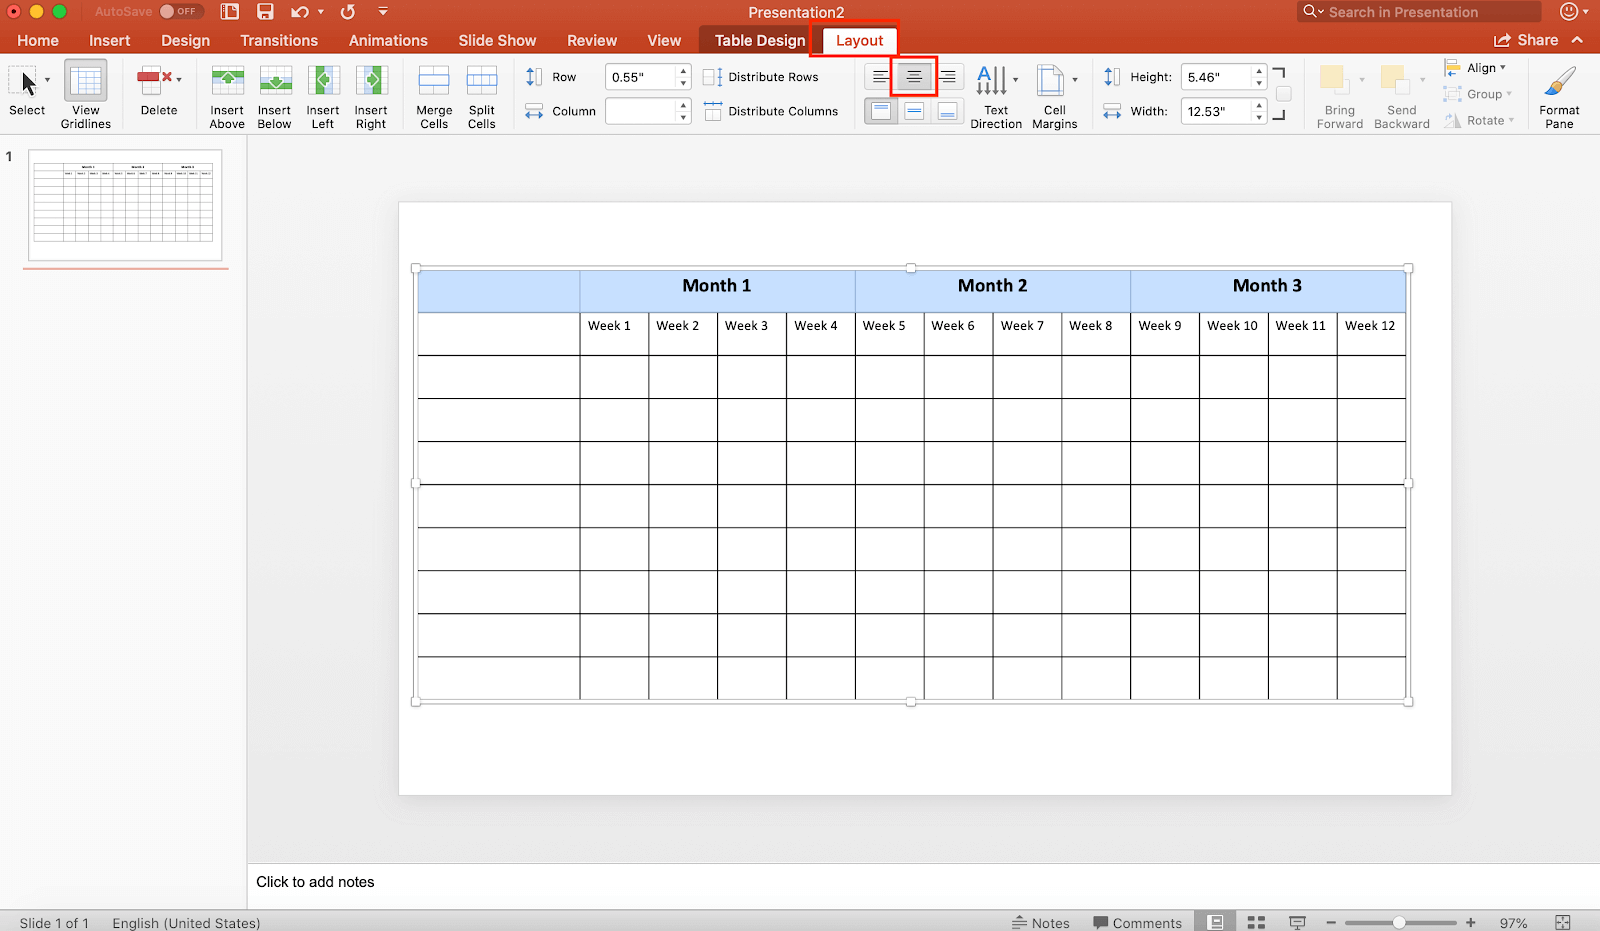
- Once you add all months to the top row, highlight the top row. Click the Center Align icon to center the labels in the merged cells.
Color Code the Top Row in the Table
- Highlight the merged cell labeled Month 1.
- Click the Table Design tab on the top navigation bar. Click the Shading dropdown menu, and click a color for the cell.
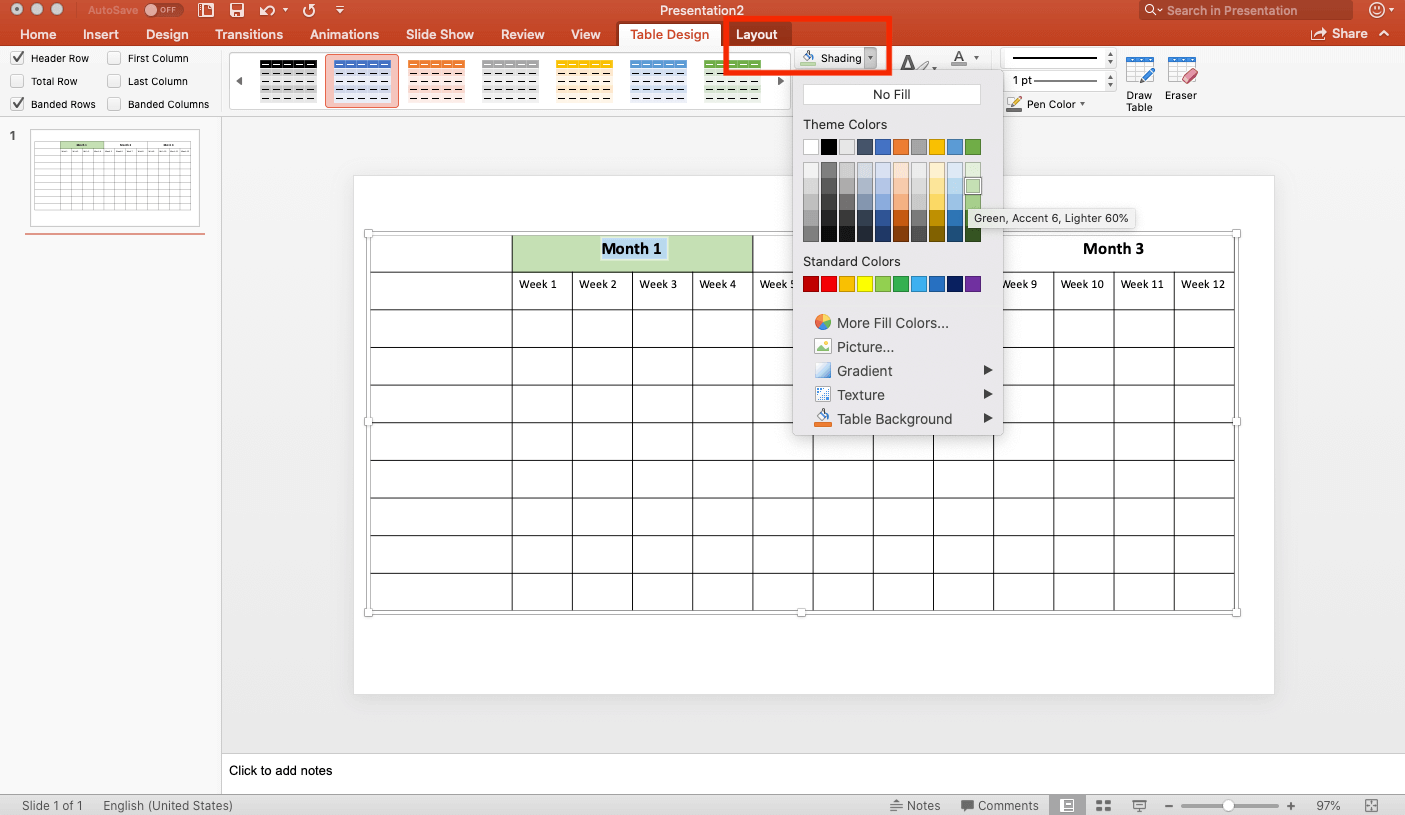
- Repeat these steps for the other merged cells.
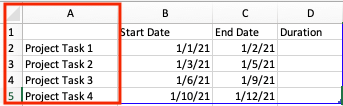
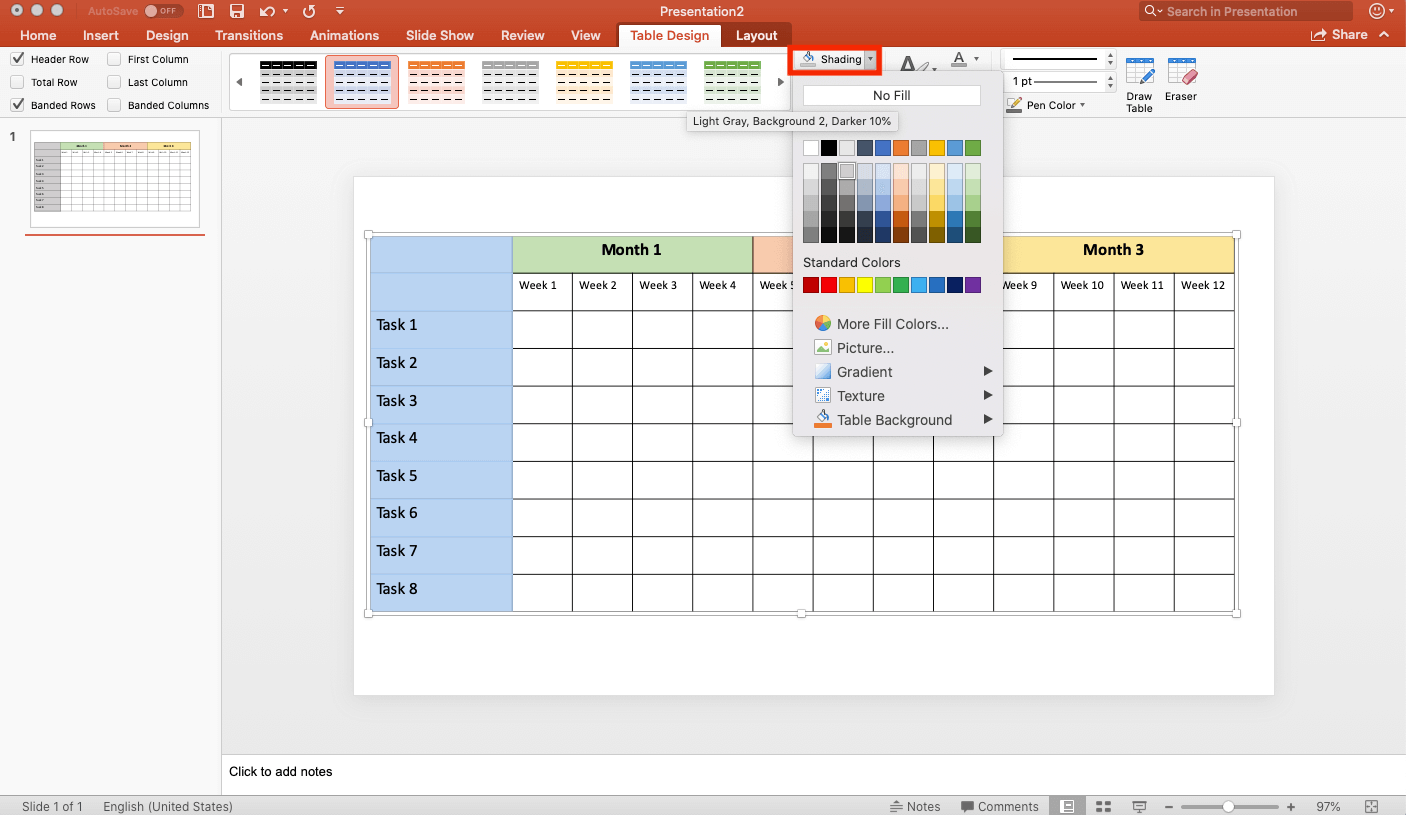
Add Project Tasks to the Table
- Type your first project in the third cell of the first column.
- List your respective project tasks, in order from start to finish, in the following cells in the column.
- Once you add all the tasks, highlight the column. Click the Table Design tab. Click the Shading dropdown menu, and click a muted grey color to differentiate the project task column.
Insert Task Bars in the Table
- Click the Insert tab on the top navigation bar.
- Click the second cell in the second row.
- Click the Shapes dropdown menu. In the Block Arrows section, click Arrow: Pentagon.
- Drag the shape from the start week to the end week. This shape signifies the project task’s start and end date.
Example: If a task starts in week one and ends in week three, the shape should extend from week one through week three.
- Repeat these steps for every project task listed in the table.
Pro Tip: If you need to change the project task start or end date in the table, click the task icon bar and move the shape to the appropriate spot on the table. You can also drag the front or back of the shape, lengthening or shortening it as necessary.
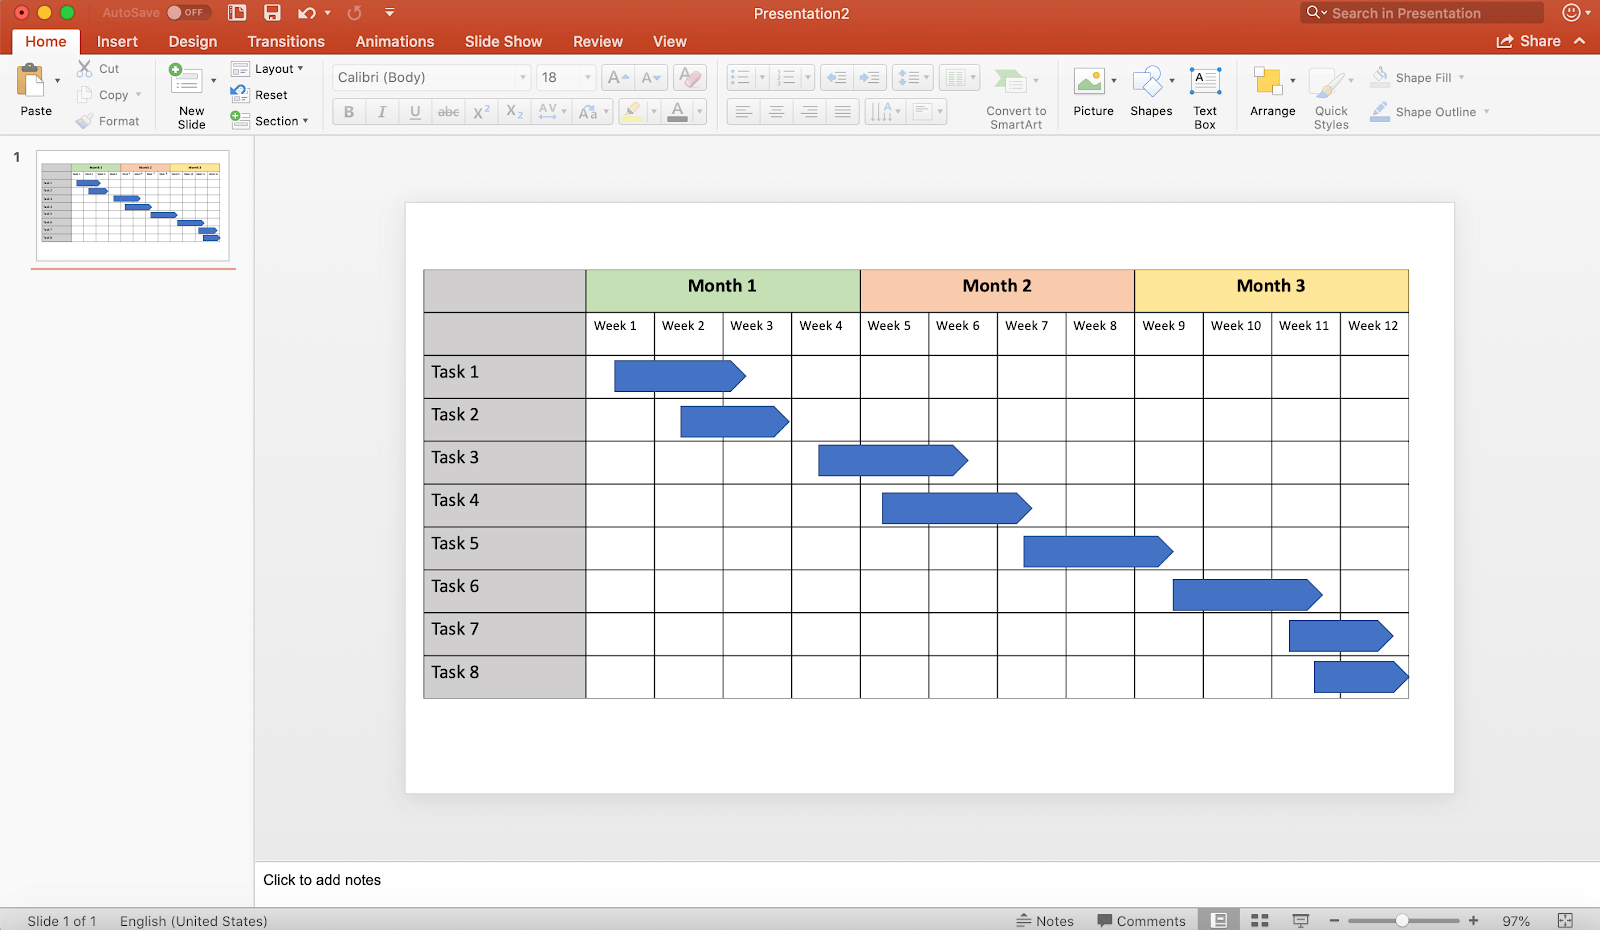
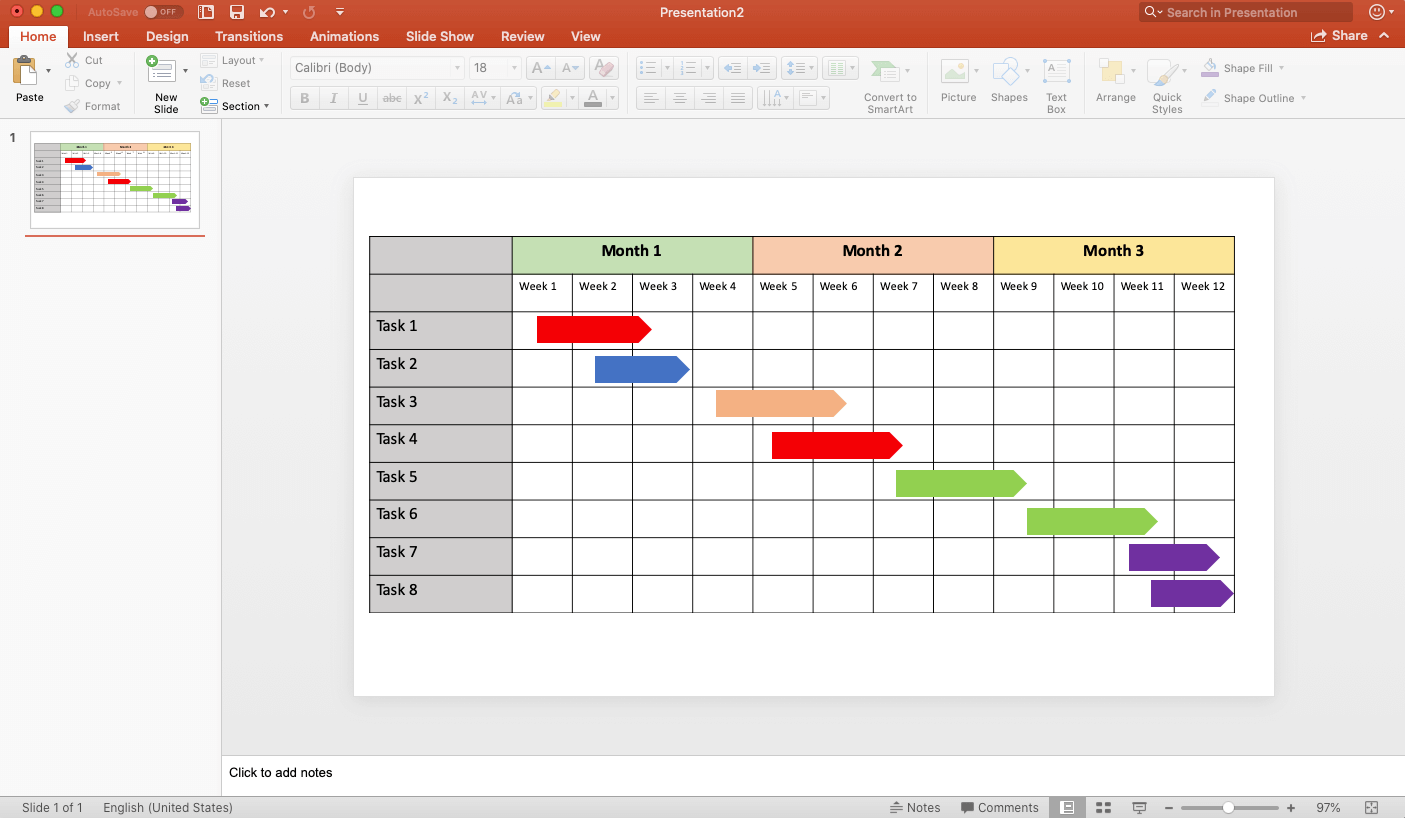
Customize the Task Bar Colors and Outlines in the Table
- Click one of the new task bars.
- Click the Shape Format tab on the top navigation bar. Click Shape Fill, and click a color (we chose red).
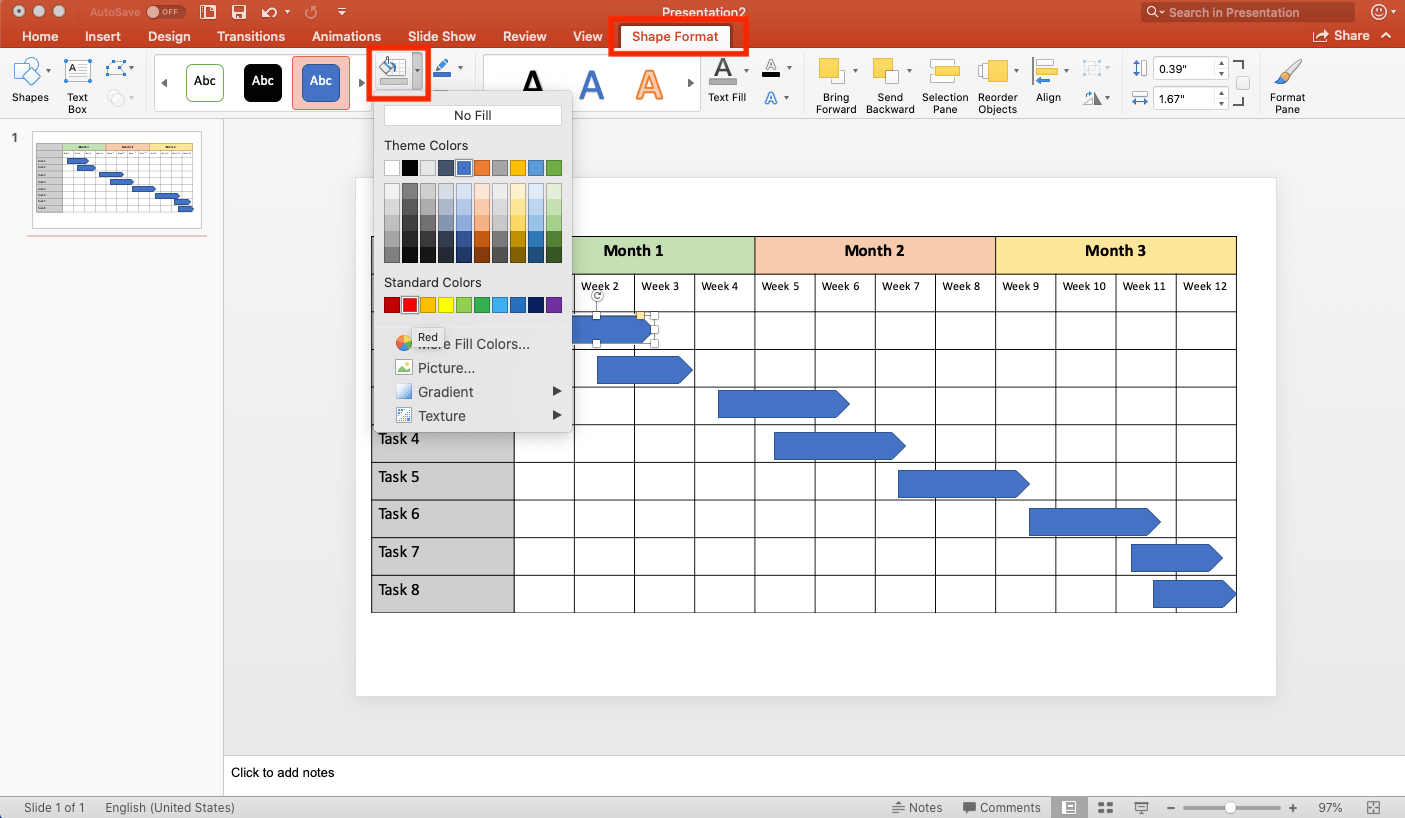
- Click Shape Outline, and click No Outline from the dropdown menu.
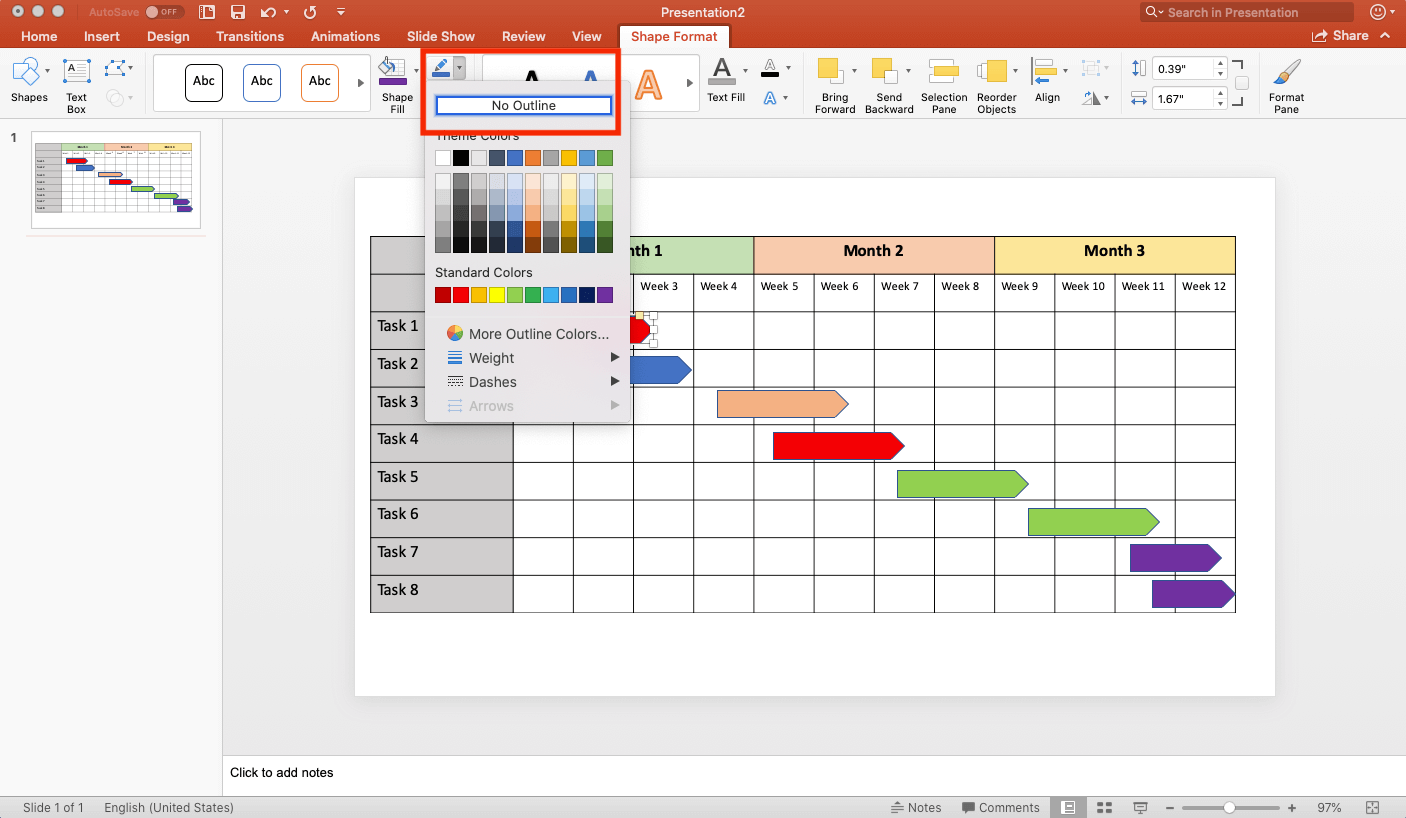
- Repeat these steps for every project task bar in the table.
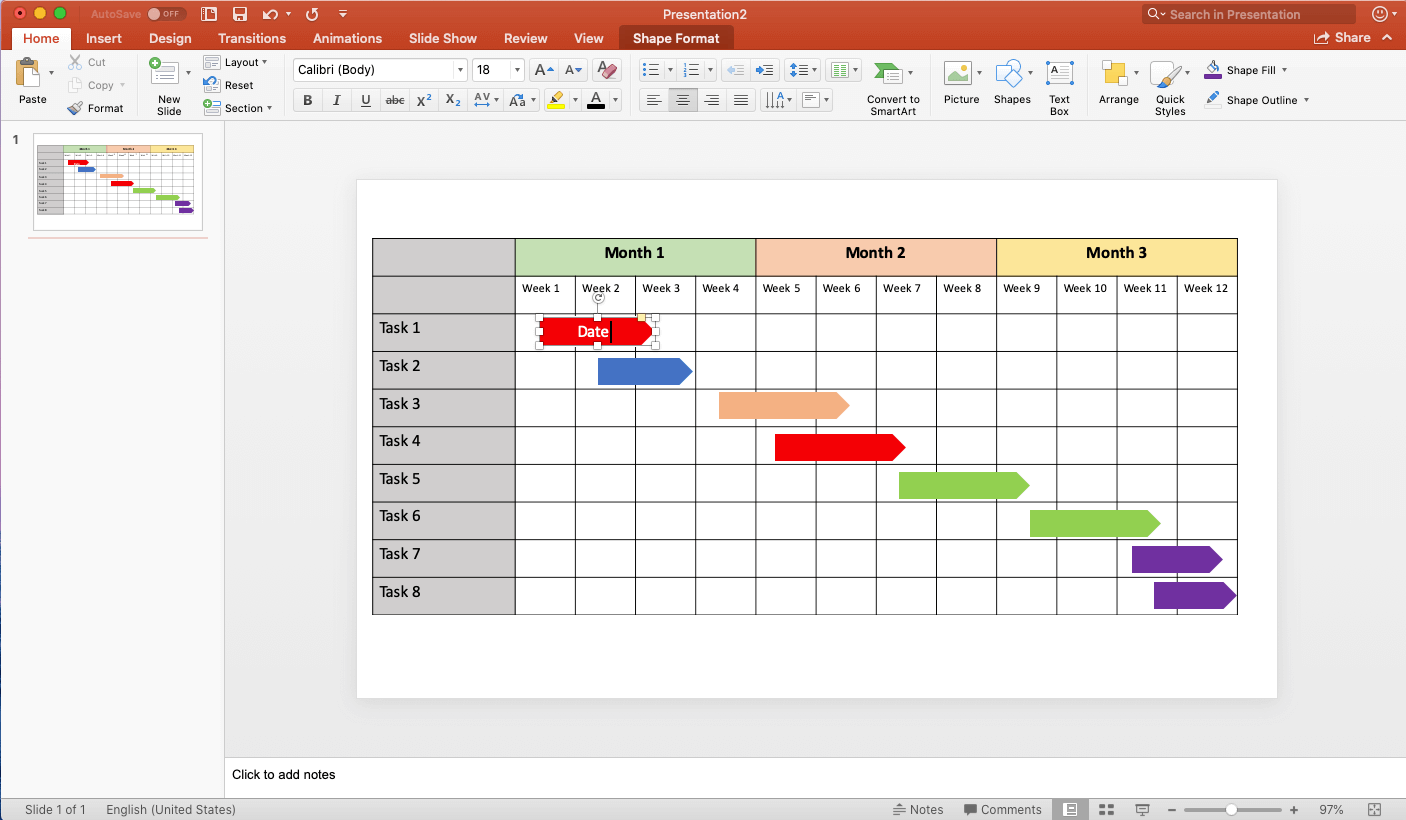
Add Dates to Task Bars to the Table
- Double-click on a task bar. A text box appears within the shape.
- Type the start and end date of the task within the shape.
- Repeat these steps for other project task bars where you want to see the date.
Add Milestones to the Gantt Chart
- Click the Insert tab on the top navigation bar. Click the Icons button.
- Type Drop in the search bar on the right panel.
- Click the Drop icon, and click the Insert button.
- Click on the icon and drag any of the four corners to reduce its size.
- Move the Drop to a place on the Gantt chart that signifies a milestone.
- Repeat these steps to add more milestones.
Pro Tip: Right-clicking on the icon, click Copy and then click Paste to make a duplicate version to use on the Gantt chart.
Learn more about visualizing and tracking project tasks, durations, and dependencies with this step-by-step guide and video how-to for making a create a Gantt chart in Google Sheets.
How to Create a Gantt Chart Using a Template in PowerPoint
You can use a template to build a Gantt chart in PowerPoint and plan your project step by step. Add your tasks, adjust timelines, assign owners, and mark milestones directly in the slide. It makes it easy to show what's happening and when in a clear, visual format.
Follow the steps below to create a Gantt chart using a template in PowerPoint:
- Download and open the Simple Gantt Chart Template in PowerPoint .
- Go to the second slide of the presentation, which houses the Gantt chart.
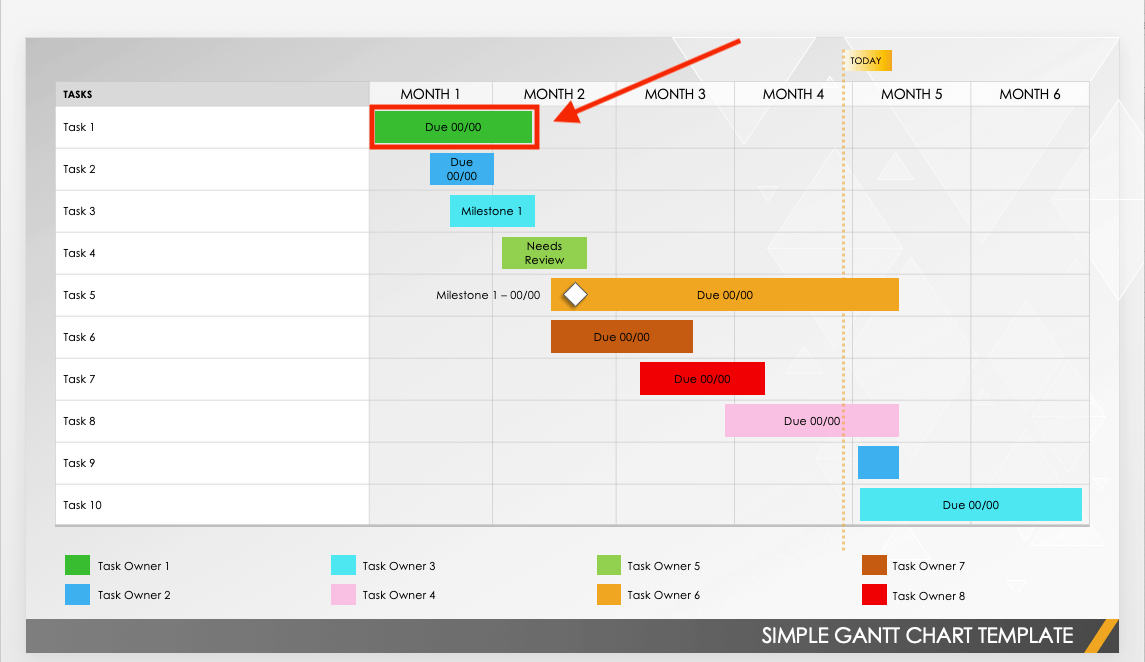
- Enter all project tasks in the first column.
- Move task bars along the chart to show when each task should start and end.
- Increase and decrease the size of each task bar to show the total duration of each task.
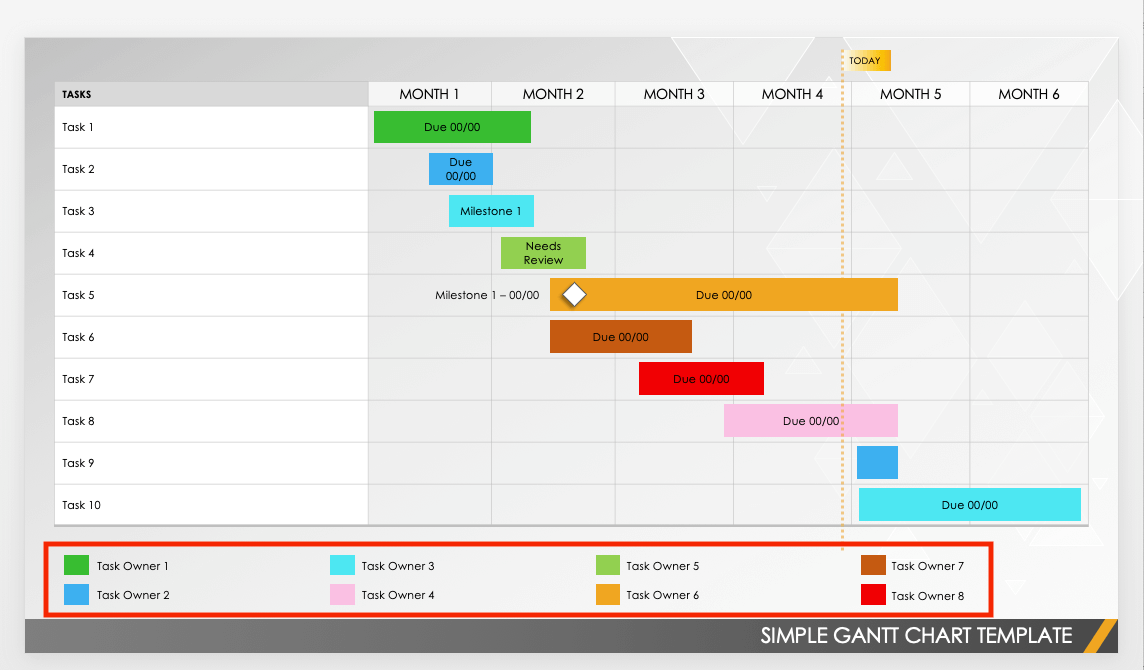
- Assign task owners to each task using the key at the bottom of the template.
Pro Tip: You can change the colors of the task owner boxes to match the owner for each.
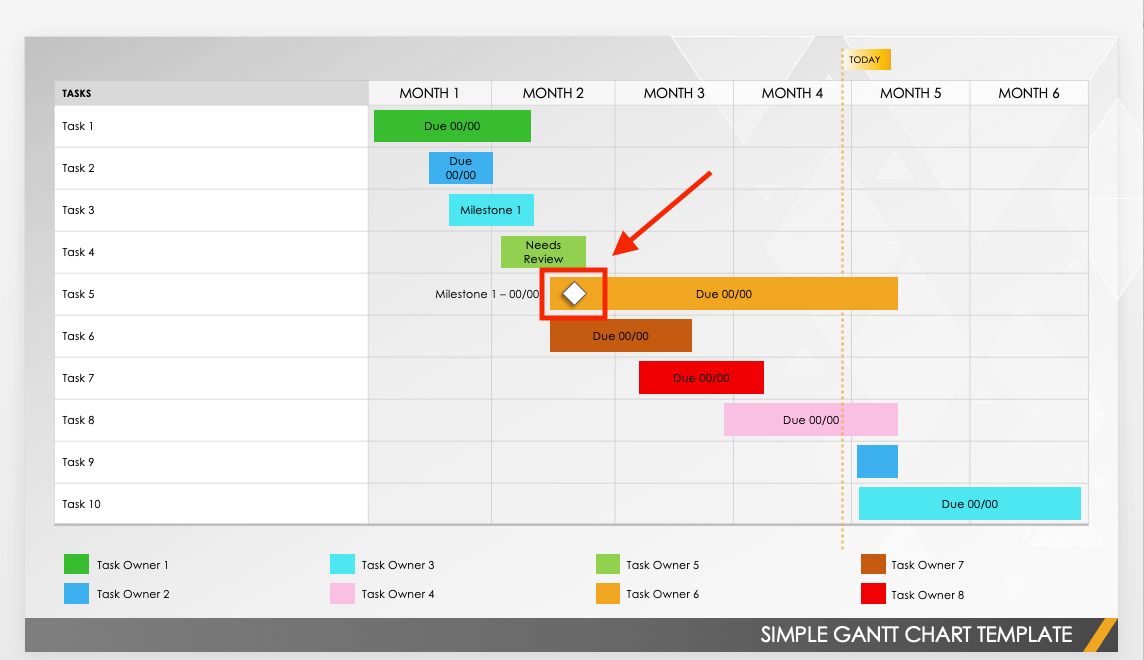
- Move the small white diamond shape (or copy and paste, or use a new shape) for each milestone your project requires.
Learn more about Gantt chart formats, marketing, project management, human resources-specific templates, and expert tips with this Gantt chart examples, templates, and styles resource.
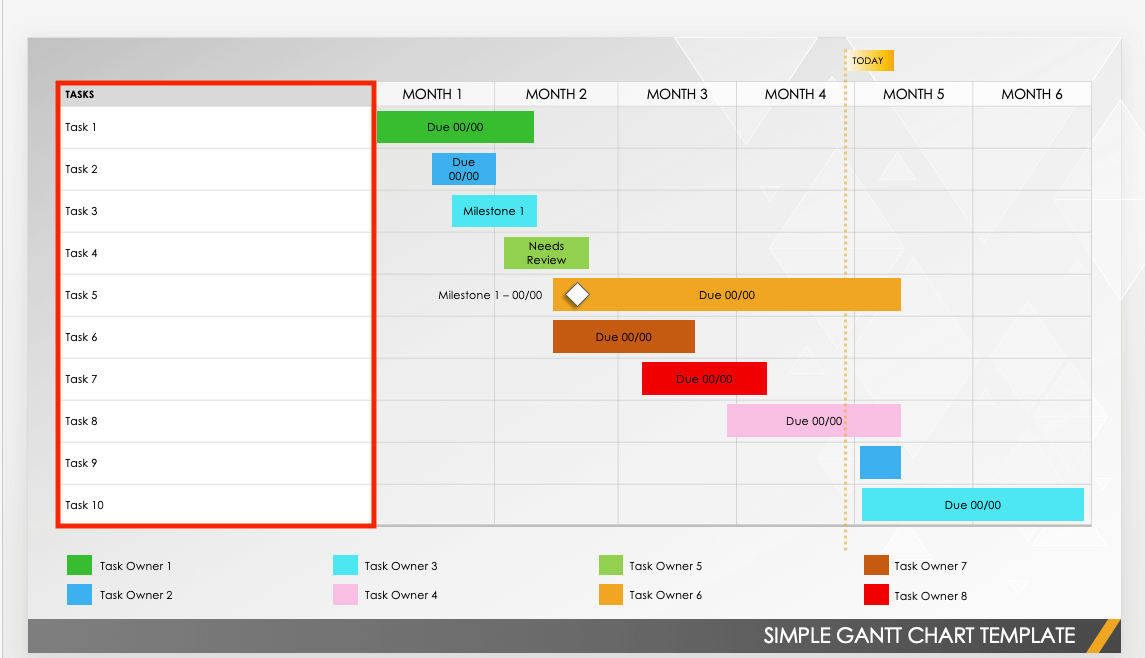
Gantt Chart Template in PowerPoint
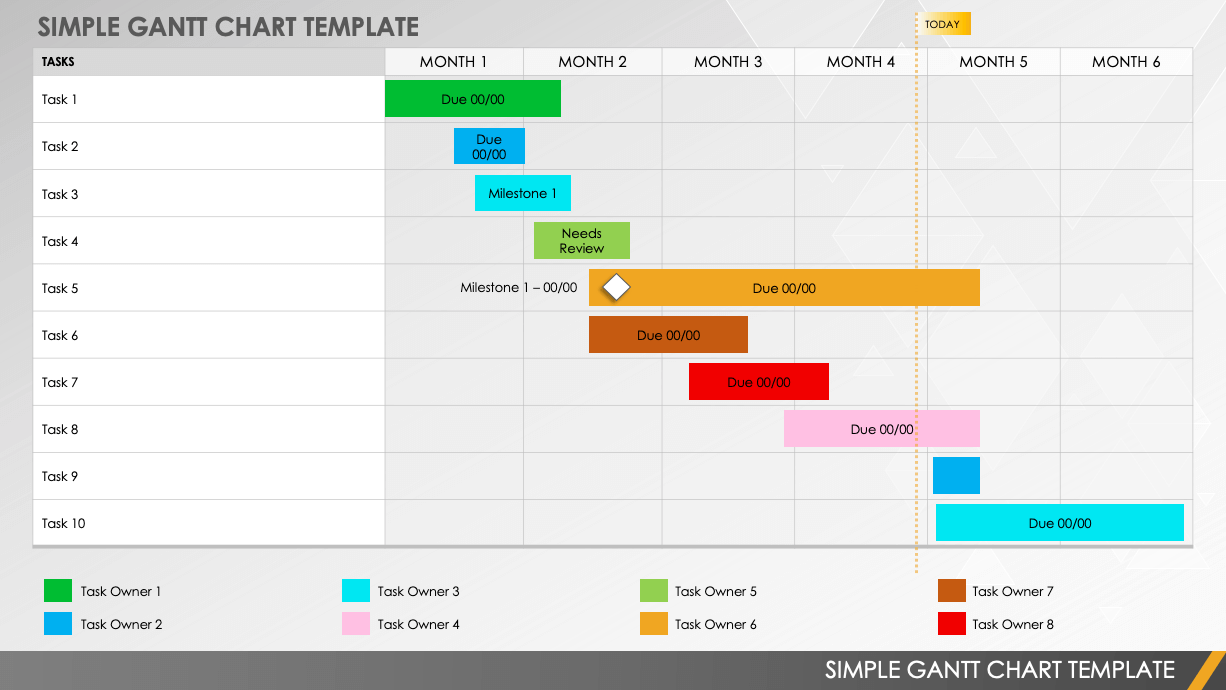
Download a Simple Gantt Chart Template for
PowerPoint
| Smartsheet
When to Use This Template: This template is ideal for planning and managing project tasks, charting durations, and assigning owners. Use it during a presentation to inform and update project team members.
Notable Template Features: The color-coded bars show task owners with a key at the bottom of the slide and task durations across a six-month timeline. This template includes customizable milestone markers and a Today line for real-time updates.
Check out this collection of free PowerPoint Gantt chart templates to help you visualize and present project tasks, timelines, dependencies, and track progress.
How to Import a Gantt Chart in Excel to PowerPoint
You can import a Gantt chart from Excel to PowerPoint to share a project timeline in a clean format. Open the chart in Excel and copy it. Go to your PowerPoint presentation, right-click where you want to embed the Gantt chart in a presentation slide and select Paste.
Follow the steps below to import your Gantt chart from Excel to PowerPoint:
- Open the Gantt chart in Microsoft Excel.
- Highlight the entire chart and right-click. By doing so, you will also highlight the respective data table.
- Click Copy.
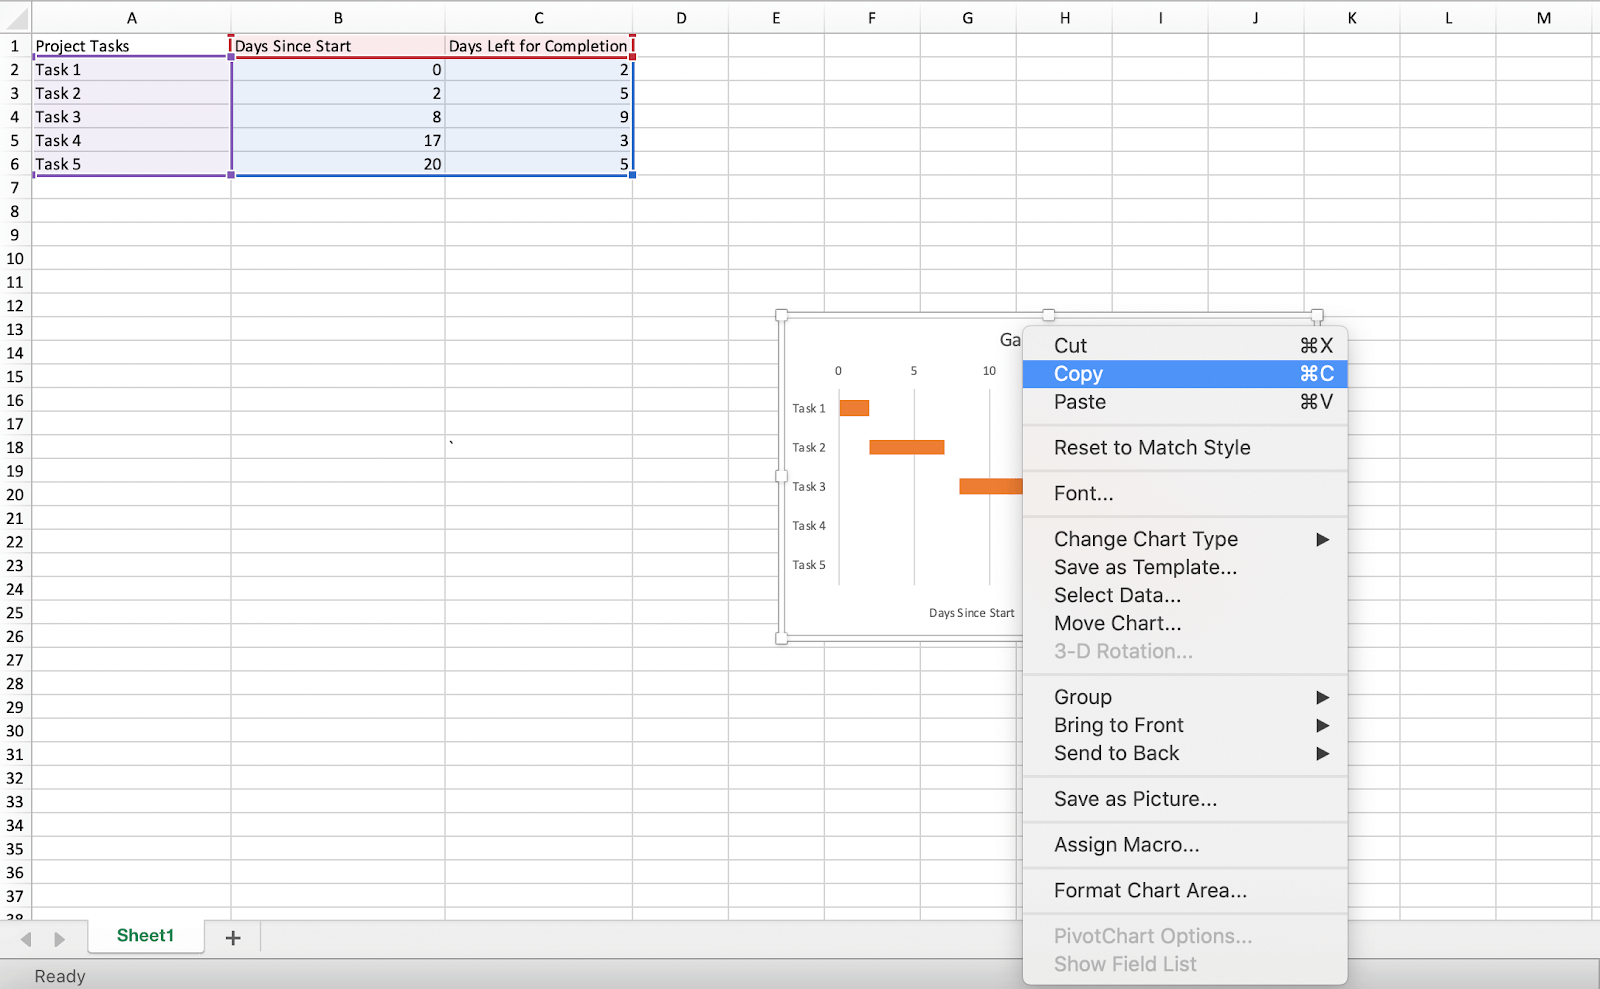
- Navigate back to the PowerPoint presentation.
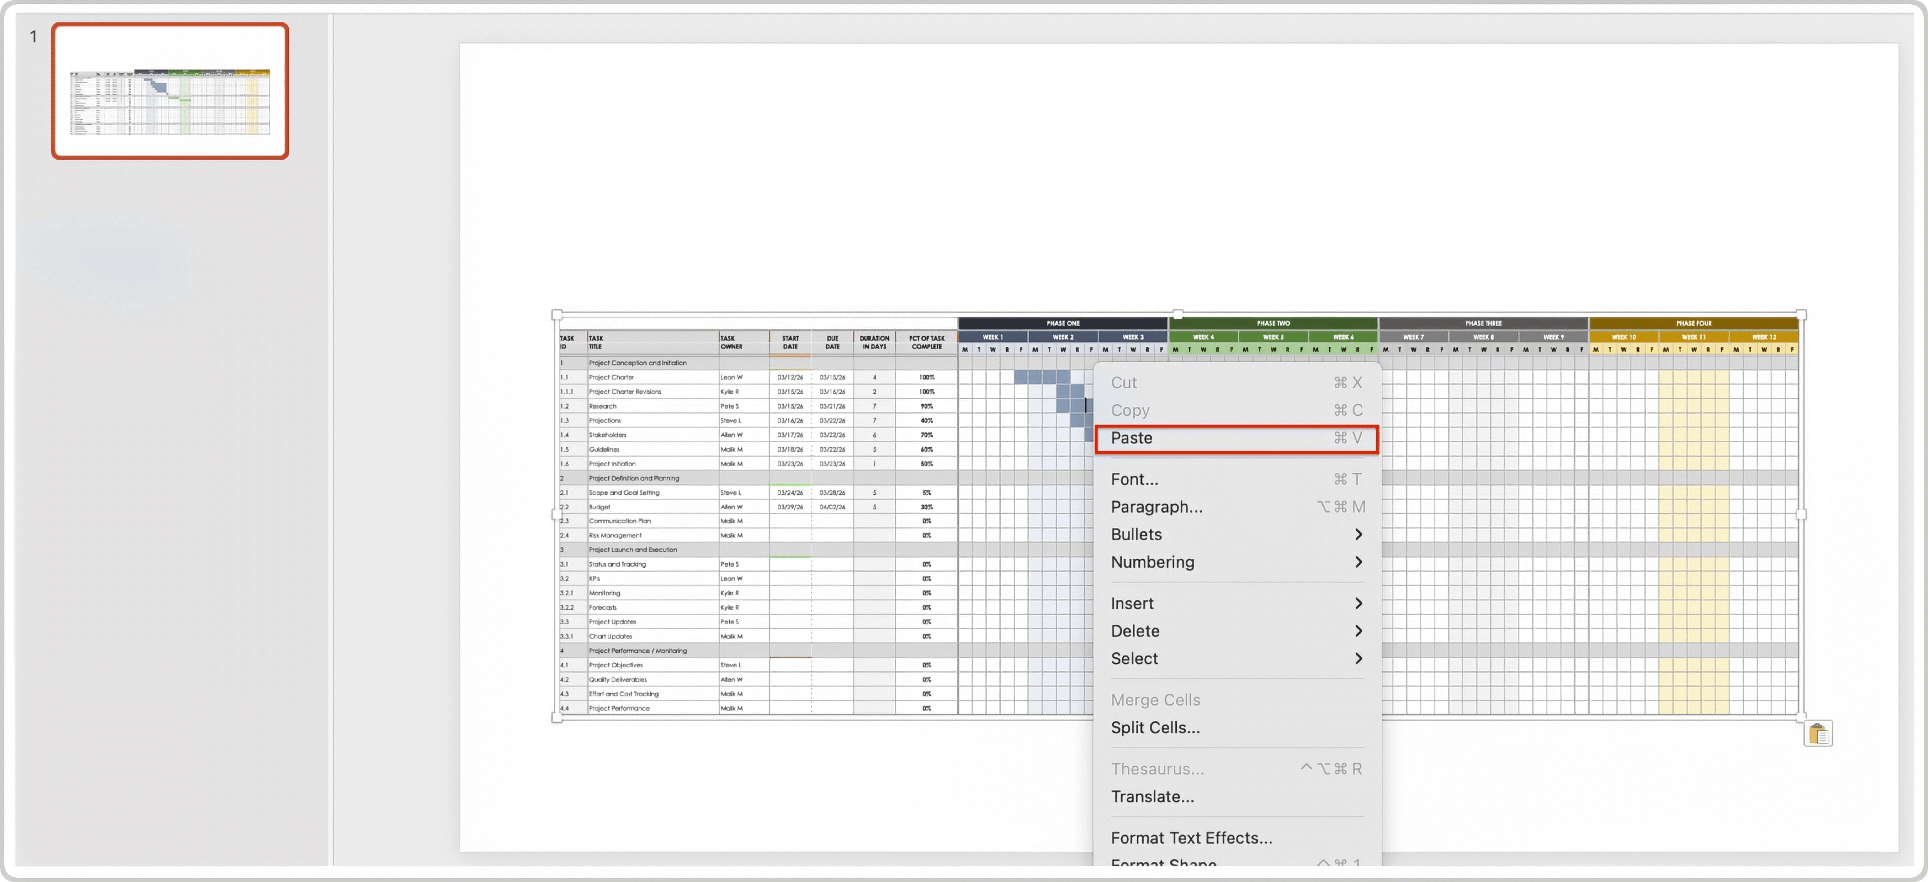
- Click the slide where you want to display the Gantt chart. Right-click anywhere on the slide, and click Embed (E) under Paste Options.
- The Gantt chart should paste directly into the slide.
Pro Tip: If you want to revise the dates in the Gantt chart at any point, you can do so in the Excel spreadsheet where you initially created it. The updates automatically appear wherever you use the Gantt chart, including the PowerPoint presentation.
Find step-by-step instructions, pros and cons, and project team benefits with a how-to guide to create a Gantt chart in Excel.
How to Import a Gantt Chart from Google Sheets to PowerPoint
You can import a Gantt chart from Google Sheets to PowerPoint to display project tasks and timelines in a clean, shareable format. Open the chart in Google Sheets, highlight it, copy it, and right-click in your PowerPoint slide. Paste it where you’d like it go on the slide.
Follow the steps below to import your Gantt chart from Google Sheets to PowerPoint:
- Open the Gantt chart you created in Google Sheets.
- Click on the Gantt chart, and highlight the chart.
- Right-click Copy.
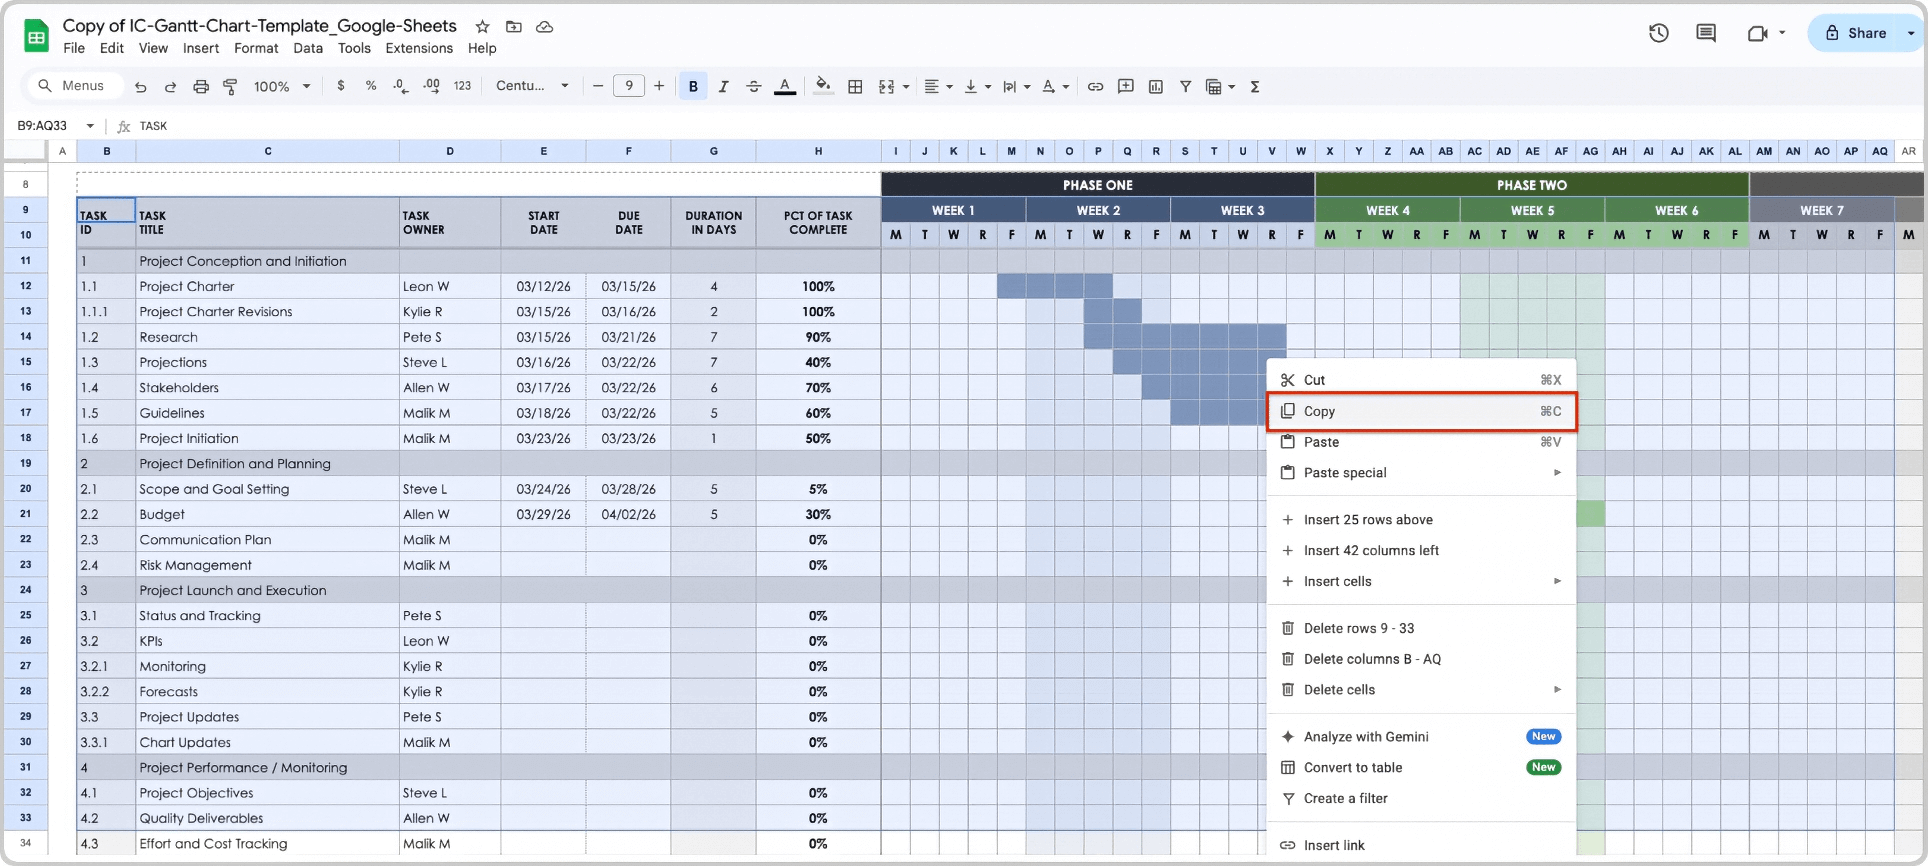
- Navigate back to the PowerPoint presentation and the slide where you want to add the Gantt chart.
- Click the slide where you want to display the Gantt chart. Right-click anywhere on the slide, and click Paste.
- The Gantt chart should appears in the PowerPoint presentation.
Want easy-to-follow instructions on how to create a Gantt chart in Google Sheets? Visit this article for step-by-step instructions and a downloadable template.
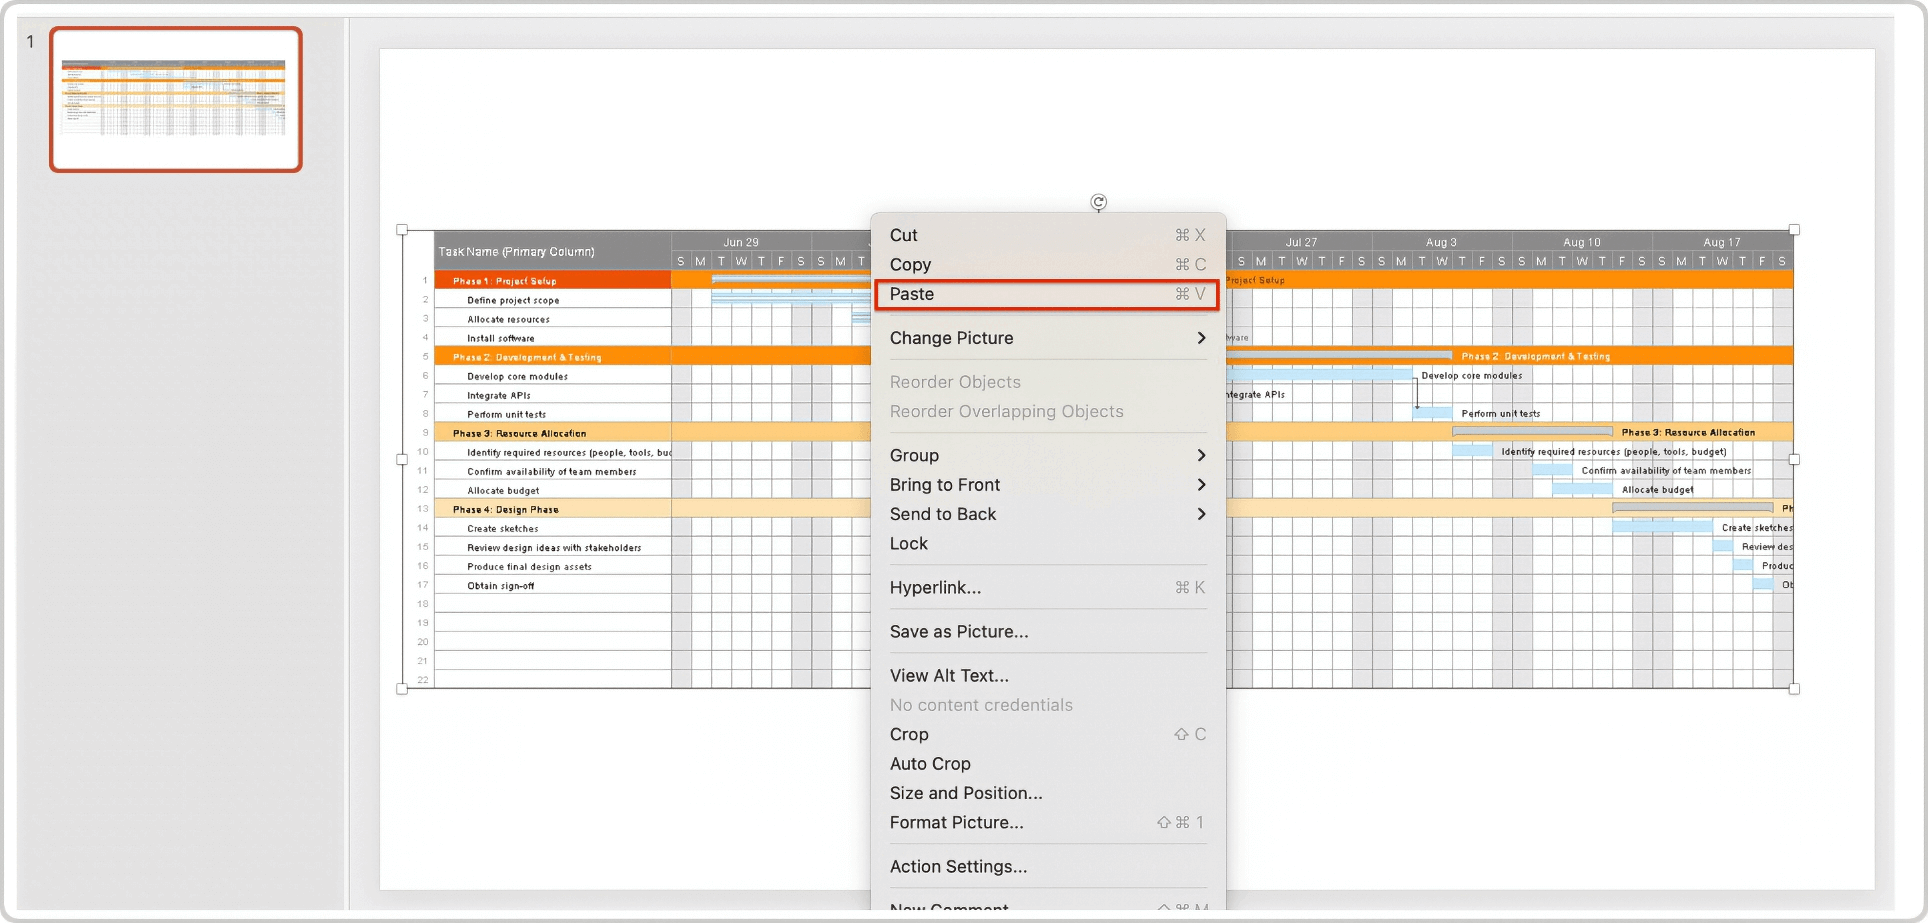
How to Import a Gantt Chart from Smartsheet to PowerPoint
You can import a Gantt chart from Smartsheet to PowerPoint to visualize your project timeline in a presentation slide. Open the Gantt chart, click the three dots in the top row, and export it as a PNG. Then locate the downloaded file in your folder to copy and paste into your presentation.
Follow the steps below to import your Gantt chart from Smartsheet to PowerPoint:
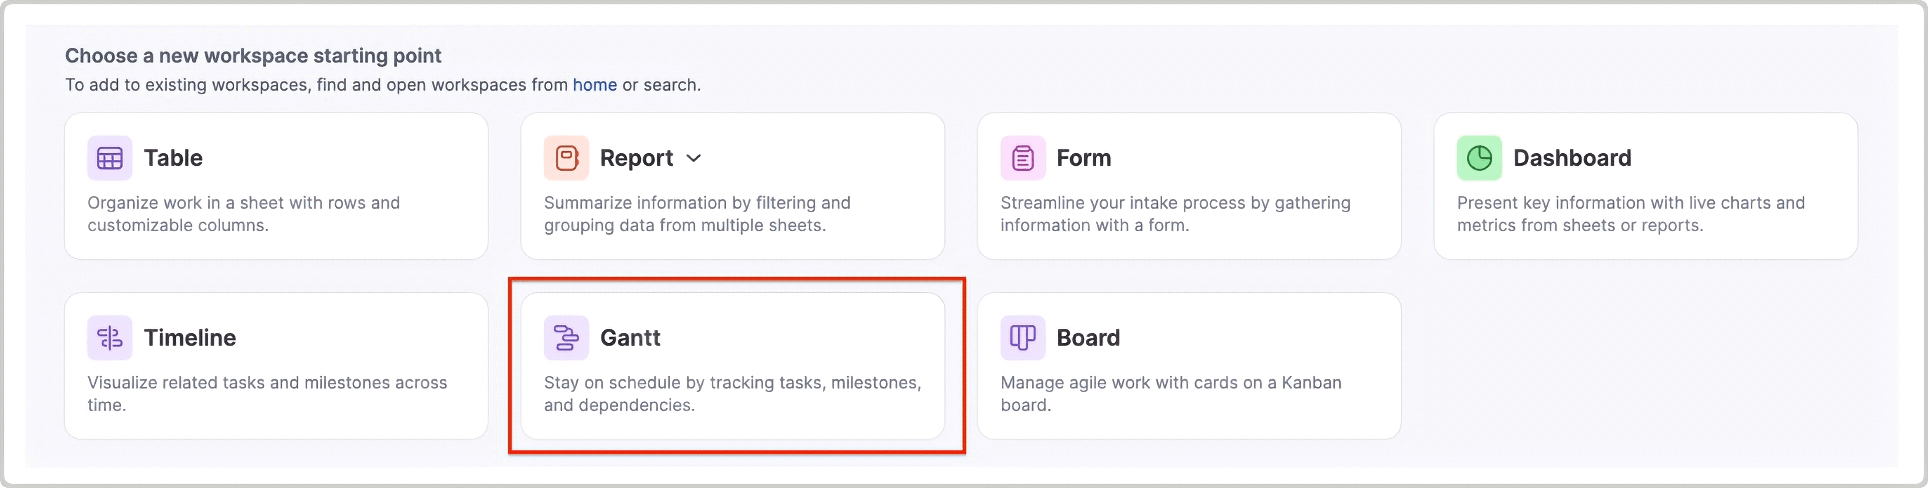
- Start a new project in Smartsheet.
- Click Gantt in the Choose a new workspace starting point section.
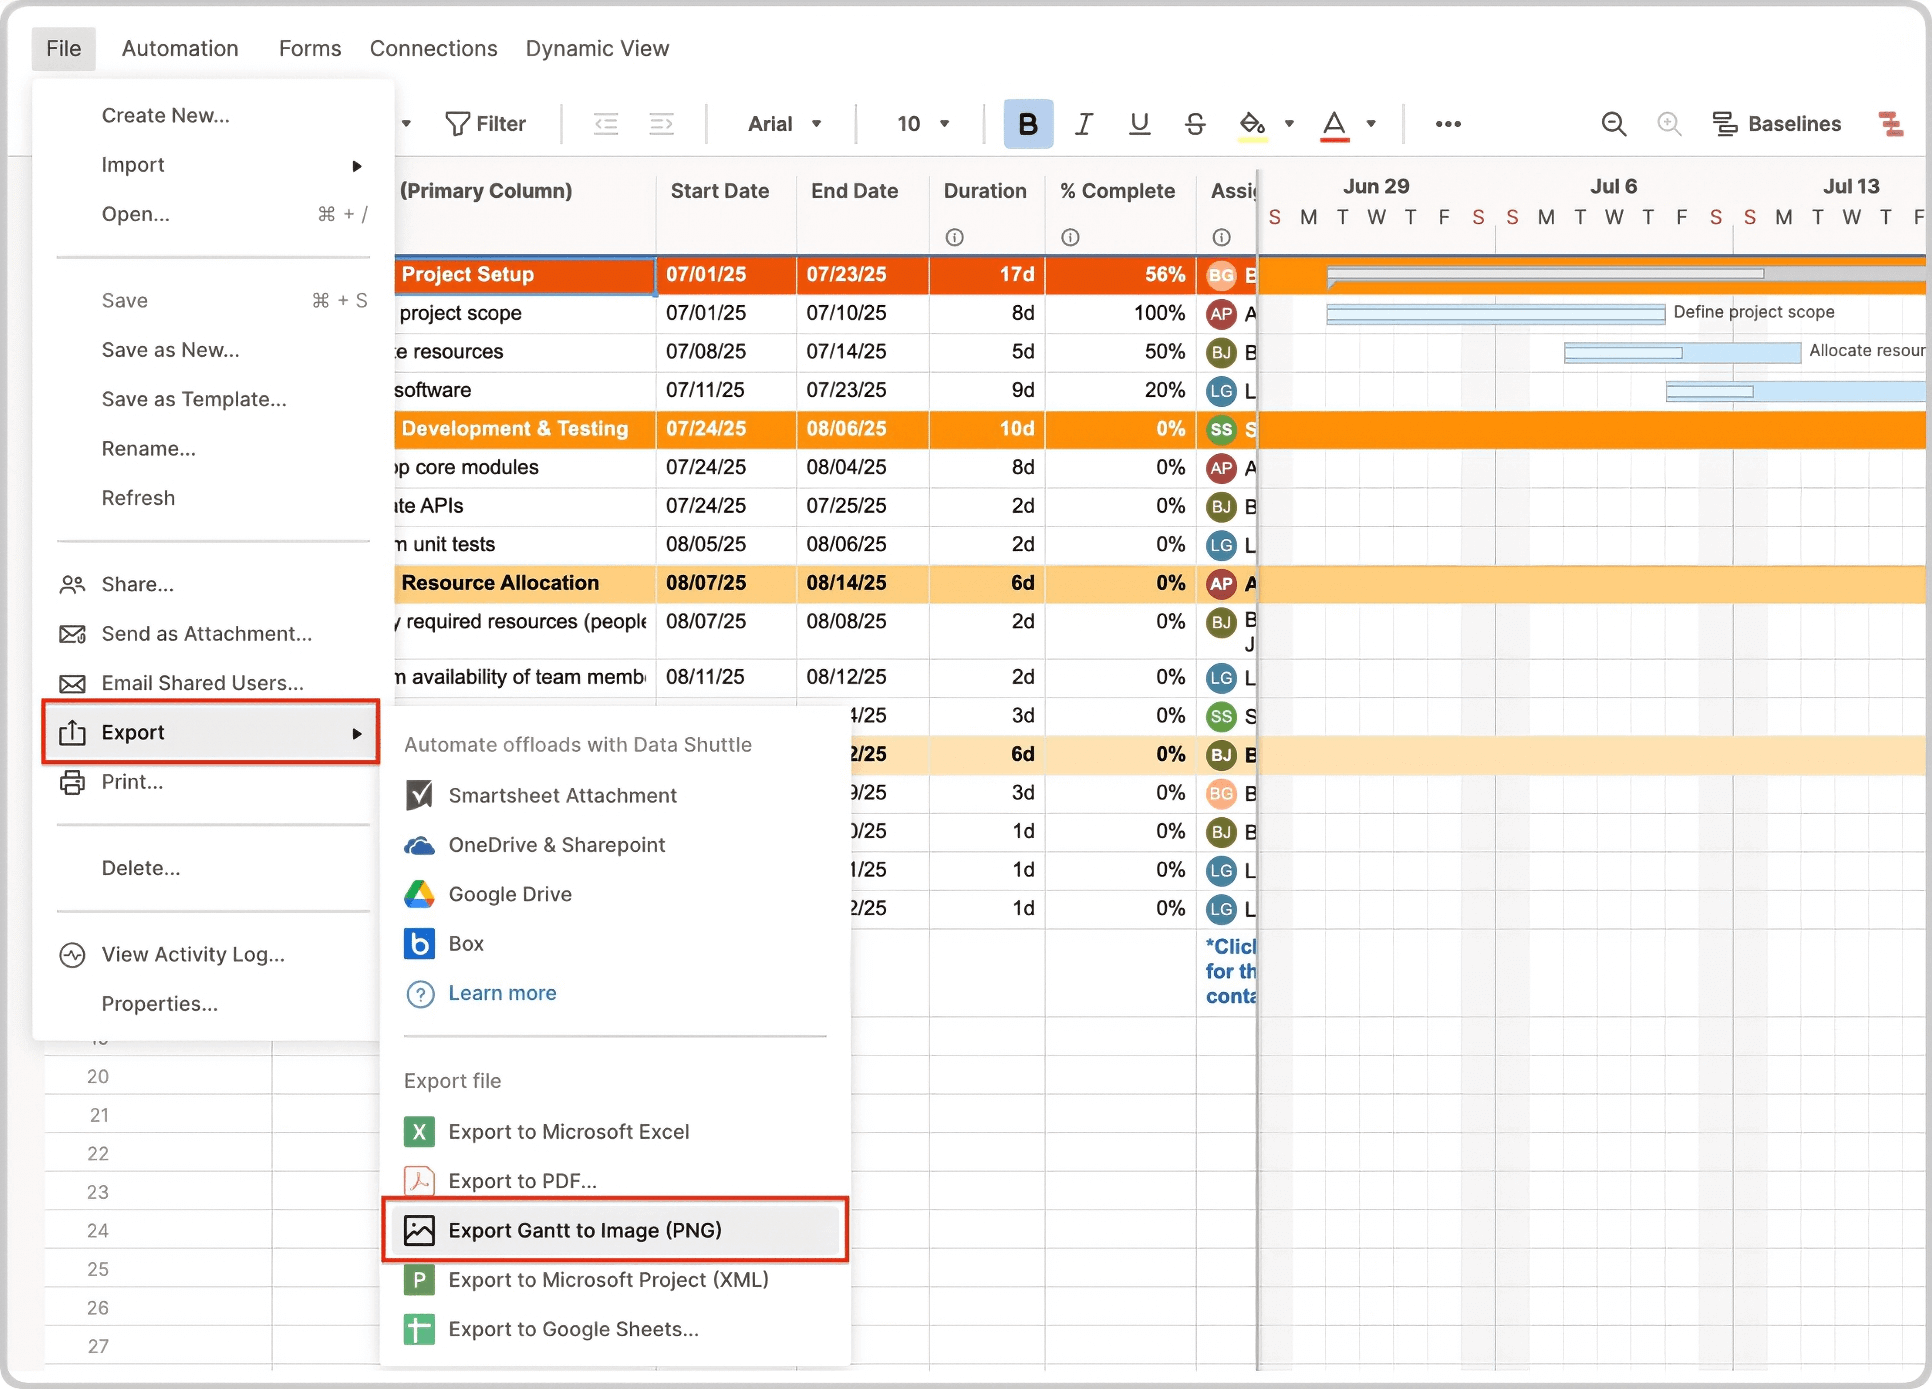
- Open the Gantt chart in Smartsheet.
- Click on File. Click on Export Gantt to Image (PNG).
- Select if you want to export the Entire Sheet or Selected Rows and make any adjustments to the Gantt Date Range.
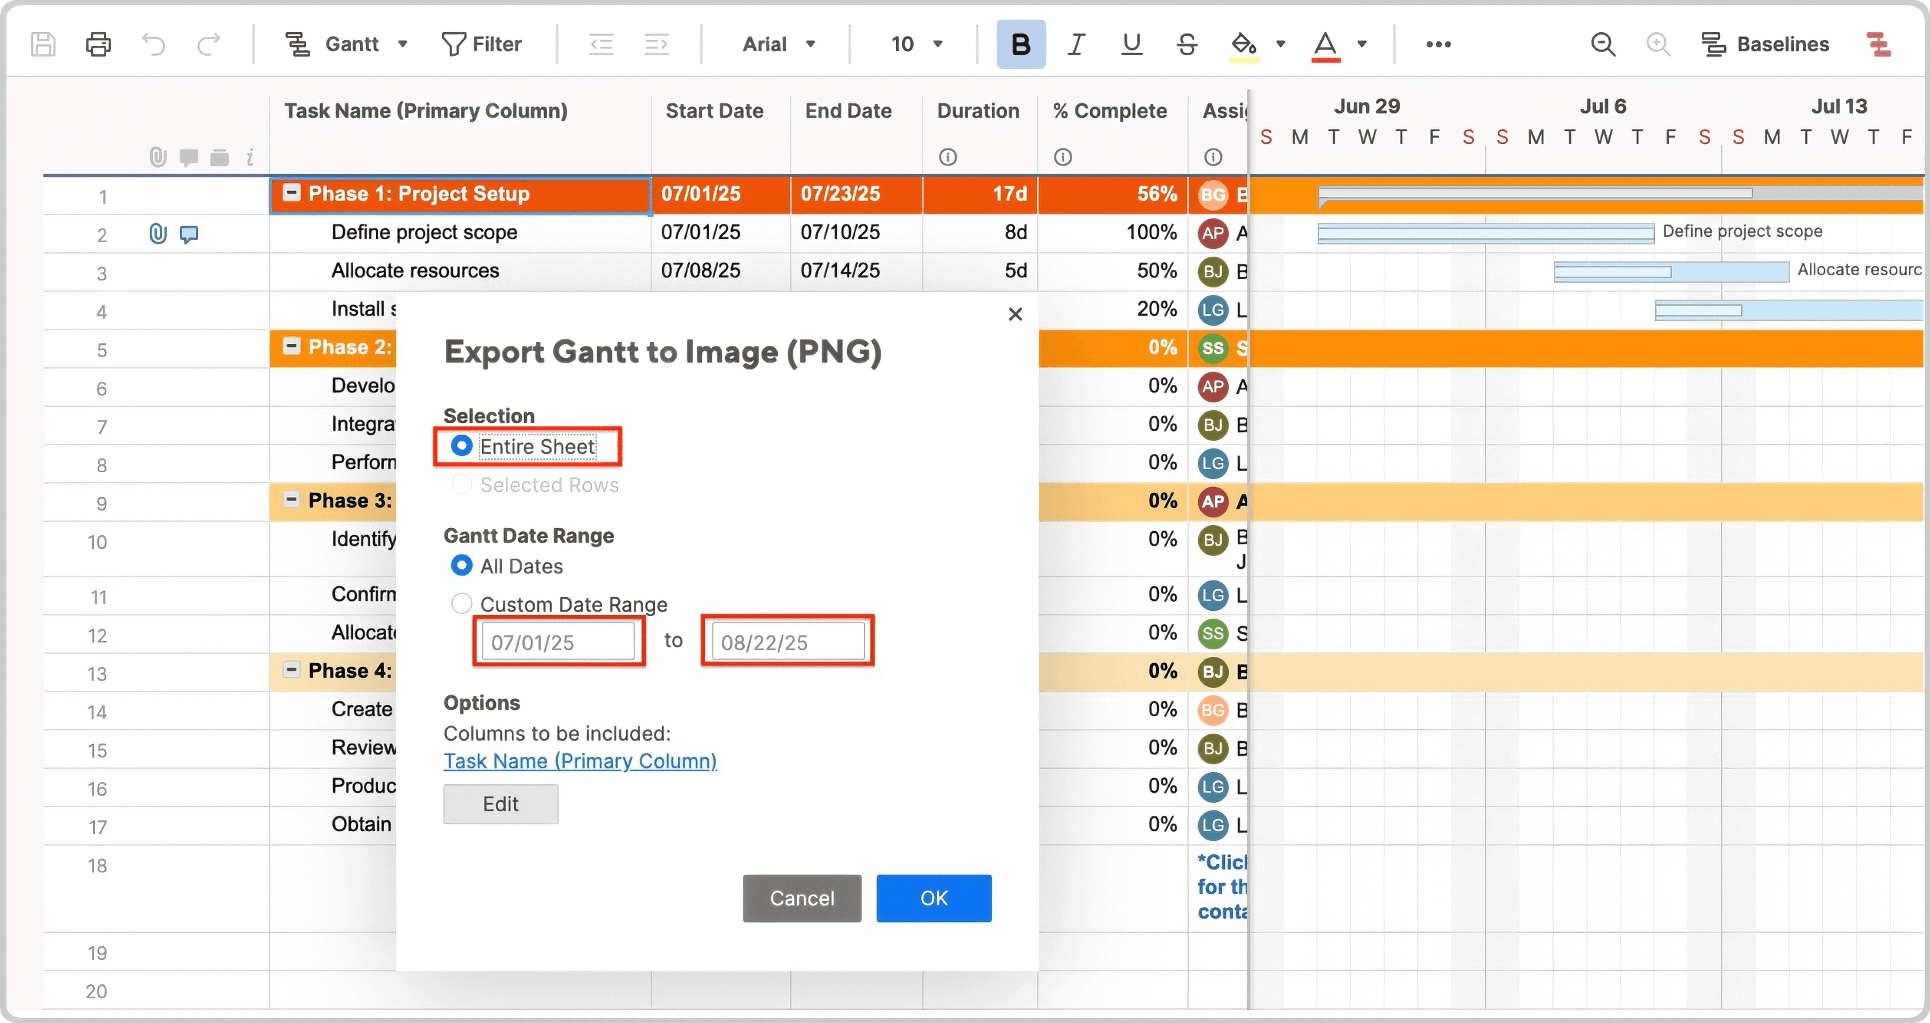
- Click the blue OK button.
- Find and open the image in your Downloads folder. Right-click Copy Image on the chart image.
- Open a slide in the PowerPoint presentation. Right-click anywhere on the slide where you want to put the Gantt chart and click Paste.
Get the Most Out of Your Gantt Charts with Smartsheet
From simple task management and project planning to complex resource and portfolio management, Smartsheet helps you improve collaboration and increase work velocity -- empowering you to get more done.
The Smartsheet platform makes it easy to plan, capture, manage, and report on work from anywhere, helping your team be more effective and get more done. Report on key metrics and get real-time visibility into work as it happens with roll-up reports, dashboards, and automated workflows built to keep your team connected and informed.
When teams have clarity into the work getting done, there’s no telling how much more they can accomplish in the same amount of time. Try Smartsheet for free, today.

PowerPoint Gantt Chart FAQs
Yes, PowerPoint has Gantt chart templates. When you open PowerPoint. Click the New option and click the search bar. Type Gantt chart, press Enter, and pick a layout that fits your project needs.
There are a variety of premium Gantt chart templates for PowerPoint. They are available for a variety of scenarios. You can also pick a template for a specific use case, such as for project management, project task dependencies, a software development timeline, and more.
Check out these downloadable, customizable, free Gantt chart templates for PowerPoint, as well as this collection of Gantt chart templates available in different formats.
PowerPoint can be a good tool for Gantt charts if your project is small, simple, or short-term. It works well for showing key tasks and dates in one slide. Customizing colors, bars, and layout to match your project style is also easy.
Using PowerPoint, you must update Gantt charts manually, which requires extra time and leads to errors. The tool doesn't support task dependencies or critical path analysis. It's best for simple, shorter project timelines without frequent updates or complex needs.
Smartsheet is a powerful, easy-to-use platform for building dynamic Gantt charts. You can drag and drop tasks, set dependencies, view the critical path, and track milestones. Edit timelines, share with teams, and collaborate across any device or system in real time.
Learn how Gantt chart software can help you create, visualize, and manage project timelines. Enhance project timeline visibility, resource management, task tracking, and more with this guide on how to create a Gantt chart in Smartsheet.

