Gantt Charts and Critical Path Analysis
Both Gantt charts and the critical path method serve as indispensable tools for project management. They both help you track a project’s progress and manage the associated tasks to stay on time and on budget.
With Gantt charts, you can track project tasks against a predetermined timeline. For further details on how to create a Gantt chart for your project, get free Gantt charts in Excel. If you’re looking for a variety of Gantt chart templates that you can use for projects of all sizes and types, click here.
Critical paths, on the other hand, identify the sequence of project tasks that determine a project’s duration and outline important deadlines you have to meet to deliver a project on time. In short, the critical path is the longest distance, or duration of time, between the start of a project and its completion.
When you use a Gantt chart in combination with the critical path method, you can track the path’s tasks over a specific time period, thus helping you keep your project on schedule and mitigate any problems. While your critical path analysis helps you make better scheduling estimates and decisions, your Gantt chart tracks this schedule and closely monitors your project’s timing and progress.
When you have flexibility in monitoring the critical path on a timeline — such as by using a visual Gantt chart — you can more easily adjust your project schedule as it progresses and get an accurate picture of how each task is tracking.
What Is a Critical Path in a Gantt Chart?
A critical path in a Gantt chart refers to the phenomenon in which any individual task causes a delay in the related sequence of tasks, thus pushing back a project’s overall end date.
You can easily determine if a particular task is on the critical path of your project by calculating whether the task delays the overall duration of the project. Similarly, you can easily determine whether or not a task is non-critical: If the task doesn’t affect the duration of your project, that task is non-critical. If money or time precludes you from completing non-critical paths, you can remove them from your project entirely.
You use the critical path method to find the shortest path — or the least amount of time — necessary to complete each task. Such tasks also require the least amount of slack, and you must complete them within the designated time frame.
Once you’ve determined your critical path by hand, you can then calculate it by using project management software.
Difference Between a Gantt Chart and a Critical Path Analysis
The main difference between a Gantt chart and a critical path analysis is that a Gantt chart offers a timeline view of a project, whereas a critical path maps the sequence of scheduled tasks that determine a project’s duration.
A few other key differences separate Gantt charts and critical paths:
- A Gantt chart provides a timeline view of a project.
- A Gantt chart tracks individual project tasks, dependencies, resources, and remaining work.
- A Gantt chart gives people a visual overview of how a project is progressing.
- A Gantt chart is composed of two separate axes (time plotted against tasks).
- In a Gantt chart, bars on the chart represent tasks.
- A Gantt chart links dependent tasks and shows predecessors.
- A Gantt chart shows the resources that you need for each task.
- A critical path analysis shows the sequence of scheduled tasks that determine the duration of a project.
- A critical path analysis identifies which tasks you must complete in order to meet your project deadline.
- A critical path analysis helps calculate project duration based on the estimated task durations that make up an entire project.
- A critical path analysis helps reduce timelines and cut overall project costs.
- A critical path analysis compares planned project progress versus actual project progress.
Critical Path Analysis vs. Gantt Chart Analysis
Below, you’ll find a helpful comparison chart showing the differences between Gantt charts and critical paths.
| Gantt Chart | Critical Path | |
|---|---|---|
| Description | A timeline view of a project that tracks individual project tasks, dependencies, resources, and remaining work | A sequence of scheduled tasks that determines the duration of a project |
| Visual Component | A timeline plotting project tasks against time on an x and y axis | A diagram of linked tasks that you must complete from start to finish |
| Purposes | Provides a visual overview of how a project is progressing and shows the dependent tasks and resources that you need for each task | Calculates project duration based on estimated task durations and helps reduce timelines and cut project costs |
| Uses | Project management | Project management, project scheduling, and time estimating |
How to Determine the Critical Path in a Gantt Chart
To determine the critical path in a Gantt chart, list all project tasks, calculate the duration of each task, identify all dependent tasks and critical tasks, and figure out any lag time between tasks.
For more detailed steps with helpful images, refer to the information below.
Steps to Identify the Critical Path in a Gantt Chart
Here are the six steps to identify the critical path in a Gantt chart:
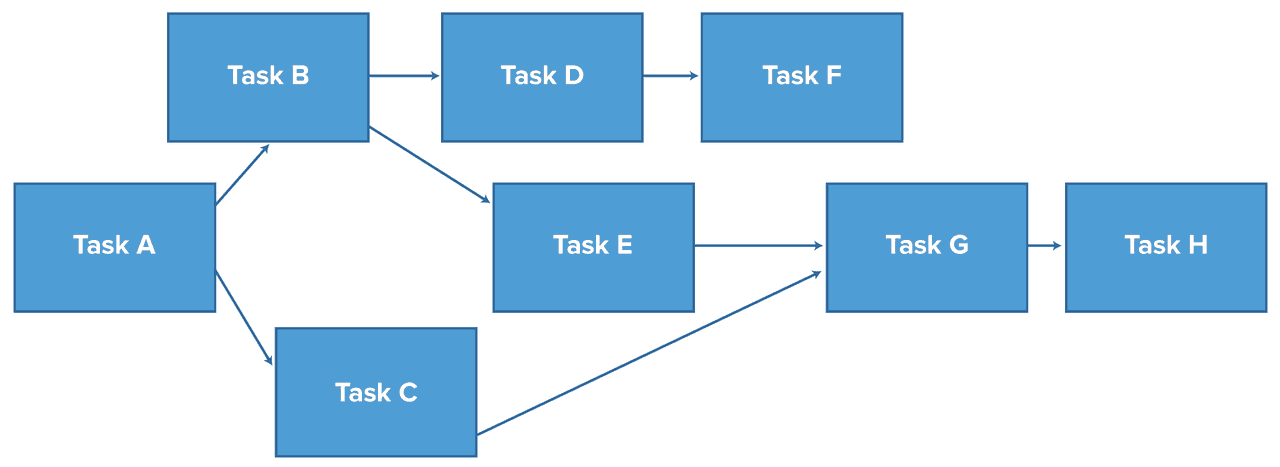
- First, list all activities or tasks in your project. Use a work breakdown structure, if necessary.

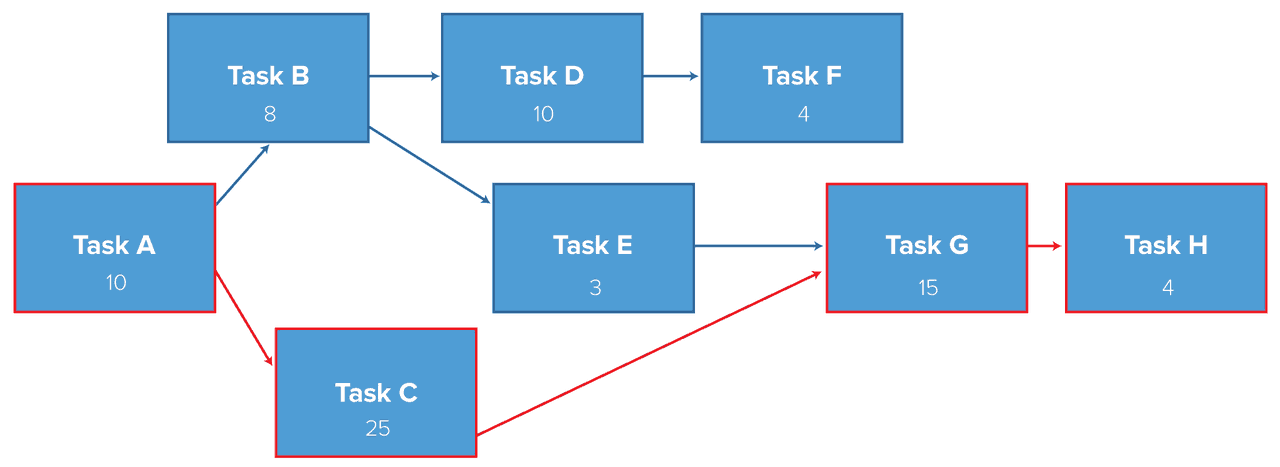
- Determine the projected duration of each task. Performing this step will also help you calculate the duration of your project as a whole.
- Identify which tasks depend on other tasks. That is, call out the tasks that you must complete in order to move on to the next task.
- Of the dependent tasks, determine which are critical — i.e, the tasks you must complete in order to finish your project — and which you can dismiss if time or money precludes their completion.
- Note any potential lag time between tasks.
- As your project progresses, add milestones that help you determine whether or not your project is on track.
For downloadable, easy-to-use critical path templates, check out this collection of critical path templates and find the one that’s most useful for your next project.
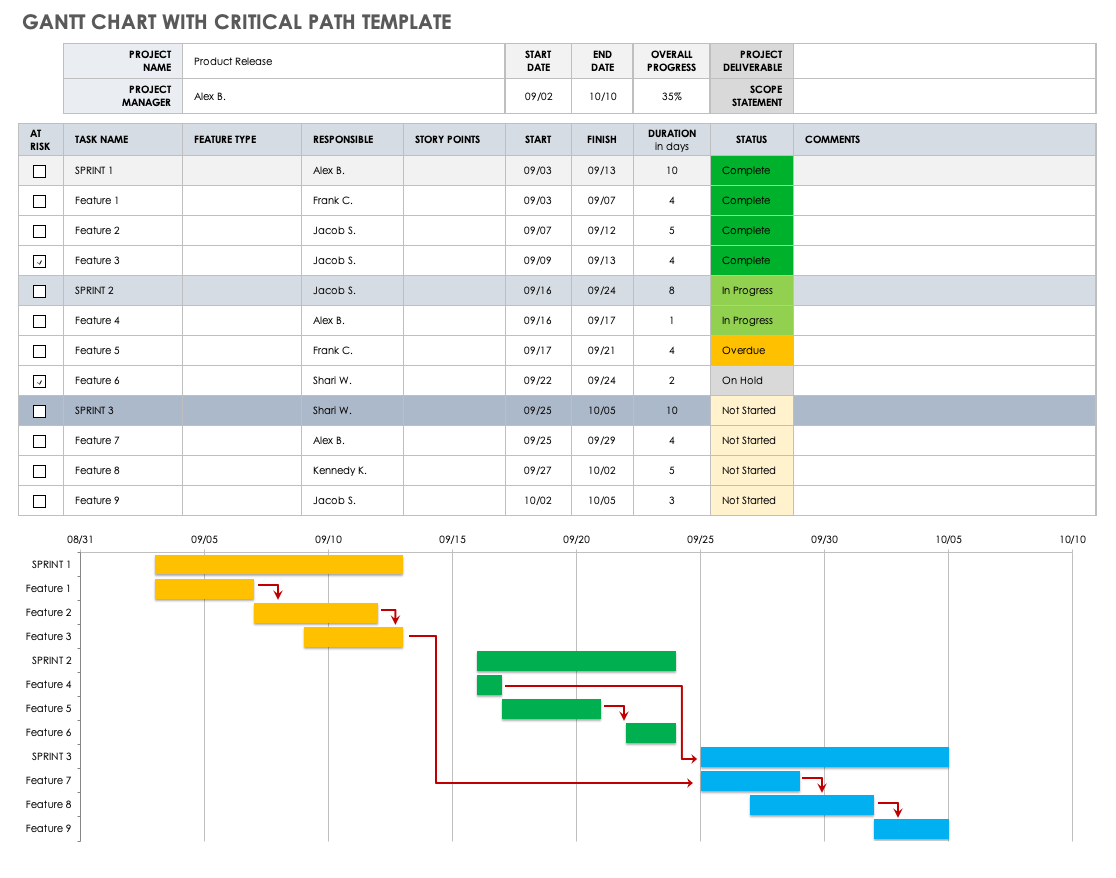
Gantt Chart Critical Path Example
Use this template to list, track, and manage all project tasks, especially project tasks that are part of your project’s critical path.
This template enables you to better visualize your project as a whole and track the progress of your project as you check off each task. Shorten or eliminate any unnecessary project tasks in order to maintain your estimated completion time and ensure that you carry out all critical paths.
Download Gantt Chart Critical Path Template
Why Should You Use Critical Path?
You should use the critical path method to identify your earliest project completion date. This helps project managers better track and manage projects, as well as ensure that projects progress in a timely fashion.
The Importance of Critical Path
Critical paths are crucial because they help you keep your projects on track and determine what tasks you cannot miss or delay.
Critical paths are also essential for the following reasons:
- They indicate the earliest date at which you can plan to finish a project.
- They enable project managers to know exactly which tasks require the most focus in order to ensure that such tasks don’t disrupt an entire project.
- They allow project managers to reschedule or eliminate any remaining project tasks that jeopardize a project’s initial duration.
- They allow project managers to revise the estimated time of one or more tasks in order to maintain a project’s initial duration.
- They help you identify the most important tasks and eliminate any tasks that you may not need in order to successfully complete a project.
Manage Your Projects More Efficiently with Gantt Charts and the Critical Path Method
From simple task management and project planning to complex resource and portfolio management, Smartsheet helps you improve collaboration and increase work velocity -- empowering you to get more done.
The Smartsheet platform makes it easy to plan, capture, manage, and report on work from anywhere, helping your team be more effective and get more done. Report on key metrics and get real-time visibility into work as it happens with roll-up reports, dashboards, and automated workflows built to keep your team connected and informed.
When teams have clarity into the work getting done, there’s no telling how much more they can accomplish in the same amount of time. Try Smartsheet for free, today.


