What Are Gantt Chart Dependencies?
Gantt chart dependencies are visualizations of task relationships on a Gantt chart that show in what order the tasks must be completed. Project managers in many industries — including construction, manufacturing, and software development — use Gantt chart dependencies, which help streamline resource allocation and keep projects on schedule.
Learn more about Gantt charts and their uses, and get started with these Gantt chart templates.
To give you an idea of how a dependency works, we can use a construction project as an example.
One of the project tasks for assembling a new house involves laying a new roof, but the roofer can’t begin their work until the walls are complete.
In this situation, the new roof is dependent on the construction of the walls. With this information, the project manager can ensure that the walls are built before the roofer lays the new roof.
Dependent tasks are categorized as a predecessor or a successor task. The predecessor is the task that controls the start or end date for any related successor tasks. The dependency represents the relationship between the two.
In this example, building the walls is the predecessor task, and laying the roof is the successor.
Learn more about how to identify and manage dependencies in project management.
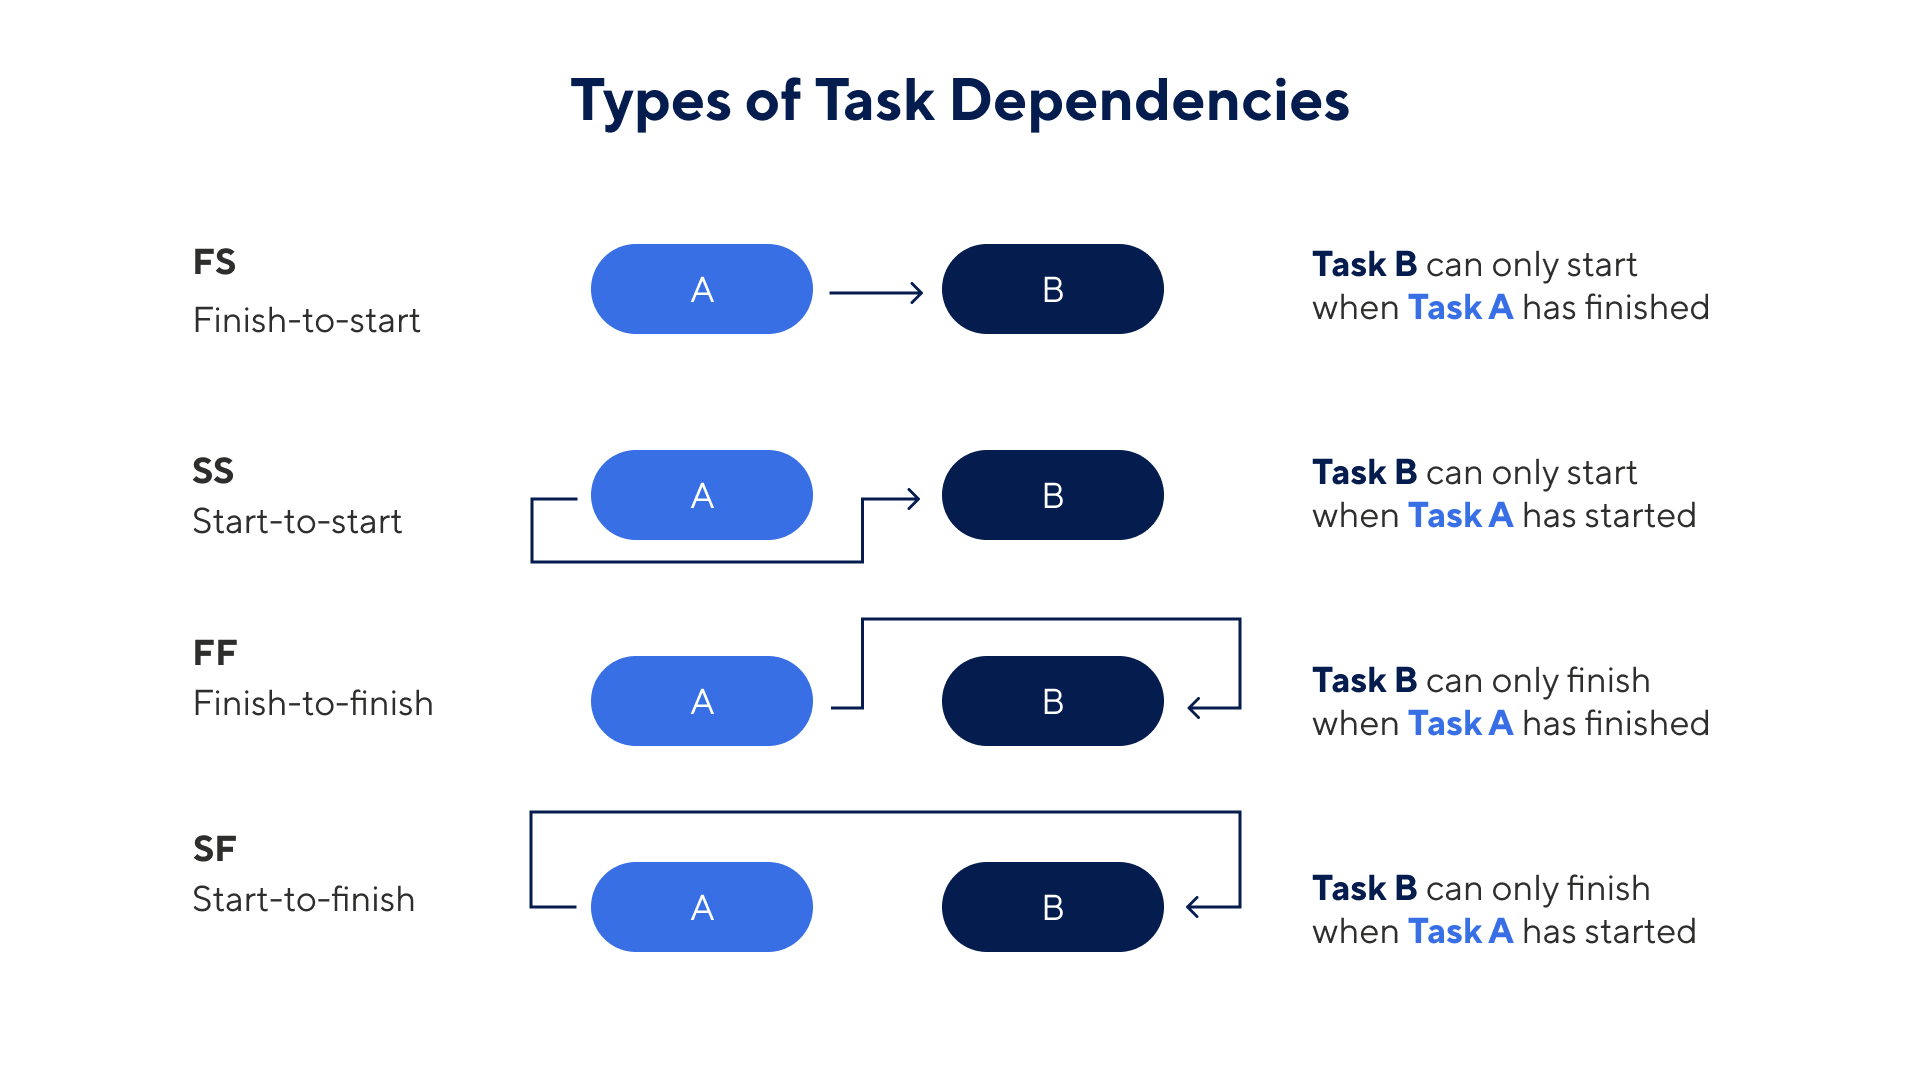
There are four types of dependencies:
- Finish-to-Start (FS): This is the most common type of dependency used in a project plan. It refers to dependencies in which the predecessor task must be completed before the successor task can begin. For example, walls can’t be painted until the drywall installation is complete.
- Finish-to-Finish (FF): Tasks might run simultaneously with this dependency, but the successor task can’t be completed until the predecessor is complete. For example, you can start inspecting a building while the electrical wiring is still in progress, but you can’t complete the inspection until the wiring is complete.
- Start-to-Start (SS): In this case, the successor task can’t start until the predecessor task starts. The tasks might or might not start simultaneously. For example, wall paint and primer can be applied simultaneously, but painting can’t start until priming has started.
- Start-to-Finish (SF): Used in rare cases, this dependency indicates that one task can’t be finished until another task begins. The predecessor activity (for example, switching on the new permanent electrical system) must start before the successor activity (for example, a temporary power source) can finish.
Excel Gantt Chart Template with Dependencies
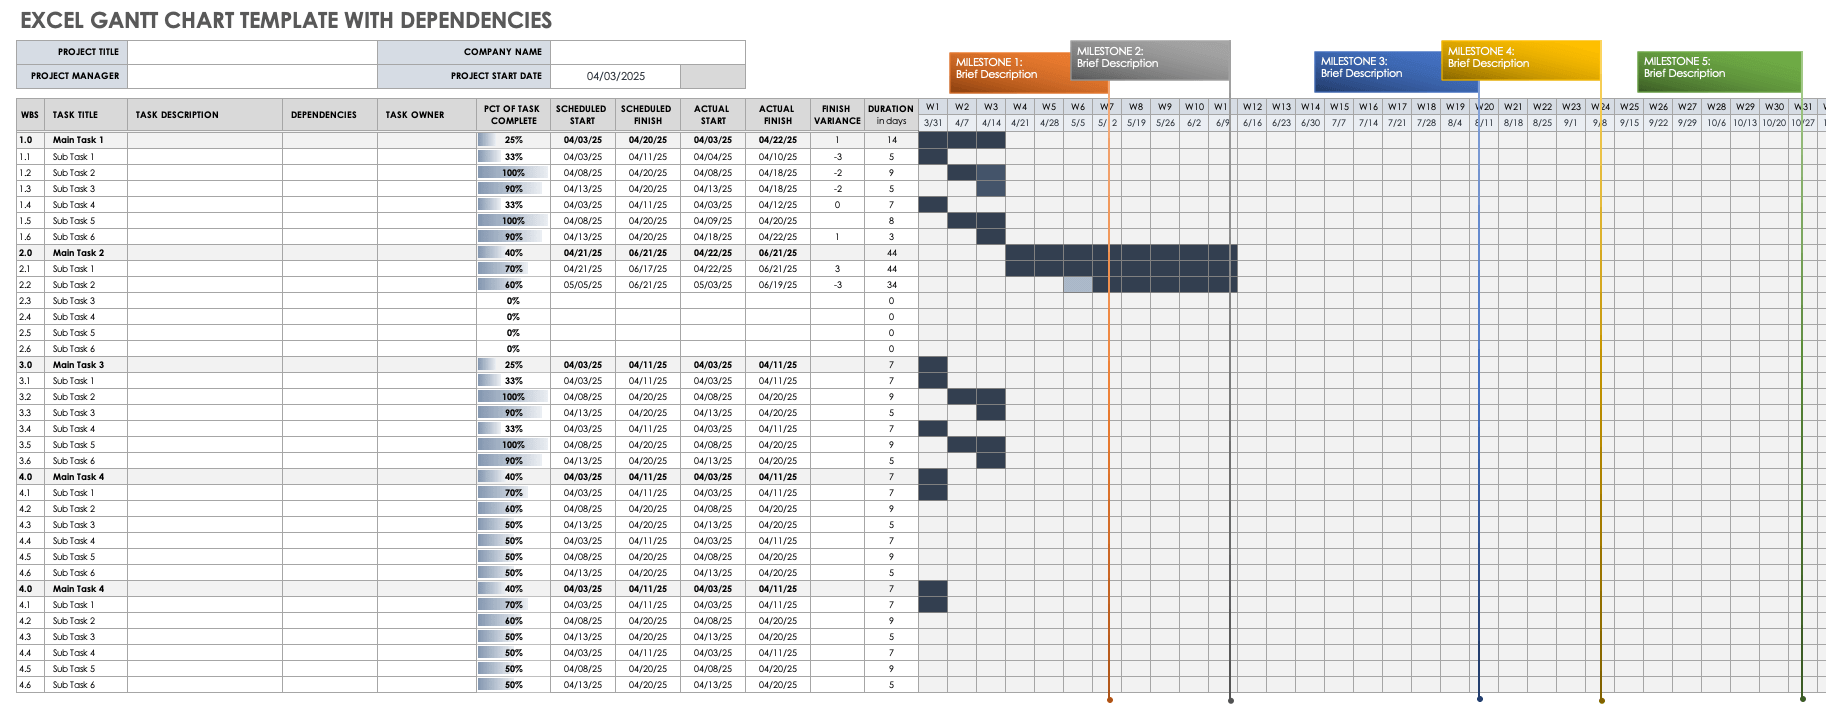
Download a Gantt Chart Template with Dependencies for Excel
When to Use This Template: Use this template to track progress for each of your tasks, set against milestones that you need to complete for the project.
Notable Template Features: This comprehensive Gantt chart template includes a work breakdown structure (WBS), which outlines project phases, tasks, dependencies, and milestones.
Learn more about how to create a Gantt chart in Excel and project milestones by project phase and industry. Or, check out this guide to work breakdown structures to help you track your project in detail. To save time and to get tips on customizing a template to best suit your needs, see the post on utilizing Excel Gantt chart templates.
Google Sheets Gantt Template with Dependencies
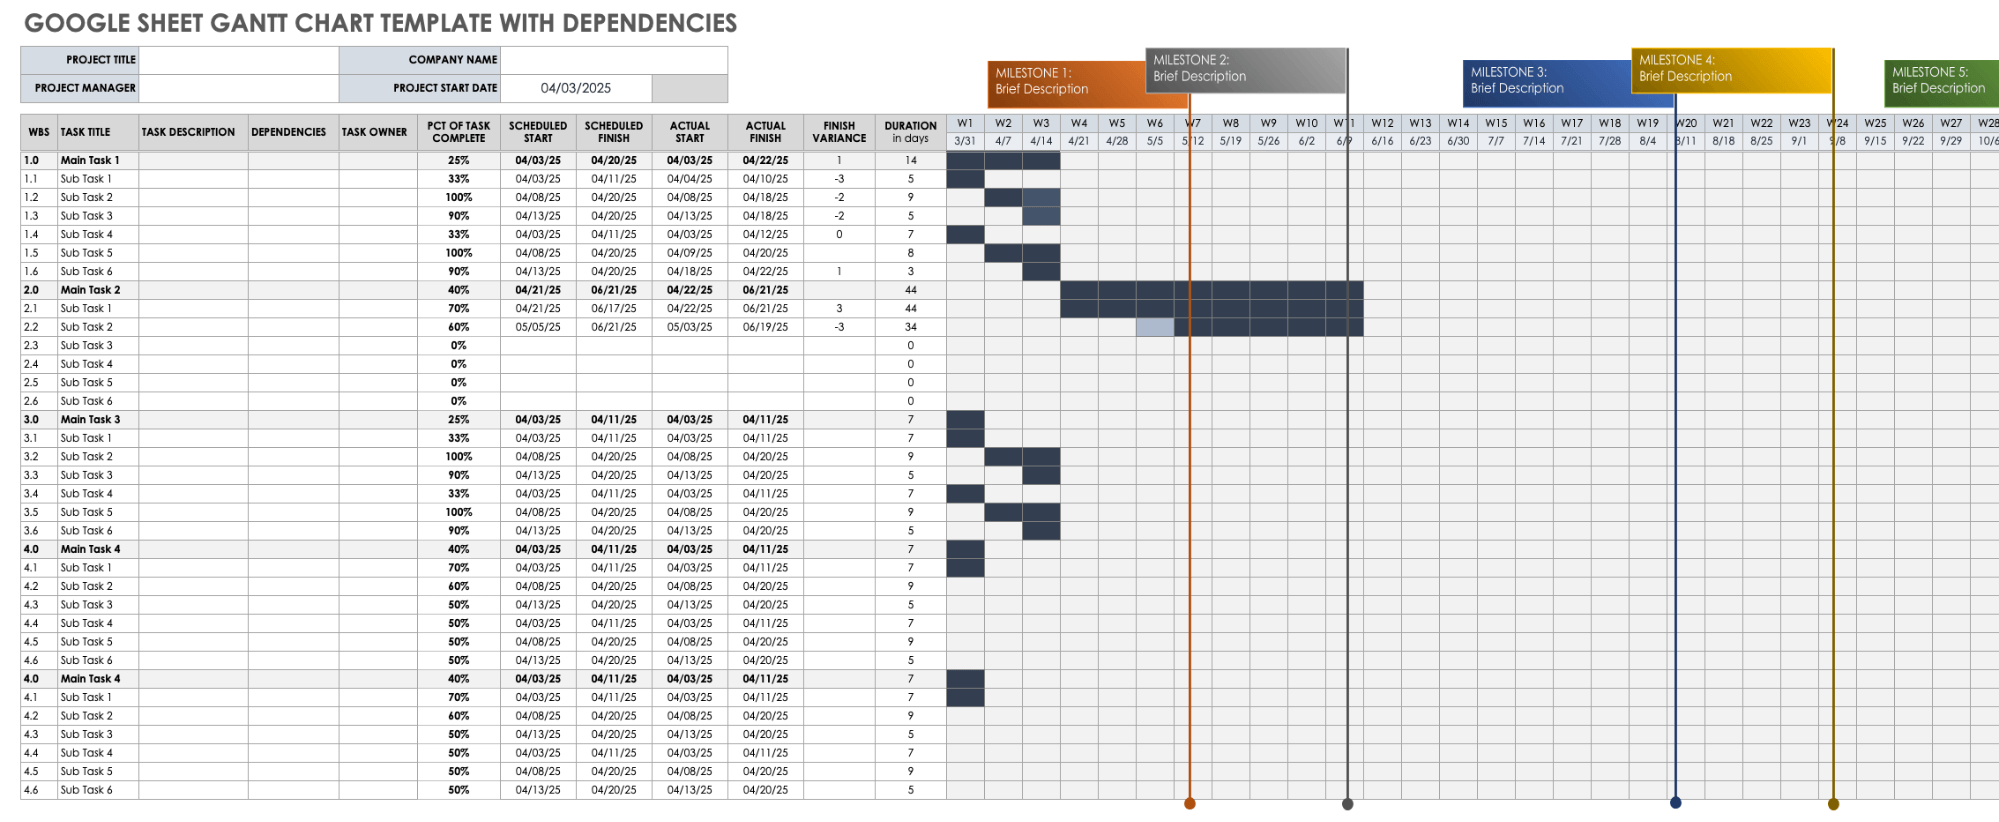
Download a Gantt Template with Dependencies for Google Sheets
When to Use This Template: Manage projects and share progress with stakeholders using this Google Sheets Gantt template. It helps you plan and track project milestones while allowing easy collaboration.
Notable Template Features: This template includes a breakdown of tasks, assigned owners, task dependencies, and task duration.
For more Gantt chart templates, including a Scrum project management template with burndown chart, see this complete Google Sheets Gantt chart collection.
PowerPoint Gantt Chart with Dependencies Template
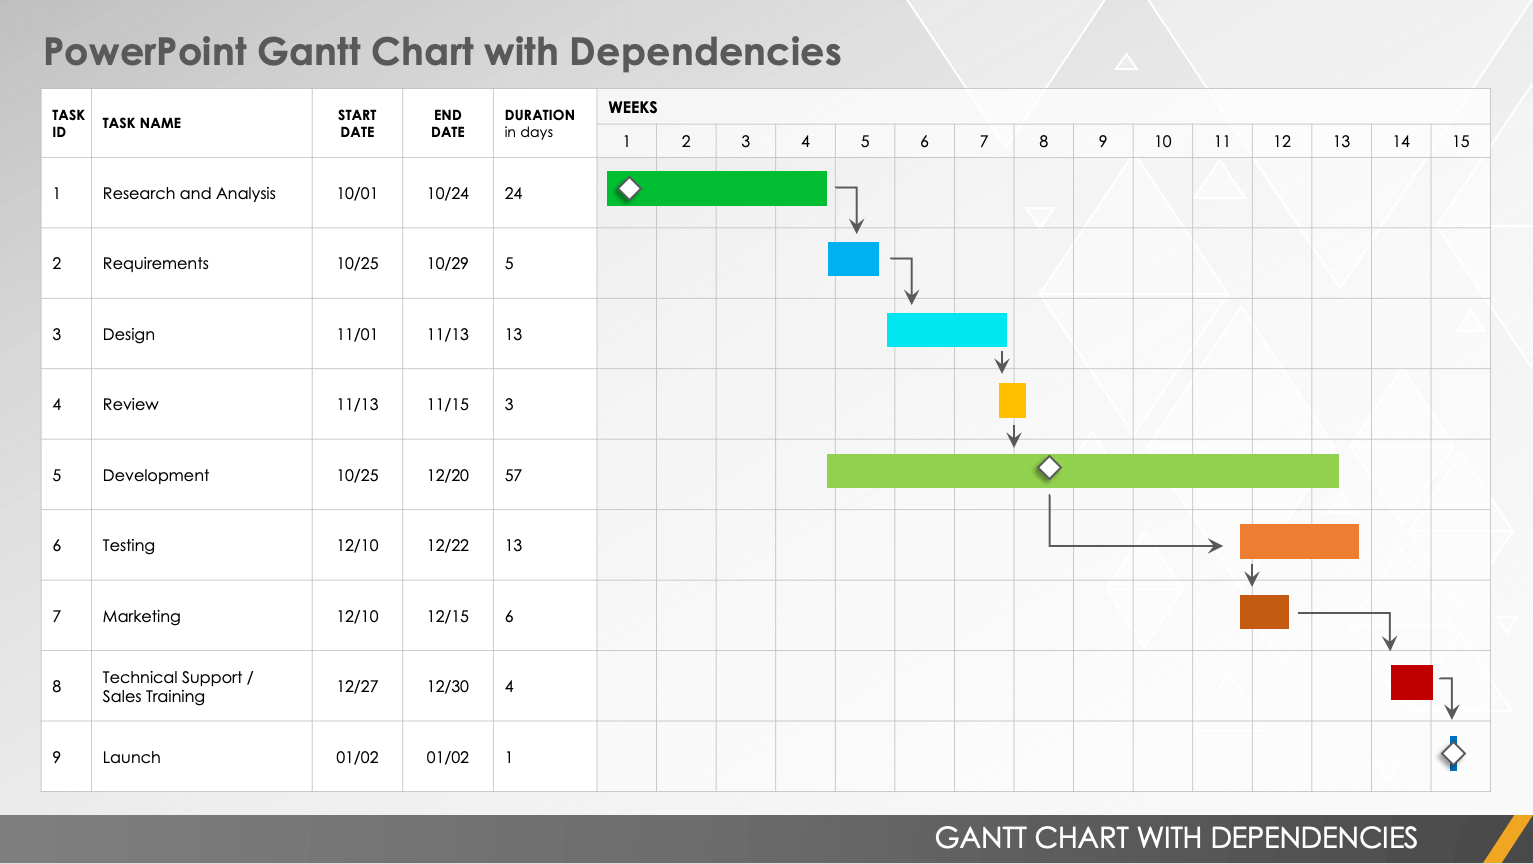
Download a PowerPoint Gantt Chart with Dependencies for PowerPoint
When to Use This Template: Create a PowerPoint Gantt chart for any project you want to plan, track, and share with stakeholders. This template is ideal for displaying a list of tasks, start and end dates, and the duration for each task as part of a presentation.
Notable Template Features: Use connecting arrows to highlight dependencies between project tasks and to represent current or completed tasks with different colors or partial shading on the bar chart.
Agile Gantt Chart Template

Download an Agile Gantt Chart Template for
Excel
| Smartsheet
When to Use This Template: This Gantt chart provides a snapshot of project planning, which you can update and modify as the team completes each sprint. Use this template to easily track overall progress and view dependencies for every sprint. This template provides the flexibility of an Agile approach with the organization of a Gantt chart.
Notable Template Features: This Agile Gantt chart template is divided into individual sprints to display features, story points, task owners, and project status. An additional Comments section supports planning and communication among team members.
Release Plan Gantt Chart Template
Download a Release Plan Gantt Chart Template for
Excel
| Smartsheet
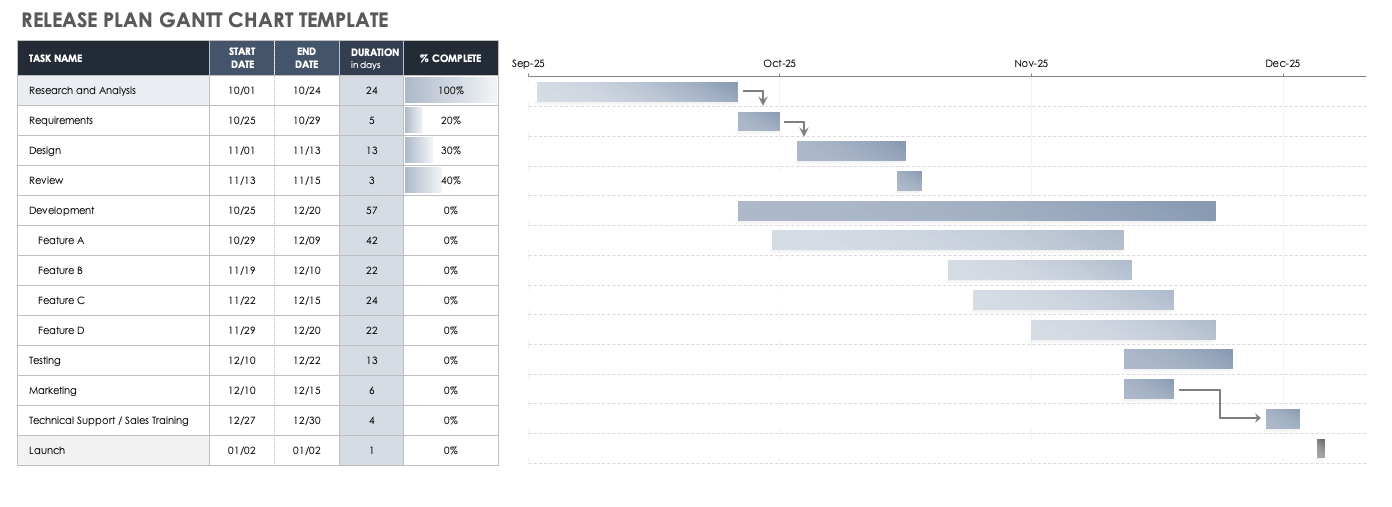
When to Use This Template: Use this Excel template to manage release planning, from initial stages to development, quality assurance, promotion, and final launch.
Notable Template Features: The template provides a spreadsheet for compiling project data, including timelines for all project activities and current progress for each task. The Gantt chart provides a visual overview of release stages and dependencies between tasks. Edit the template to cover each step in your release plan.
Multiple Product Gantt Chart with Dependencies
Download a Multiple Product Gantt Chart with Dependencies Template for
Excel
| Smartsheet
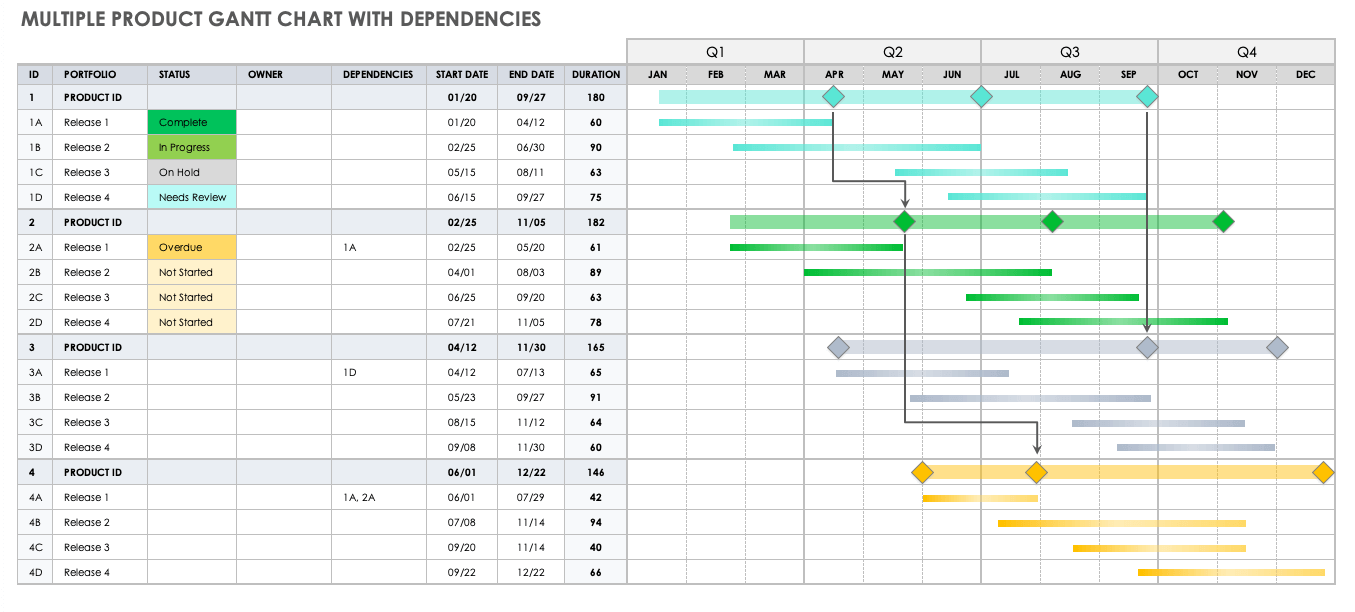
When to Use This Template: Use this basic Gantt chart to track the time frame and progress of multiple product releases, and mark dependencies between them.
Notable Template Features: This template is useful for organizing a product portfolio, visualizing deadlines, and tracking release status. Customize the template by adjusting the color scheme or adding columns for additional data.
Benefits of Using Gantt Chart Dependencies
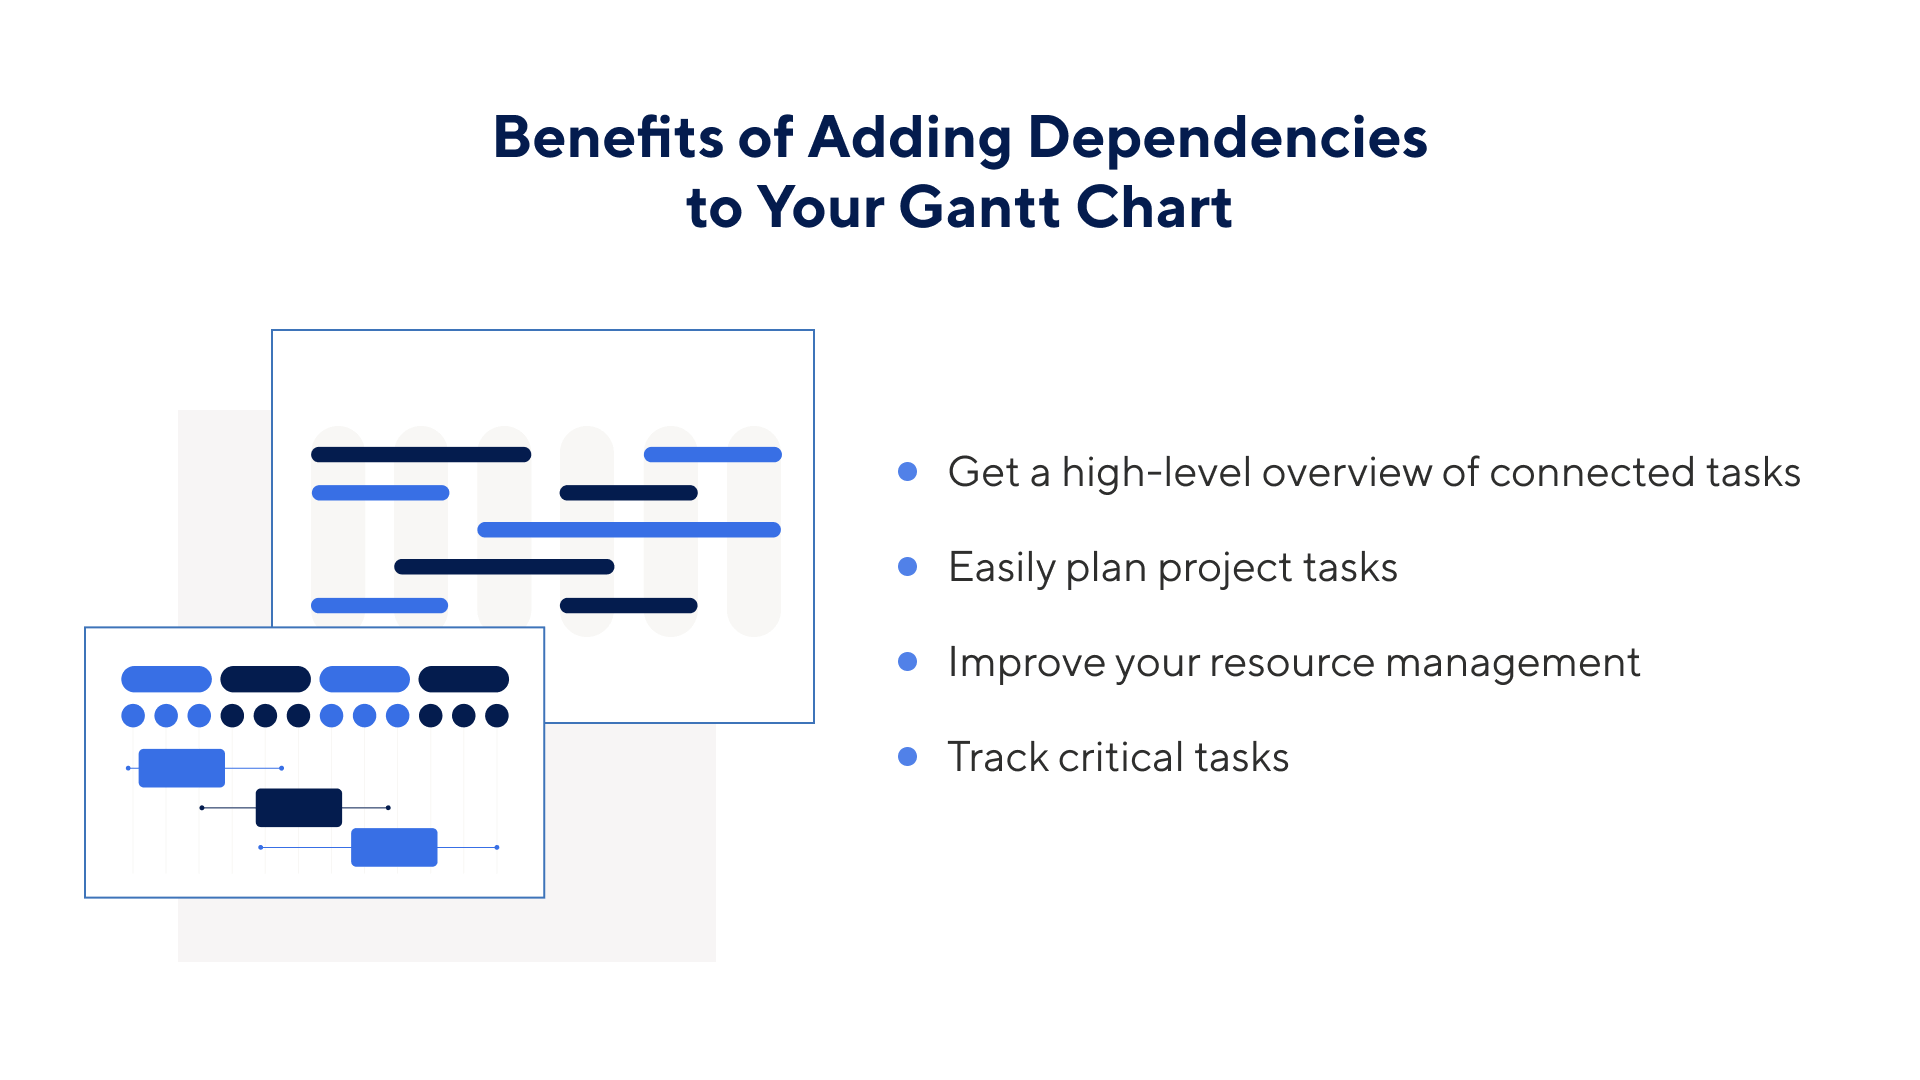
Gantt chart dependencies help you visualize a high-level overview of connected tasks. This helps in project task planning while also improving resource management and risk mitigation. Gantt charts are easily modifiable and flexible to use, and they foster cross-team clarity.
Learn more about these benefits in greater detail:
- High-Level Visualization: A Gantt chart can give you a high-level overview of your dependencies. It shows you which tasks are connected without overloading the project manager with too much information.
- Scheduling: Identifying dependencies puts you in a better position to easily plan your project tasks and schedule your work appropriately, as you can see which tasks rely on which.
- Resource Management: When you can see which tasks depend on each other, you can make more informed decisions about how and when to allocate your resources. For example, if the marketing department needs to complete a task before another task by the design team can begin, it makes sense to allocate budget to marketing first and make sure their task gets done and doesn’t hold up other items.
- Risk Mitigation: With dependencies in place, project teams can easily see if critical tasks are delayed. Teams can spot these delays quickly and get proceedings back on track to hit the deadline.
- Flexibility: Gantt charts are easily changed to reflect delays or schedule moves. This helps you make and manage changes while being able to keep track of the full up-to-date timeline.
- Cross-Team Clarity: The Gantt chart visualization allows all team members to understand the project’s timeline and how task deadlines fit in the timeline so they can best perform their role.
Categories of Project Dependencies
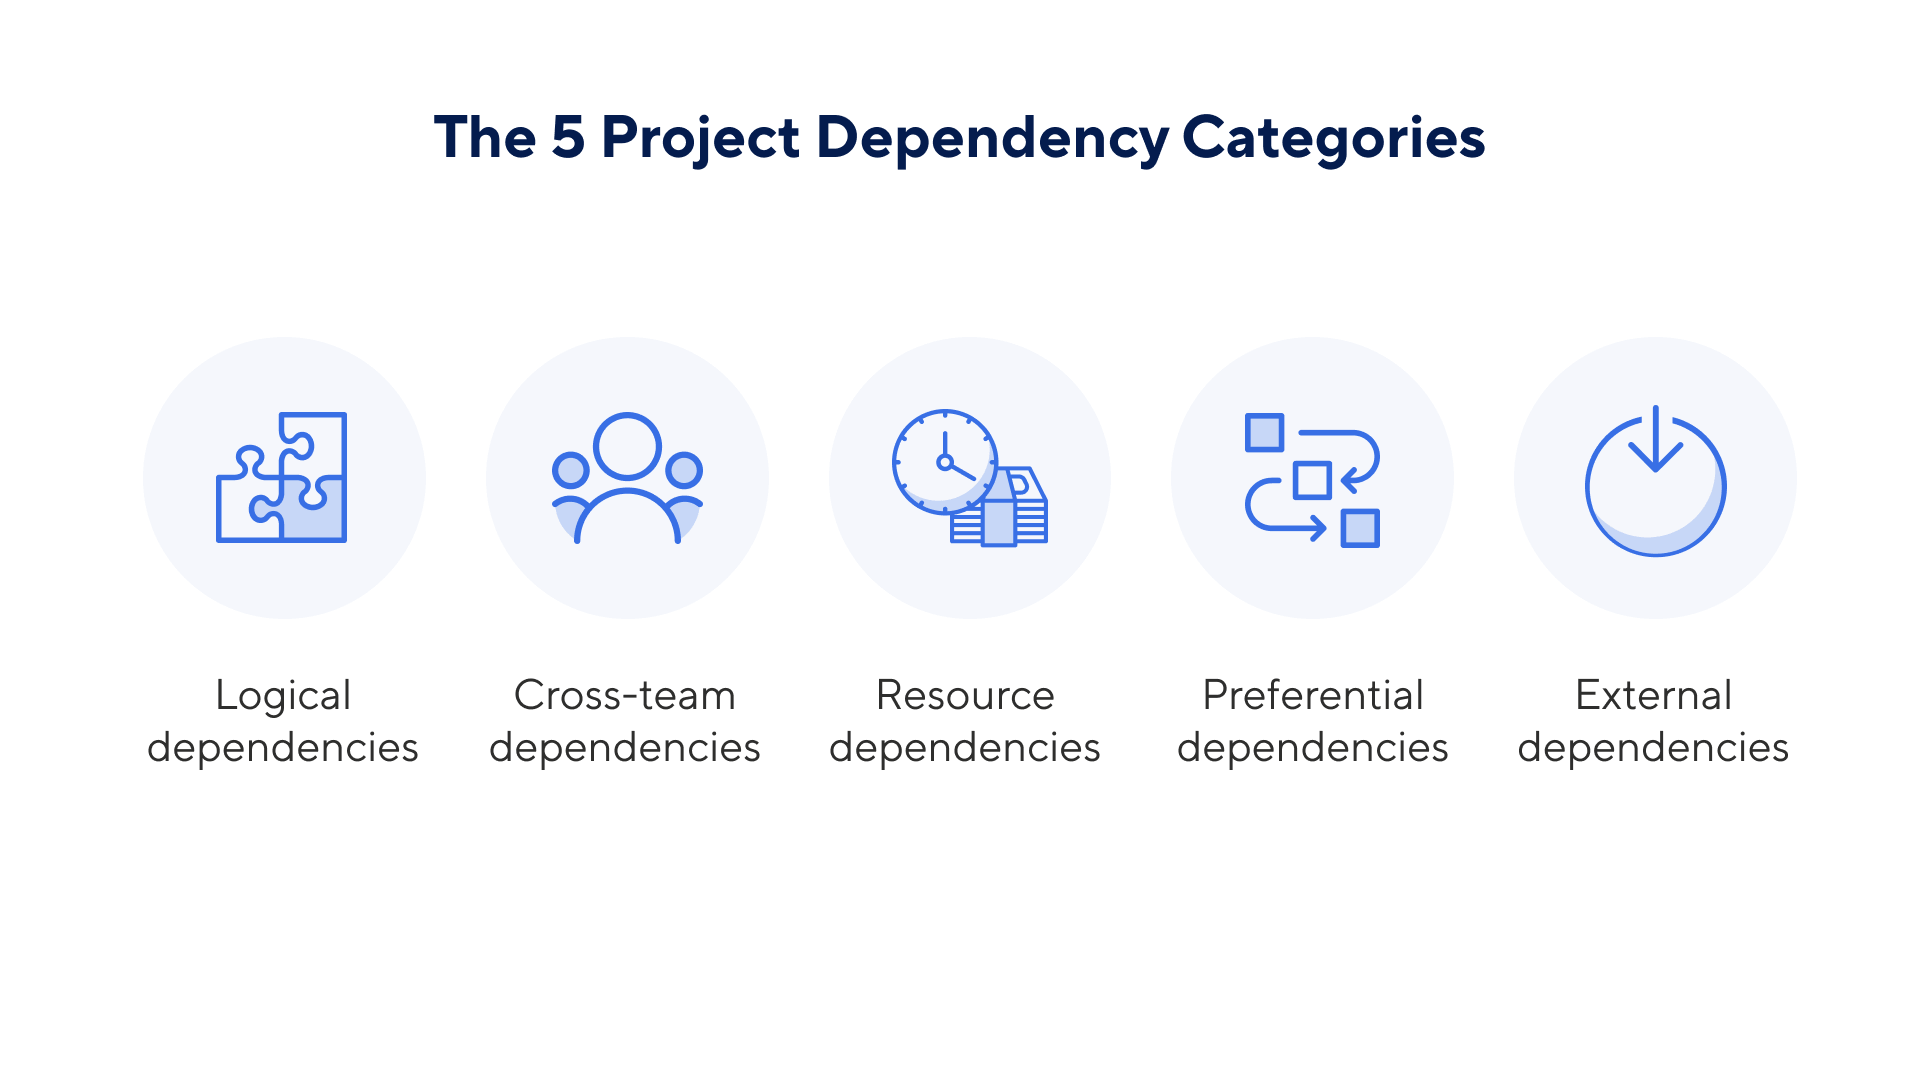
There are five categories of project dependencies. Logical dependencies are when one task must be completed before the next can logically begin. Cross-team and resource dependencies involve scheduling team members and resources based on availability. Preferential dependencies cover preferred deadlines. External dependencies refer to details beyond your control.
Here are the five categories of project dependencies, with examples:
- Logical Dependencies: A logical dependency — also known as a causal dependency — is crucial to the project’s success, and it can’t run simultaneously with another task. For this reason, logical dependencies are usually finish-to-start dependencies, where output is required from the previous task for the following task to occur. An example of this is purchasing construction equipment in order for the building team to be able to start work.
- Cross-Team Dependencies: Cross-team dependencies are any tasks that rely on the work of more than one team. In product development, for example, the development team needs information from the marketing team about customer needs and wants. Therefore, developing the new product is dependent on the marketing team conducting market research and sharing their findings.
- Resource Dependencies: If your project has limited resources, you might have resource dependencies. These occur when there is a limited number of people to work on a given task — or when one person is relied on to complete multiple tasks. An example could be design work, where the same graphic designer is expected to handle both a logo and a website mockup (without being overextended). In this example, the two tasks can’t be scheduled simultaneously.
- Preferential Dependencies: Unlike logical dependencies, preferential dependencies aren’t required for project completion. Instead, they reflect the team’s preferences and are built into the project plan. As an example, think about a specific approval process that involves three different managers approving a campaign before it goes live. This process reduces the chance of the mistakes, but it’s not critical to project delivery.
- External Dependencies: These are dependencies outside of your control. For example, the graphic designer cannot finalize website mockups or logos until the client has sent over the final approved color palette — but you don’t have control over when that will happen.
Learn more about the different types and categories of project dependencies.
Tips for Managing Project Dependencies
Managing project dependencies becomes easier when you identify each dependency, visualize them in charts, and use the right tools to track them.
Here are some tips and best practices for managing project dependencies:
- Identify the Type of Dependency: Start by identifying the type of dependency you face. This will put you in a stronger position to manage it, ensure you’re on top of what could go wrong, and plan how to overcome any of these challenges.
- Use the Right Software: To ensure you have a clear picture of your dependencies, you need a platform that allows you to manage your dependent tasks. This is where using the right project management software comes in. Online Gantt chart software enables you to easily connect your dependent tasks and even identify the critical path.
- Visualize Your Dependencies: To easily spot dependencies in your Gantt chart or any tracker, it’s helpful to color-code the tasks. For instance, you might choose to have all your dependent tasks in red and all other tasks in blue. This makes it easier for you to see your dependencies at a glance.
- Update Regularly: As the project progresses, you’ll need to continually track your dependencies to make sure plans are running as scheduled, and add updates as circumstances change. A good way to do this is to add percentages to tasks. An online platform such as Smartsheet shows you how they’re progressing in real time. If any dependencies are falling behind, you can spot it while it’s happening and figure out how to fix it.

Tomasz Kowalski, Senior IT Manager at Masa Consult, suggests making sure you’re identifying your dependencies accurately, using lags and leads, and trying to reduce the number of dependencies your project has where possible. - Understand the Types of Dependencies: It’s important to use the different types of dependencies — finish-to-start, start-to-start, finish-to-finish, and start-to-finish — in the right context, Kowalski says.
- Use Lags and Leads: If required, add lags to your dependencies: “Wait for a few days after task A finishes before you start task B,” Kowalski says, or “use negative lags, also known as leads, if you want the proceeding task to start before the previous is finished.” This adds flexibility to your timeline by accounting for gaps or waiting periods, while also allowing you to speed up your timeline where possible.
- Minimize Dependencies: The more dependencies you use in your Gantt chart, the more complicated the project plan is, and the more difficult it will be to introduce changes, Kowalski says. “Avoid crowding. Reduce and optimize dependencies where possible — later it will be difficult to make changes in the plan once the execution starts.
- Update Records Continuously: “Update your records continuously so that you can keep the project moving smoothly,” Kowalski says. “Make sure anyone who has access to the chart has the most up-to-date information on the project to make their decisions.”
Learn how to use the critical path method to improve your project planning and timeline. You can find useful critical path examples and a variety of critical path templates to apply this method to your own projects.
Build Gantt Charts With Dependencies in Smartsheet
Build a Gantt chart with dependencies in Smartsheet for critical path analysis. With Smartsheet’s Gantt chart, you can link tasks and create predecessors, add dependencies to the timeline, and organize tasks finish to start, start to start, and more. You can also create subtasks and the chart will automatically calculate task completion percentage.
Learn how to create a Gantt chart in Smartsheet, and download Gantt chart software.
Easily Track Task Dependencies With Smartsheet for Project Management
From simple task management and project planning to complex resource and portfolio management, Smartsheet helps you improve collaboration and increase work velocity -- empowering you to get more done.
The Smartsheet platform makes it easy to plan, capture, manage, and report on work from anywhere, helping your team be more effective and get more done. Report on key metrics and get real-time visibility into work as it happens with roll-up reports, dashboards, and automated workflows built to keep your team connected and informed.
When teams have clarity into the work getting done, there’s no telling how much more they can accomplish in the same amount of time. Try Smartsheet for free, today.

