What Is a Product Portfolio Matrix?
A product portfolio matrix is a method that organizations use to analyze their product portfolio and make strategic decisions. The standard matrix approach focuses on growth and market share with defined measurement dimensions, and the custom approach offers more flexibility.
Although introducing a new concept can be challenging, numerous methodologies are available to ease the transition to a structured product portfolio management strategy. Practitioners of scoring methods use numeric scales (based on industry-relevant questions) to determine a product's effectiveness in a given market. According to research, more than 37 percent of today's companies use scoring as a primary method for product portfolio management and strategy. For companies that prioritize financial gains, scoring is one of the most effective tools.
Below is a list of standard and custom product portfolio model or matrix examples:
Boston Consulting Group (BCG) Product Portfolio Matrix
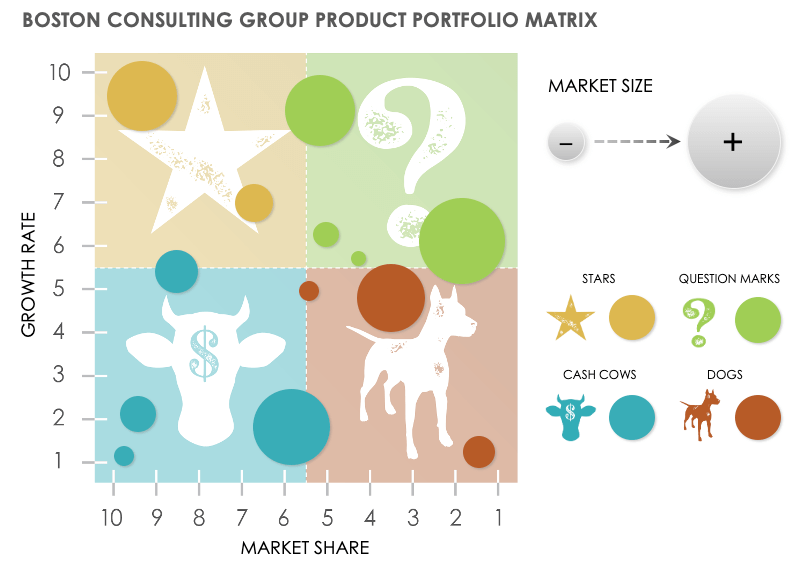
The BCG matrix is one of the most popular product portfolio analysis techniques. The BCG matrix uses an X-Y graph to measure product relative market share and market growth. You can find an in-depth discussion of the BCG approach below.
Download Boston Consulting Group Product Portfolio Matrix Template
Excel | Word | PowerPoint
Business Profile Matrix
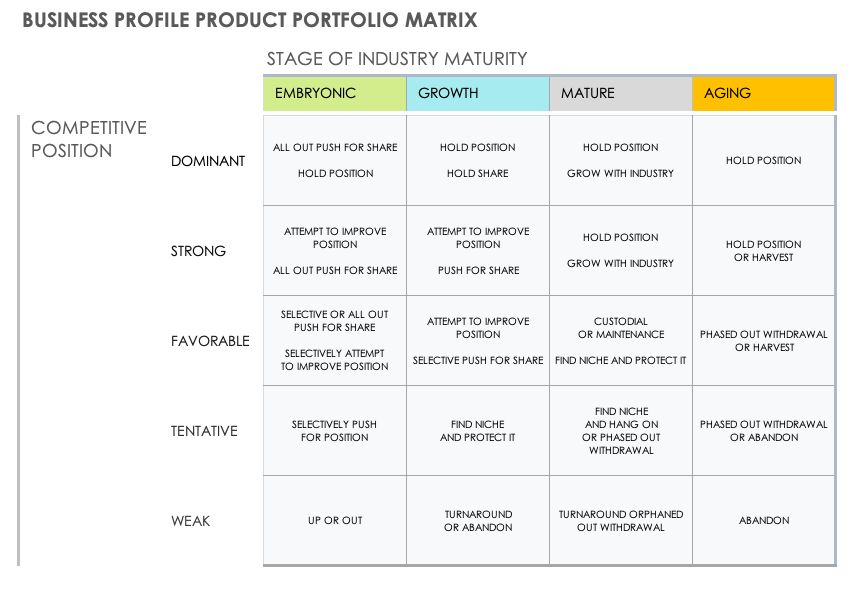
The business profile matrix is another X-Y axis matrix made up of 20 boxes. The matrix measures the competitive position, from dominant to weak, and stage of industry maturity, from embryonic to aging.
Download Business Profile Product Portfolio Matrix Template
Excel | Word | PowerPoint
Directional Policy Matrix
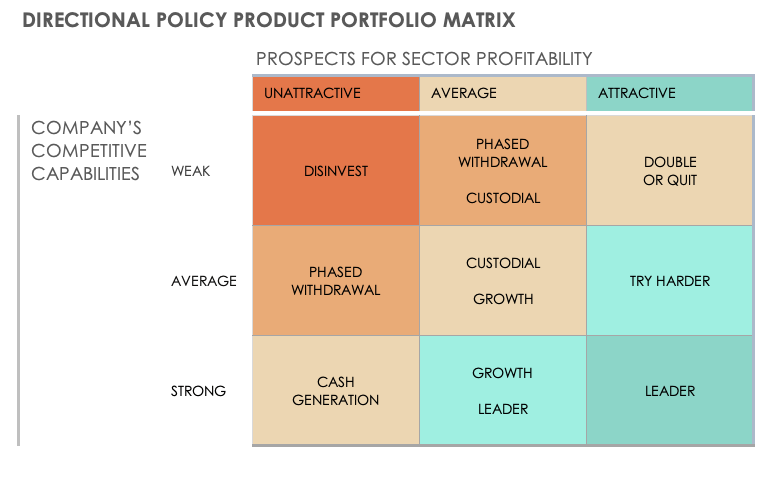
The directional policy matrix consists of 9 boxes in an X-Y matrix that measure competitive capabilities, from unattractive to attractive, and prospects for sector profitability, from weak to strong.
Download Directional Policy Product Portfolio Matrix Template
Excel | Word | PowerPoint
Hofer's Product-Market Evolution Matrix
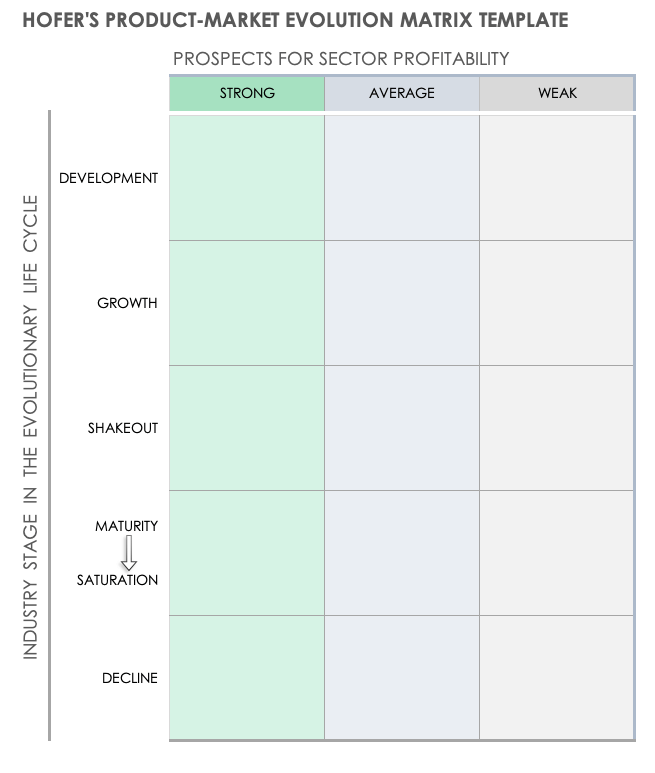
This five-by-three grid measures the product-market evolutionary lifecycle stage and competitive position. It was developed by Charles W. Hofer to refine the GE/McKinsey matrix and is also called the lifecycle portfolio matrix.
Download Hofer's Product-Market Evolution Matrix Template
Excel | Word | PowerPoint
Custom Matrix Template and Examples
For all custom matrices, the organization of the chart defines the dimensions. Below are some examples of common custom matrices:
- Analytical Hierarchy Process Matrix: Use this product portfolio management matrix to assess any number of psychological and mathematical criteria when making product decisions and evaluating alternative solutions.
- Conjoint-Analysis Matrix: Use this matrix to determine the impact of various product attributes on product performance.
- Product Performance Matrix: This matrix is based on expected results in response to different marketing strategies.
- Risk/Return Matrix: This matrix evaluates the expected return and risk. The goal is to identify products that provide maximum return for a given risk.
- Stochastic Dominance Matrix: This matrix helps you determine the superiority of one product over another using risk/return evaluation.
You can use the following blank template to customize your own matrix. The template contains a three-by-three X-Y grid. You can use this to analyze two variables based on your unique business needs. You can expand the nine grid boxes to measure additional levels within each variable.
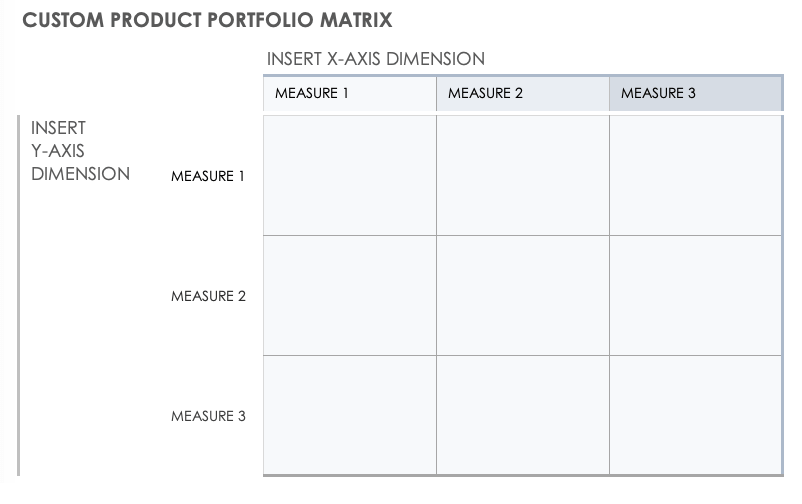
Download Custom Matrix Template
Excel | Word | PowerPoint
Product portfolio matrices, bubble charts, and scoring and mapping methods all provide data and visualizations to help make the decisions for effective product portfolio management. You can also add the heuristic philosophy, which gives weight to other elements such as experience, common sense, or an educated guess in order to enhance the scoring and mapping methods. This approach is especially useful when dealing with estimated or inconclusive data.

Zane Bond, Senior Product Manager at Cisco, has used several techniques when managing his product portfolios. "The best thing about using a scoring method is that it removes purely emotional factors from making investment decisions," he says.
"The weighted shortest job first (WSJF) system works well for small to medium-sized teams. It creates a common weighting system based on data. For example, we start by strategically understanding where we want to go, and then translate those goals into what we will do tactically. Rather than rationalizing acquisitions, new products, or features based on what we feel, data-driven scoring is based on the business value, impact, profitability, and how quickly we can get the product or feature to market," Bond says.
Today, numerous software tools provide product portfolio roadmaps to manage your portfolio over time. Many use this kind of overview, along with timelines and other visual aids, to support strategies for a cross-section of products. As with all methods, consider the following when developing or creating a product portfolio strategy or roadmap:
- Identify the overall goals of the initiative.
- Prioritize product development or elimination.
- Link development work to overall corporate strategy.
- Communicate effectively to drive results.
For more resources to help you manage your product portfolio, choose from a variety of free product portfolio management templates.
The Boston Consulting Group (BCG) Product Portfolio Matrix
For greater visualization, the BCG matrix is a popular technique that uses an X-Y graph to analyze a product against its overall market. The Boston Consulting Group developed this premier X-Y grid that measures market growth and market share.
Their BCG Matrix depicts four quadrants that distinguish high and low markets and a product's position in those markets. The products are categorized as stars, cash cows, dogs, and question marks.
Stars, which are dominant products in a growing market, and cash cows, which are legacy products that control a steady or diminishing market, make up the bulk of profitability for a company. Dogs are low-yielding products in a declining market that drain resources and are contenders for elimination. Product decisions are most difficult around question marks, which are products that have some level of potential for innovation in a growing market. You can enhance investment risk analysis by adding a bubble chart or scoring system to identify breakthrough products (versus those that end up in the "dog house").
How to Use the BCG Matrix
The BCG matrix helps with long-term product planning. By positioning products in the star, cash cow, dog, and question mark quadrants, you can identify where to invest and discontinue investments. Some organizations apply their build, hold, harvest, and divest strategies to the BCG matrix. Recommendations for each quadrant are as follows:
- Cash Cows: A cash cow is a well-established product that is mature and profitable, commonly with little investment. “Milk” these products as long as you possibly can. A harvest strategy may apply to a cash cow to reduce the investment and gain maximum profit.
- Dogs: Discontinue dog products, as they are either breaking even or draining resources. A divestment strategy applies to a dog that no longer has interest or need for investment. In some cases, a company may choose to keep a dog product because it is creating jobs or offering other indirect benefits.
- Question Marks: Since you don’t know whether a question mark will become a star, it is always a risky investment. Question marks require extensive analysis to determine future potential. A build strategy with increased investment applies to a question mark that may become a star.
- Stars: These market-leading products require continuous investments to remain stars above the competition. Companies hope to turn stars into cash cows. A hold strategy applies to a star if you want to continue to benefit from its growth.
In a perfect scenario, products begin their life as question marks, become stars, transition to cash cows, and finally end their life as dogs. Diversification across each quadrant is an ideal and balanced portfolio: stars deliver future growth, cash cows fund the business, and question marks may be the next stars.
Relationship Between Product Portfolio and Product Lifecycle
The product lifecycle begins with the introduction of a product and ends with its retirement. Each product that enters the market has a lifecycle — some longer, and some shorter. Analyzing the product lifecycle can help a company determine product strategy, similar to product portfolio management.
When a product is first made available, it falls into the question mark or star quadrant of the BCG matrix – somewhere between unknown to high growth and benefit. From the star quadrant, products ideally move into cash cows where the growth is stable, but the benefit is still high. The new product may end up in the question mark quadrant if the item does not continue to increase market share. As time progresses, all products slow down, losing market share and growth. A product’s diminishing return tells you it's time for retirement.
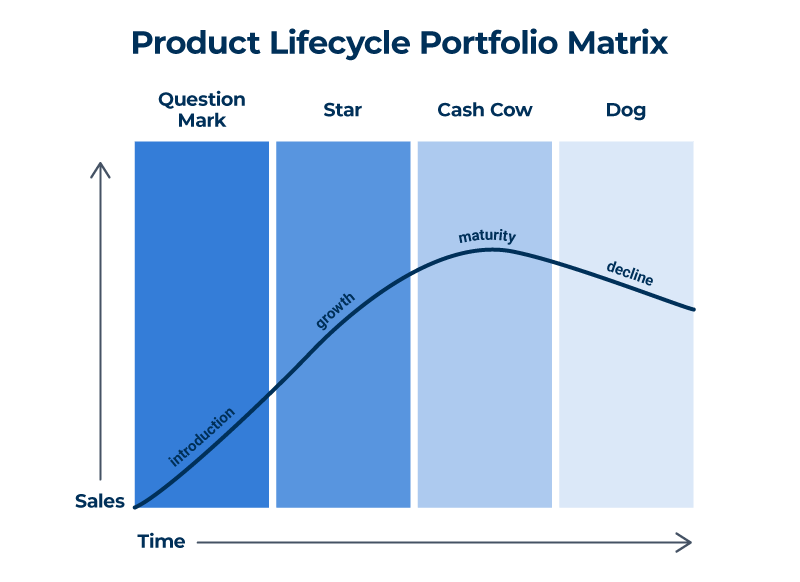
Product Lifecycle Portfolio Matrix Relationship
The product lifecycle portfolio matrix demonstrates the relationship between the product portfolio when analyzed in a BCG-style matrix and the market lifecycle of a product from launch to retirement. This diagram illustrates the relationship between the BCG matrix quadrants and the product lifecycle.
Pitfalls to Avoid When Using a Product Portfolio Matrix
Product portfolio analysis is essential to ensuring a balanced portfolio of products. When using a matrix to gain visibility into your entire portfolio, try not to focus solely on the successful and highly profitable products, such as stars and cash cows; doing so will create an unbalanced portfolio. This is especially true for new products that are classified as question marks — the potential future stars and cash cows that require attention to ensure continued growth.
Conversely, don't instantly retire dogs — look at overall business contributions. In some cases, dogs contribute in ways not directly related to money. As mentioned earlier, dogs may be a source of jobs. Lastly, avoid overinvesting in all question mark products, as they may not all result in stars. In some unfortunate situations, a new product may be unsuccessful and require early retirement.
How to Determine Which Product Portfolio Matrix Model to Use
Your product portfolio can shift at a moment's notice. Consider the global pandemic and the immediate need for many businesses to change course to meet market demands or to merely survive. It is essential to have a process in place to ensure quick visibility and understanding of your entire portfolio and product performance.
For example, when the global pandemic left many businesses without their expected buyers, they shifted to producing and selling high-demand products, such as hand sanitizer or PPE. These businesses had to quickly understand where they could decrease investments temporarily (or permanently) to increase investment in new products. But how does an organization know what product portfolio analysis model is appropriate for their business?

"The BCG matrix and the GE/McKinsey matrix are useful tools, but each has its strengths and weaknesses,” says Roger Snyder from 280 Group. “The BCG matrix is simpler to use, measuring only the product’s market share versus the overall market growth rate. It is helpful when your products serve markets with very different market growth rates, but is less useful if the products are all in the same market or have similar growth rates.”
The GE/McKinsey matrix is more sophisticated, but therefore requires more work to use effectively. "I do find it useful, though, when a company has a clear set of strategic objectives. For example, if a company has set the goal to increase profit margins, then the GE/McKinsey matrix can be used to measure business strength for each product with cost of goods sold (COGS), and market attractiveness with price sensitivity. Products with low COGS, operating in markets with low price sensitivity, represent significant opportunities worth prioritizing over products that are less attractive by these measures,” says Snyder.
Your business determines your approach to product portfolio matrices. The question to ask is whether the model, such as the BCG matrix, fits your company’s needs. If not, perhaps a tailored approach is better. Look at your portfolio of products and the dimensions you want to analyze.

“Each matrix has merits based upon your focus — one emphasizes purely financial benefits, whereas the other looks more holistically at the strengths and weaknesses of the product or business unit,” says Matthew Muldoon, Chief Product Officer, KeyedIn. “If you determine what your basis for measuring success is first, then the best matrix to use will become apparent.”
Make Better Decisions, Faster with Smartsheet Dashboards
Empower your people to go above and beyond with a flexible platform designed to match the needs of your team — and adapt as those needs change.
The Smartsheet platform makes it easy to plan, capture, manage, and report on work from anywhere, helping your team be more effective and get more done. Report on key metrics and get real-time visibility into work as it happens with roll-up reports, dashboards, and automated workflows built to keep your team connected and informed.
When teams have clarity into the work getting done, there’s no telling how much more they can accomplish in the same amount of time. Try Smartsheet for free, today.