PowerPoint Arrow Fishbone Diagram Template
Download the Arrow Fishbone Diagram Template for PowerPoint
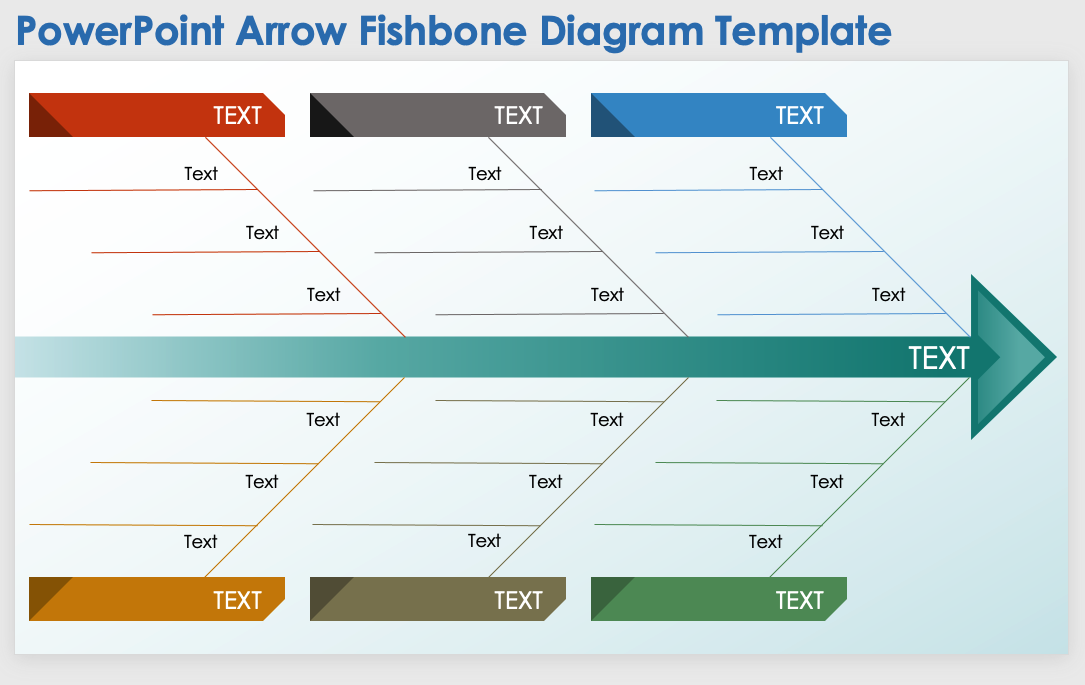
When to Use This Template: Project managers and team leaders can use this fishbone diagram template during brainstorming sessions to identify potential causes of a problem. The template serves as a visual aid for teams to categorize contributing factors to an issue. Consultants might also find this template useful when conducting organizational diagnostics or process improvements.
Notable Template Features: The template features a dynamic, arrow-shaped design that visually directs attention toward the main problem statement or goal. It provides multiple text boxes for entering detailed descriptions. The color-coded sections also simplify the task of distinguishing between categories, making it intuitive for the team to follow and participate in the discussion.
PowerPoint Bold Fishbone Diagram Template
Download the Bold Fishbone Diagram Template for PowerPoint
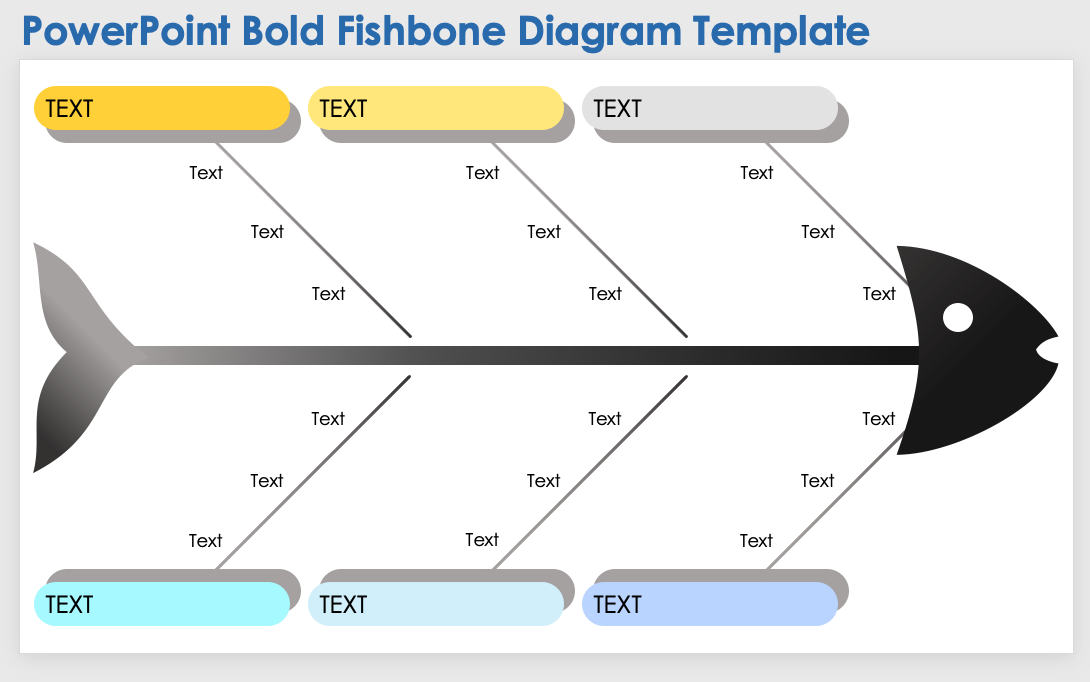
When to Use This Template: Use this fishbone template in strategic planning sessions where clarity on the factors contributing to a business challenge is critical. Brainstorm with team members to drill down into specific elements of a larger problem and uncover the root causes of issues.
Notable Template Features: This template offers bold lines that clearly separate different categories or causes and enhance readability, keeping team members focused and engaged. The slide includes ample space for text so that teams can articulate and map out complex issues.
PowerPoint Symbols Fishbone Diagram Template
Download the Symbols Fishbone Diagram Template for PowerPoint
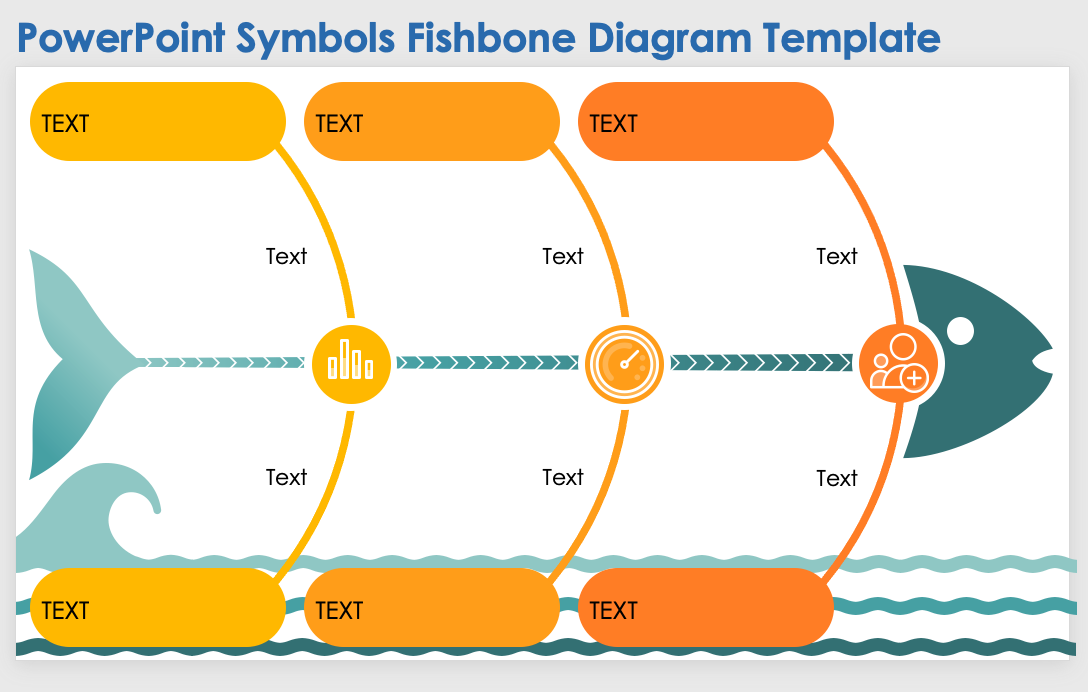
When to Use This Template: This fishbone chart is perfect for collaborative settings, such as workshops or team meetings where visualizing the relationship between various factors and a central objective is essential. The template can be a tool for product development teams that need to trace issues back to operational, technical, or human factors. Marketing teams can use the diagram to dissect campaign elements and identify different influences on outcomes.
Notable Template Features: The diagram uses easy-to-understand symbols for categories such as human resources, processes, and research. The placement of the symbols helps you easily organize thoughts and discussions around the central problem, while the template’s colorful design enhances its visual appeal.
PowerPoint Traditional Ishikawa Diagram Template
Download the Traditional Ishikawa Diagram Template for PowerPoint
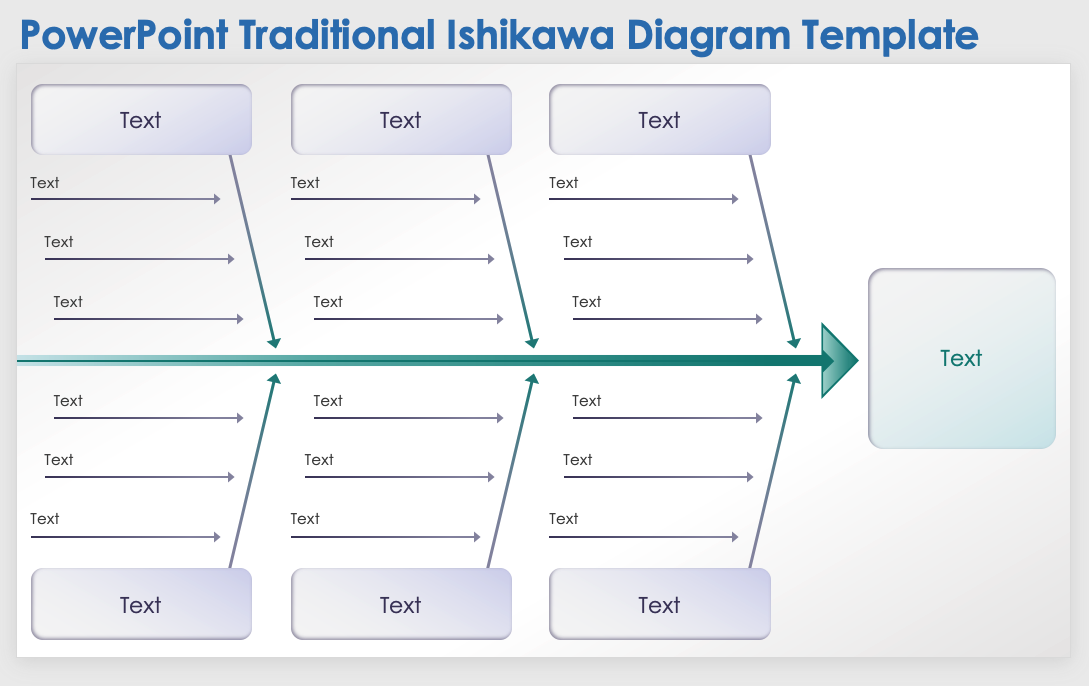
When to Use This Template: This Ishikawa diagram is well suited for root cause analysis in quality management scenarios, such as in manufacturing or software development. The template is also an effective tool for educators in academic settings to teach problem-solving methodologies.
Notable Template Features: The template displays primary and secondary causes with branching lines, offering a multilevel perspective on the issue at hand. This allows teams to delve into further detail and systematically break down challenging problems. The diagram also draws attention to the central problem, promoting a clear and focused analysis during team discussions.
For more free problem-solving resources, see this complete collection of root cause analysis templates and this comprehensive guide to problem-solving techniques.
PowerPoint 8-Prong Fishbone Diagram Template
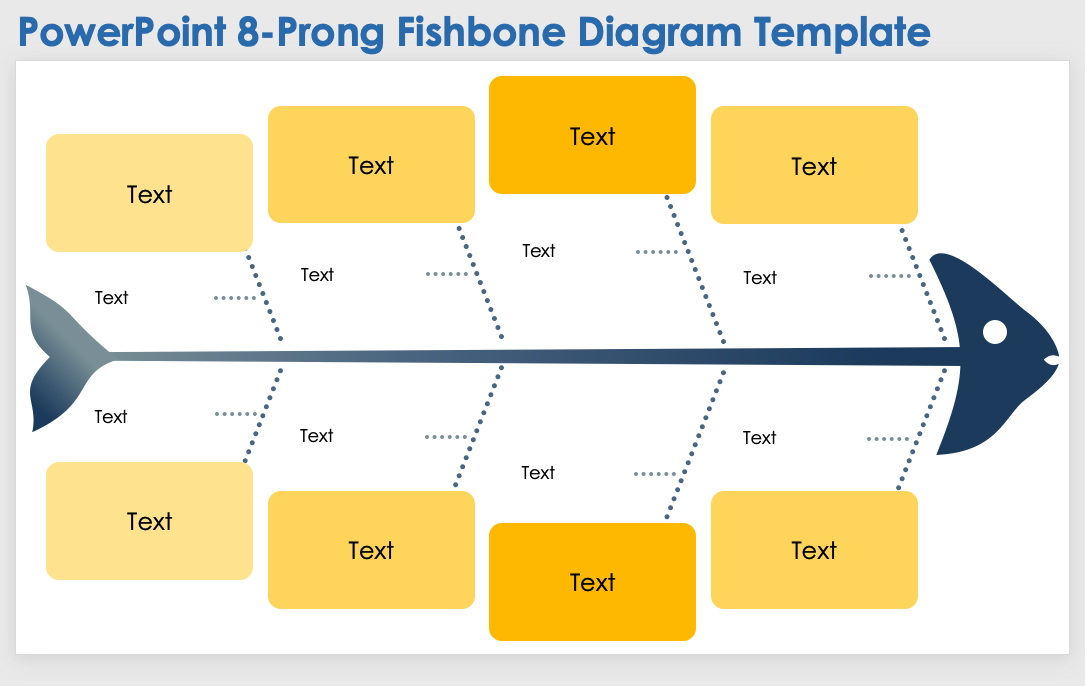
Download the 8-Prong Fishbone Diagram Template for PowerPoint
When to Use This Template: This diagram is ideal for comprehensive problem-solving sessions — such as cross-functional team discussions or multifaceted project evaluations — where multiple factors contribute to the central issue. The template enables a detailed exploration of complex issues, such as organizational changes or product failures.
Notable Template Features: With eight distinct bones, this diagram allows for a thorough root cause analysis. The template accommodates a broad range of ideas, ensuring that no potential cause is overlooked. The colorful, segmented layout aids in visual organization and helps with sorting brainstormed ideas into relevant categories.
PowerPoint 3D Fishbone Diagram Template
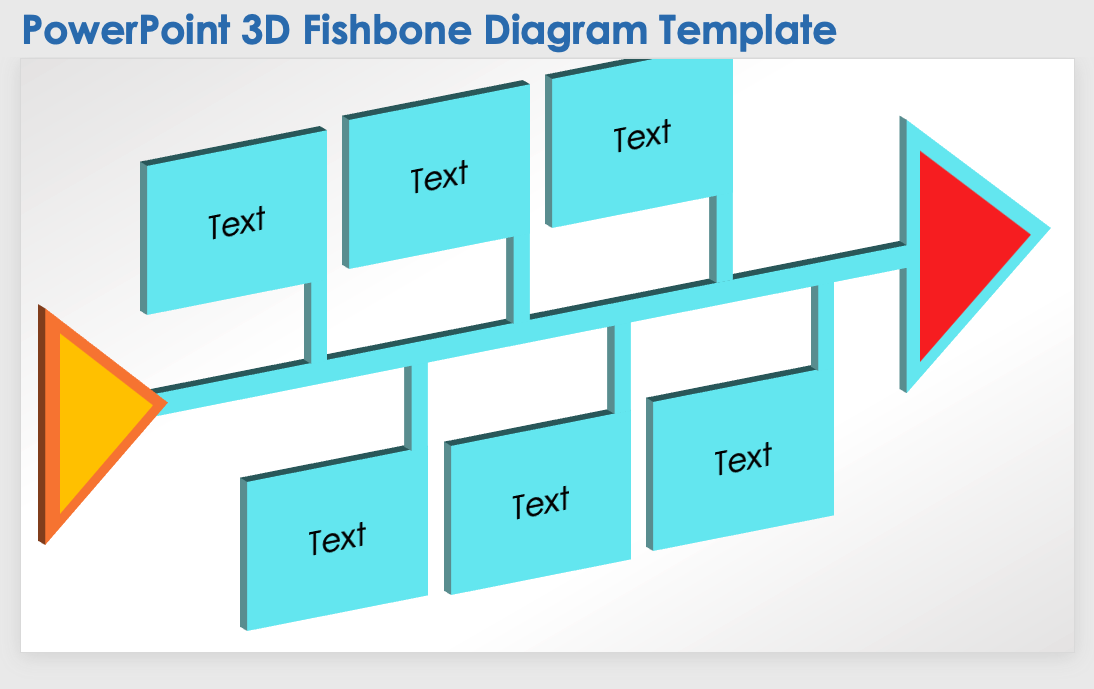
Download the 3D Fishbone Diagram Template for PowerPoint
When to Use This Template: This 3D fishbone diagram template is designed for situations where an engaging presentation is crucial, such as client pitches. Professionals in visually driven environments, such as advertising, creative industries, or education, might find it especially useful. The template is also an effective tool for team-building events where visual metaphors can enhance understanding and retention.
Notable Template Features: This template's 3D design brings a unique visual appeal to a presentation. The layout creates a natural flow, leading the audience through the analysis from the tail fins to the head, making it a practical yet aesthetically engaging tool.
PowerPoint Triangles Fishbone Diagram Template
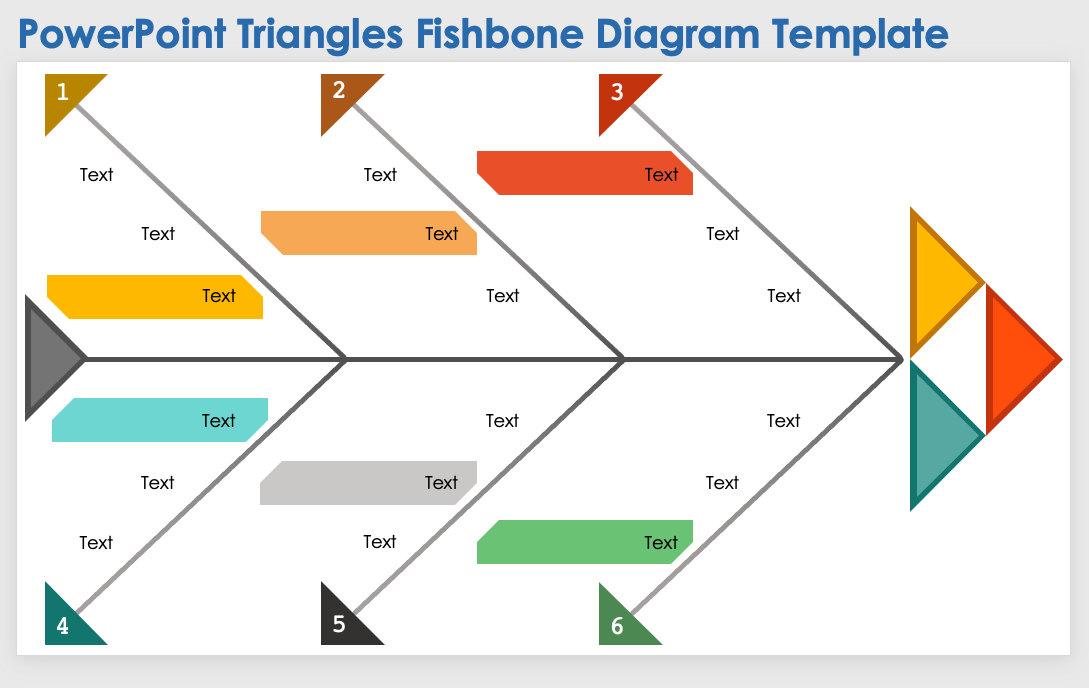
Download the Triangles Fishbone Diagram Template for PowerPoint
When to Use This Template: This fishbone chart is ideal for project management, strategic planning, and process improvement. Use this template to present a cause-and-effect analysis in settings such as stakeholder meetings or team debriefs.
Notable Template Features: This diagram incorporates triangles to differentiate between levels of hierarchy within root causes. This geometric approach adds an aesthetic dimension and assists the audience in following the flow of information from minor to major causes.
PowerPoint 6-Prong Fishbone Diagram Template

Download the 6-Prong Fishbone Diagram Template for PowerPoint
When to Use This Template: This fishbone template aids in presenting complex data in an easily digestible format. You can break down a central problem into six categories or causes, summarize important details, and engage your audience in a structured problem-solving dialogue.
Notable Template Features: A clean, spacious design ensures that each block of text is readable and distinct. The six-section format allows for an organized and detailed content presentation. Each section provides space for elaborating on individual causes or categories with a clear linkage to the main issue.
Explore our 6 Prong Fishbone Diagram Template in PowerPoint and Google Slides formats.
PowerPoint 4-Prong Fishbone Diagram Template
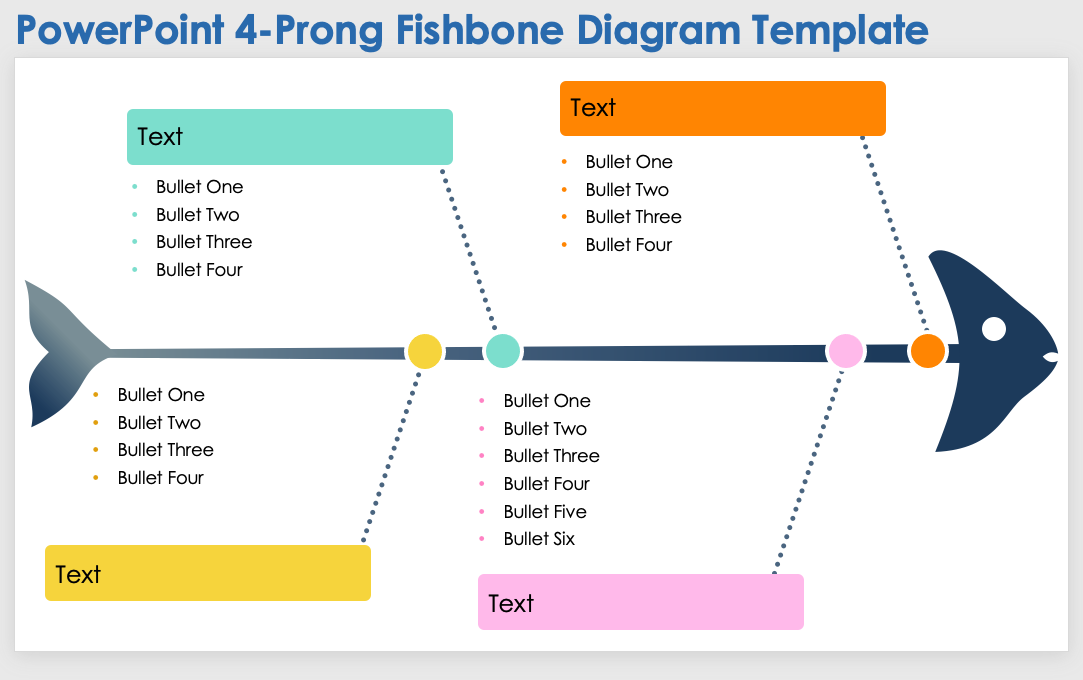
Download the 4-Prong Fishbone Diagram Template for PowerPoint
When to Use This Template: This template is ideal for planning sessions and business development meetings where a clear outline of key strategies is crucial. Executives and managers can communicate various strategic components to their teams, encouraging continuous quality improvement by focusing on actionable insights.
Notable Template Features: The streamlined, four-pronged approach to strategy analysis helps highlight key information while ensuring that the content is succinct. Brief descriptions allow presenters to convey a concise yet comprehensive overview of each strategic element. This clarity facilitates productive discussions on how different factors can influence the overall success of business initiatives.
Follow this guide to continuous quality improvement to get the most out of your fishbone diagram templates.
PowerPoint Full-Color Fishbone Diagram Template
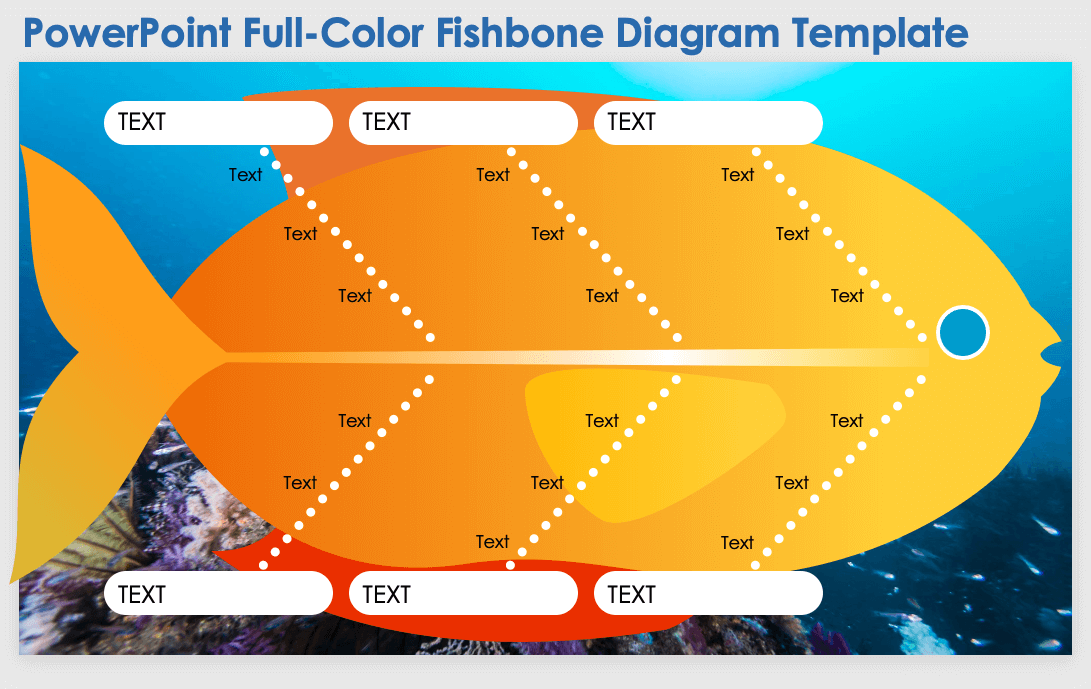
Download the Full-Color Fishbone Diagram Template for PowerPoint
When to Use This Template: This template is especially suited for presentations in environments that value creativity, such as marketing, education, or design settings. The template combines a root cause fishbone diagram with a visually engaging design, facilitating analysis and a dynamic presentation.
Notable Template Features: The vivid color palette ensures that each section is easily identifiable, which can help maintain the audience's attention and improve their ability to follow along with the analysis. The fish shape creatively embodies the fishbone concept, making it an inviting and memorable framework for problem-solving discussions.
PowerPoint Timeline Fishbone Diagram Template
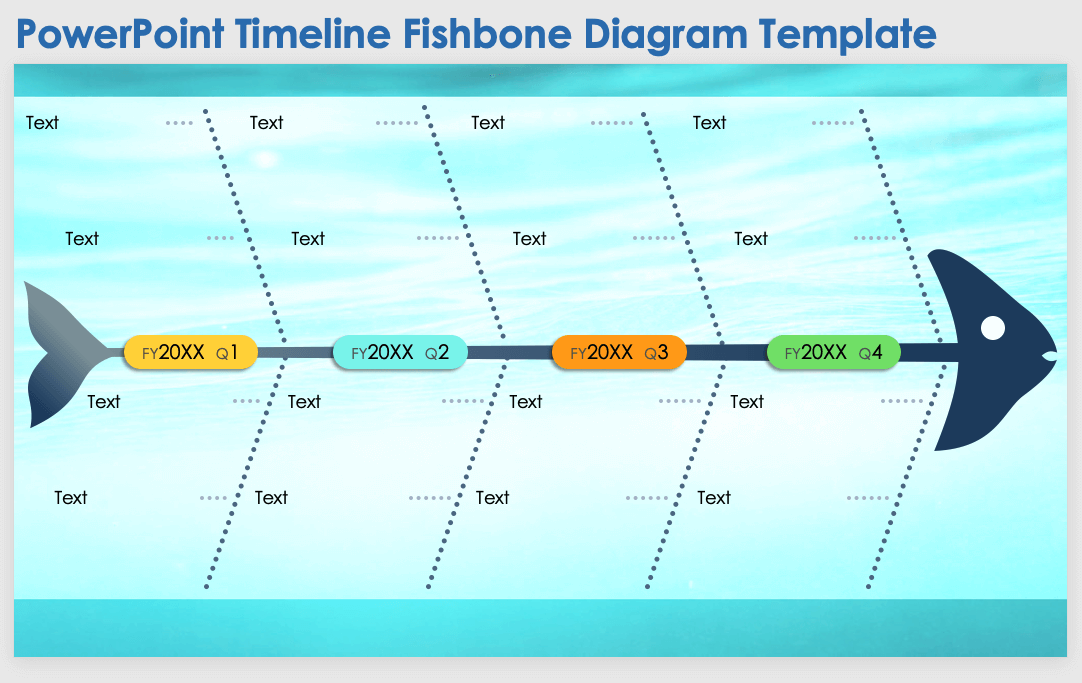
Download the Timeline Fishbone Diagram Template for PowerPoint
When to Use This Template: Use this timeline fishbone diagram to depict the chronological progression of projects or events. Marketing teams, for example, might use this template to trace the development of campaigns over several years. Project managers can highlight key milestones and deadlines within a project's lifecycle. The timeline can also be used for problem analysis, such as mapping out causal factors across various time points.
Notable Template Features: This template offers a color-coded system for quick year-over-year comparison. The branching points provide space for detailed annotations of significant events or stages. Additionally, the design can accommodate a range of data points without compromising readability.
PowerPoint Circles Fishbone Diagram Template
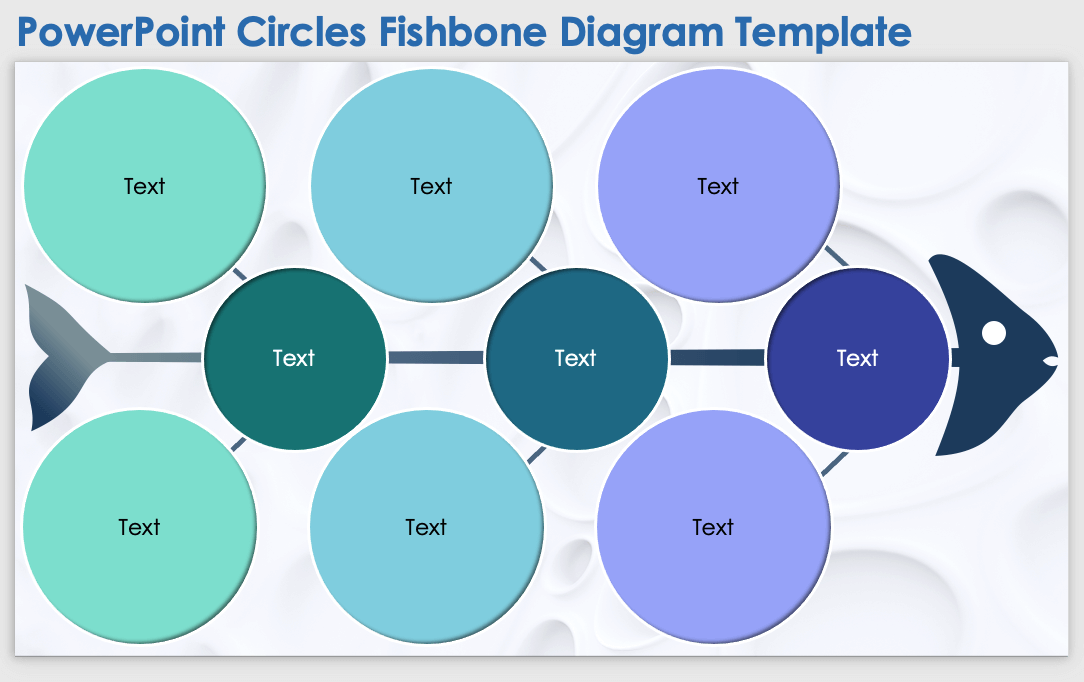
Download the Circles Fishbone Diagram Template for PowerPoint
When to Use This Template: This fishbone template is perfect for interactive sessions and presentations aimed at pinpointing and discussing the root causes of business challenges. Use it in workshops aimed at improving business operations or to help teams collaboratively map out the various factors contributing to a particular issue during project planning or review.
Notable Template Features: This template replaces the traditional linear bones of a fishbone diagram with interconnected circles, streamlining complex data into an accessible visual format. The circles act as focal points that draw attention to key information. Each circle allows for the concise summary of an idea, creating a clean and organized visual representation of potential causes
PowerPoint Simple Fishbone Diagram Template
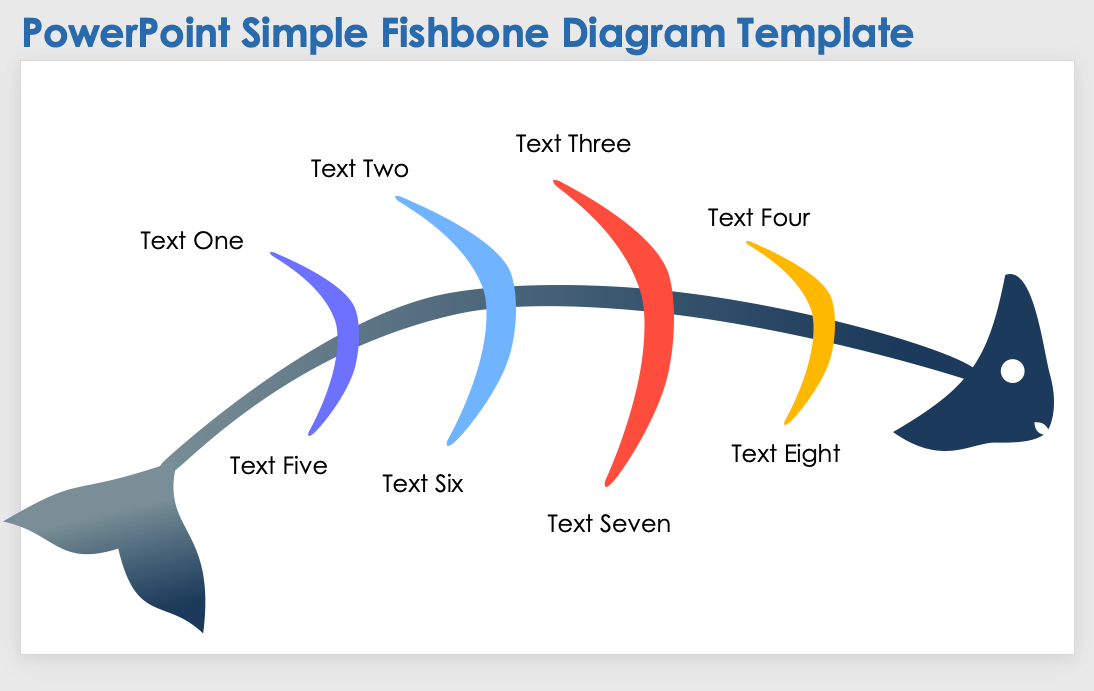
Download the Simple Fishbone Diagram Template for PowerPoint
When to Use This Template: Choose this fishbone design when you want to deliver a clear and impactful presentation of the causes of an issue. Using minimal text, highlight the factors contributing to business or educational scenarios, performance obstacles, or operational inefficiencies.
Notable Template Features: This diagram is streamlined to facilitate a clear, focused delivery, allowing presenters to emphasize key points. Each segment of the fishbone naturally draws the eye and directs attention to the written content. This enables viewers to quickly grasp important information and the relationship between different elements.
For more related tools available in additional formats, see this collection of fishbone diagram templates. These free guides to project management charts and gap analysis can also help you develop better problem-solving strategies.
Elevate Your Presentations with Real-Time Work Management in Smartsheet
Empower your people to go above and beyond with a flexible platform designed to match the needs of your team — and adapt as those needs change.
The Smartsheet platform makes it easy to plan, capture, manage, and report on work from anywhere, helping your team be more effective and get more done. Report on key metrics and get real-time visibility into work as it happens with roll-up reports, dashboards, and automated workflows built to keep your team connected and informed.
When teams have clarity into the work getting done, there’s no telling how much more they can accomplish in the same amount of time. Try Smartsheet for free, today.

