Microsoft Word Root Cause Fishbone Diagram Template
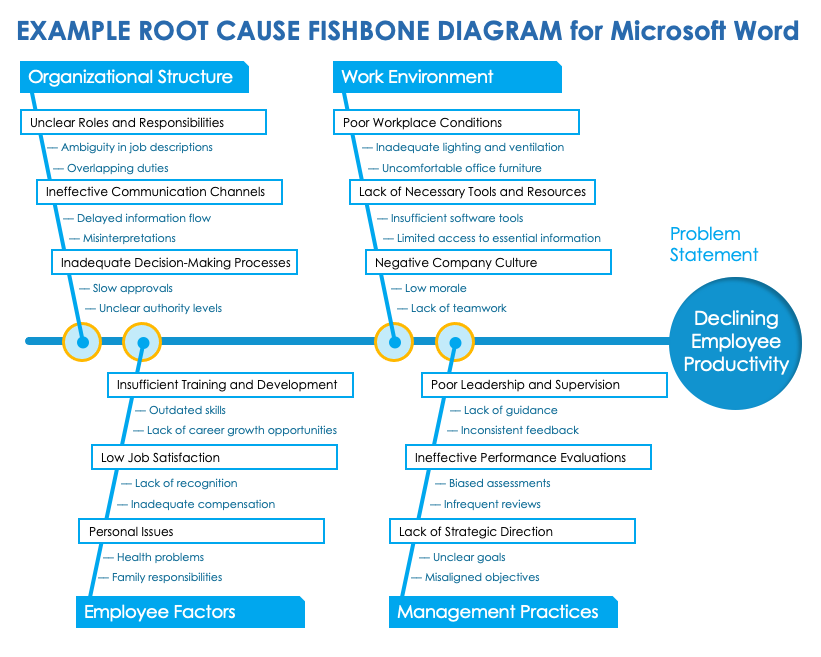
Download the Blank Root Cause Fishbone Diagram Template for Microsoft Word
Download the Example Root Cause Fishbone Diagram Template for Microsoft Word
When to Use This Template: Project managers, quality assurance teams, and business analysts can use this root cause analysis fishbone diagram template to dissect a problem comprehensively and identify its root causes, rather than addressing only the symptoms. This template is an effective tool for brainstorming sessions following an incident or when a project faces unanticipated challenges that require deep analysis.
Notable Template Features: This fishbone chart has four bones for categorizing potential causes of a problem into manageable segments. You can add primary and secondary causes to each bone for a thorough examination of contributing factors. The diagram also facilitates easy visualization and organization of data, which enhances team collaboration and streamlines the problem-solving process. The blank version of this template is empty, while the example template shows a sample analysis of declining employee productivity.
For additional templates available in more formats, see this collection of fishbone templates.
Microsoft Word Medical Fishbone Diagram Template

Download the Blank Medical Fishbone Diagram Template for Microsoft Word
Download the Example Medical Fishbone Diagram Template for Microsoft Word
When to Use This Template: Healthcare professionals — including hospital administrators, quality improvement teams, and clinical staff — can utilize this medical fishbone diagram to conduct a detailed analysis of medical errors or systemic healthcare issues. This template is particularly useful in post-incident reviews and quality improvement meetings, as well as when a team aims to proactively identify and mitigate potential risks.
Notable Template Features: This template divides potential causes into six areas: policies and procedures, technology, patients, staff, equipment, and environmental factors. You can edit the categories to suit a specific setting or type of problem. For example, you might choose to focus on documentation, training, providers, culture, or other elements related to patient care and operational efficiency. The diagram promotes a holistic understanding of how various factors connect within the healthcare ecosystem, and it can support a culture of continuous quality improvement. Download the blank template to enter your own information. For more guidance, download the version with example data.
For more resources and tips, check out this guide to continuous quality improvement.
Microsoft Word Marketing Fishbone Diagram Template
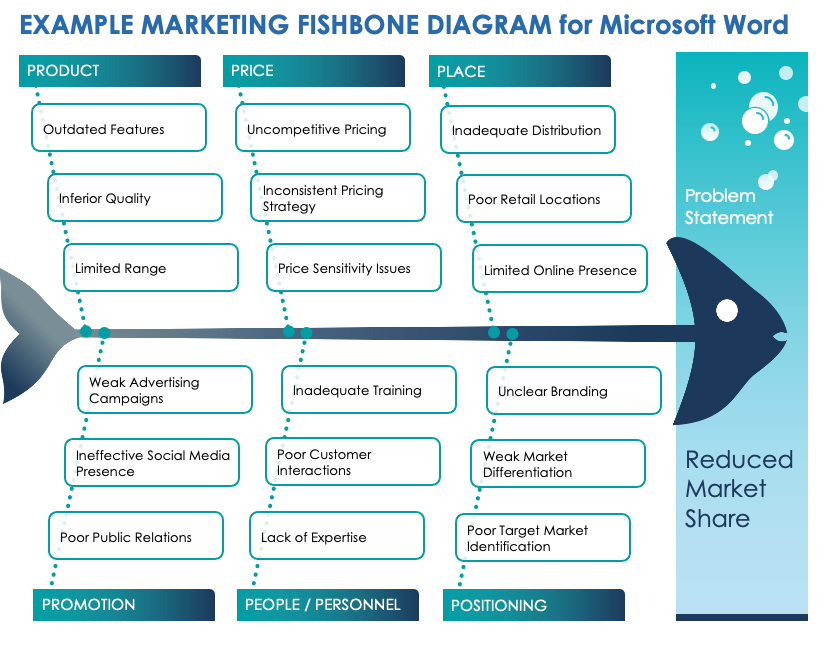
Download the Blank Marketing Fishbone Diagram Template for Microsoft Word
Download the Example Marketing Fishbone Diagram Template for Microsoft Word
When to Use This Template: Marketing teams can use this fishbone chart template to understand the underlying factors affecting their campaigns, aiding them in crafting strategies that enhance engagement and drive sales. This tool is especially beneficial for post-campaign analysis and strategic planning, as well as when a product fails to meet market expectations.
Notable Template Features: This template offers six categories for marketing analysis: product, price, place, promotion, people/personnel, and positioning. By providing a structured framework for brainstorming and analysis, the template facilitates a deep dive into each aspect of the marketing mix, encouraging a comprehensive and nuanced understanding of how various elements interact to influence the success or failure of marketing initiatives. Download the blank version and enter your own data to reflect the marketing challenge you are evaluating, or try the example version for additional guidance.
Learn more about managing organizational problems in this guide to performing a gap analysis.
Microsoft Word Manufacturing Fishbone Diagram Template
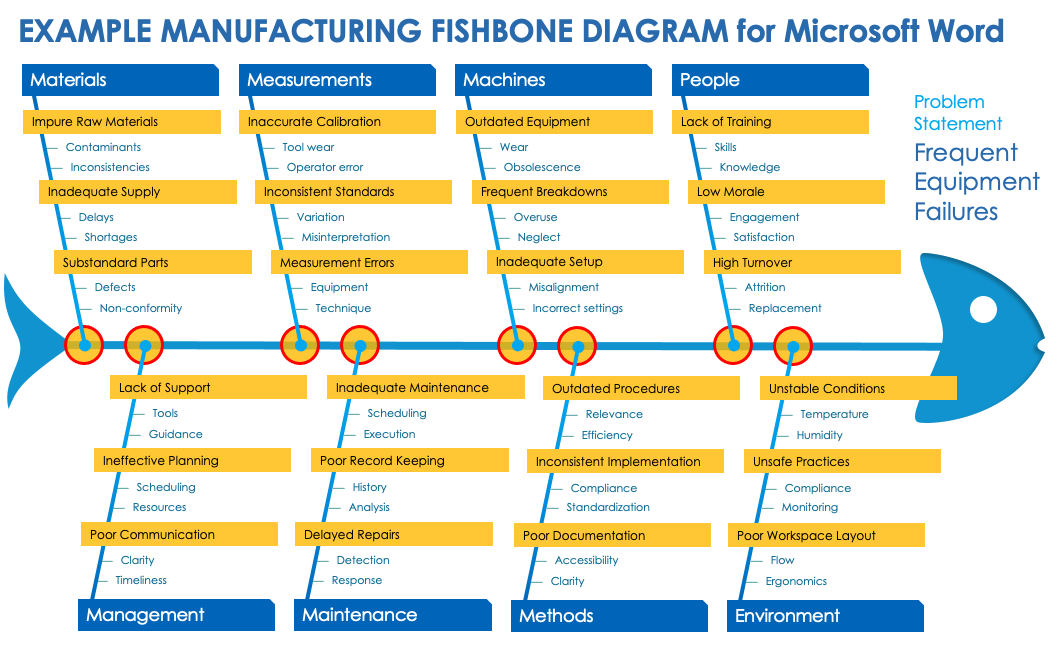
Download the Blank Manufacturing Fishbone Diagram Template for Microsoft Word
Download the Example Manufacturing Fishbone Diagram Template for Microsoft Word
When to Use This Template: Use this manufacturing fishbone template to enhance production efficiency, tackle quality issues, or streamline operations. Manufacturing managers, process engineers, and quality control teams can systematically examine manufacturing challenges and implement targeted improvements that enhance productivity and product quality.
Notable Template Features: This template offers a traditional Ishikawa diagram layout and categorizes potential manufacturing issues into eight areas: materials, measurements, machines, people, management, maintenance, methods, and environment. Each category is designed for a detailed investigation, enabling teams to pinpoint the root causes of manufacturing problems. This template is available blank or with sample data for users who want inspiration from provided examples.
Microsoft Word Fishbone Timeline Template
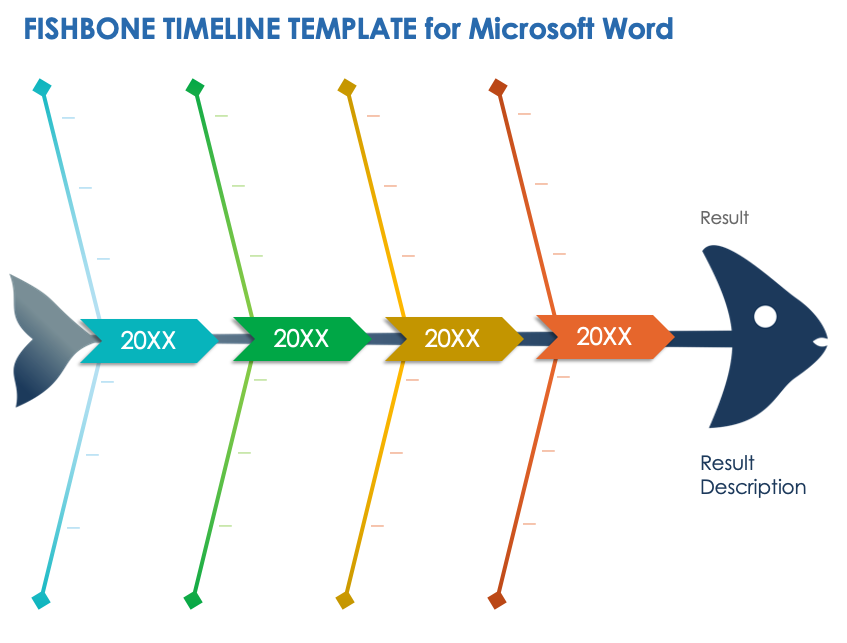
Download the Fishbone Timeline Template for Microsoft Word
When to Use This Template: This timeline fishbone allows you to analyze the causes of a problem over time. Utilize the template for review meetings and strategic planning sessions, as well as when investigating the root causes of a project delay. If you're tackling persistent challenges that have evolved over a period, this template can help you pinpoint where plans went off track.
Notable Template Features: This template stands out for its chronological approach, allowing you to trace the origins of specific problems back to specific points in time. The template's ability to link cause-and-effect relationships across different project stages makes it a powerful tool for in-depth analysis and future planning.
Use this template on its own or with one of these project management charts.
Related Cause-and-Effect Templates
Fishbone diagram templates provide a visual map of problem causes, allowing you to break down complex challenges and uncover the roots of an issue. For related problem-solving tools that examine cause-and-effect relationships, try one of the templates below.
Root Cause Analysis Template
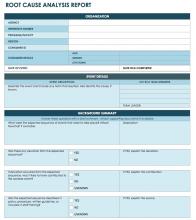
This root cause analysis report template is a comprehensive tool for investigating adverse events within an organization. The template guides users through documenting event details, analyzing deviations from expected procedures, assessing contributing factors, and identifying root causes. It also focuses on risk reduction and prevention strategies, ensuring that teams not only understand the underlying issues but also take steps to prevent future occurrences.
5 Whys Template

By repeatedly asking "why," our 5 Whys template helps teams drill down into the details of a problem, peeling away the symptom layers to reach the root cause. The template also includes sections for outlining corrective actions and assigning responsibility and timelines to help ensure that solutions are implemented.
Tree Diagram Template
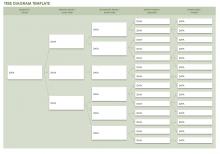
A tree diagram template offers a different format for visually mapping out and analyzing the causes of a problem. After identifying a primary issue or objective, branch out to identify primary and secondary factors that contribute to the main issue. This systematic approach enables teams to focus on each aspect of the problem, ensuring a thorough and structured analysis.
DMAIC Methodology Template

The DMAIC methodology template guides you through the process of defining, measuring, analyzing, improving, and controlling a problem. This includes detailing the incident, conducting root cause analysis, and documenting steps for solutions and prevention. By following this methodology, teams can systematically address problems and enhance processes and outcomes.
For more problem-solving tools, see this full selection of root cause analysis templates and get expert advice in this article on problem-solving techniques.
Get to the Root of Your Organization’s Issues with Real-Time Work Management in Smartsheet
Empower your people to go above and beyond with a flexible platform designed to match the needs of your team — and adapt as those needs change.
The Smartsheet platform makes it easy to plan, capture, manage, and report on work from anywhere, helping your team be more effective and get more done. Report on key metrics and get real-time visibility into work as it happens with roll-up reports, dashboards, and automated workflows built to keep your team connected and informed.
When teams have clarity into the work getting done, there’s no telling how much more they can accomplish in the same amount of time. Try Smartsheet for free, today.
