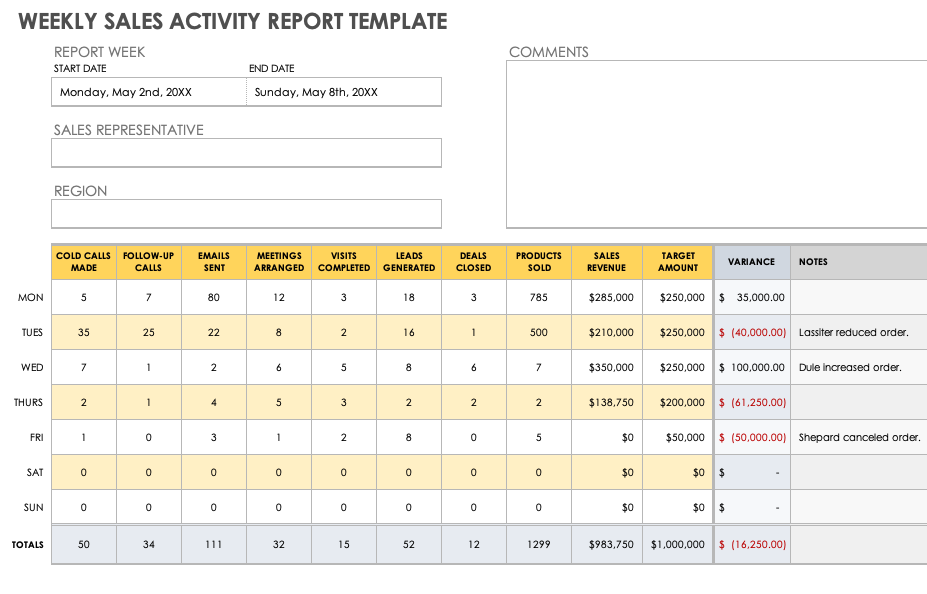
Weekly Sales Activity Report Template for Excel
Download the Weekly Sales Activity Report Template for Excel
This template is ideal for individual sales representatives who need to track weekly sales activity. For each weekday, enter the number of calls made, visits completed, sales leads generated, and deals closed. Include daily revenue goals and actual amount collected. The template calculates daily and weekly totals for all activities and revenue. It also shows the variance between your target sales revenue and actual amounts.
Streamline Data Collection with Smartsheet Forms
Turn collected data into actionable insights instantly
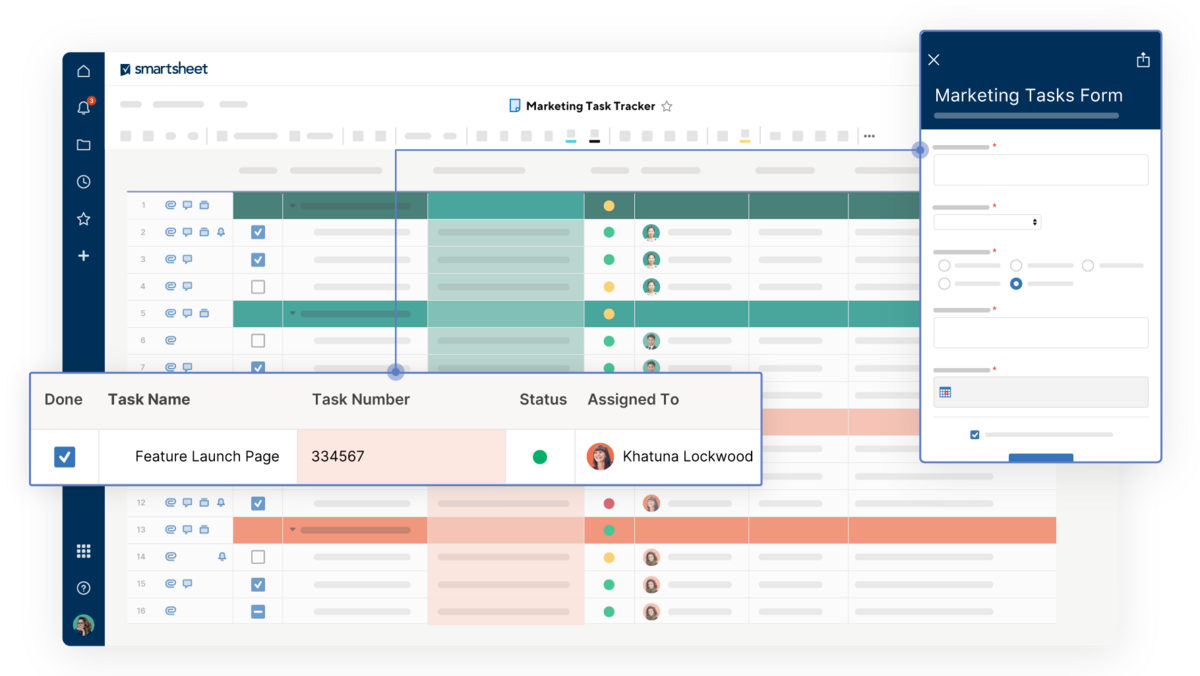
Smartsheet forms capture consistent, accurate data and feed it directly into an organized sheet, giving you instant visibility. With customizable branding, conditional logic, and mobile accessibility, Smartsheet forms not only simplify data gathering but also allow your team to take action right away—whether you're tracking requests, collecting information, or managing fieldwork.
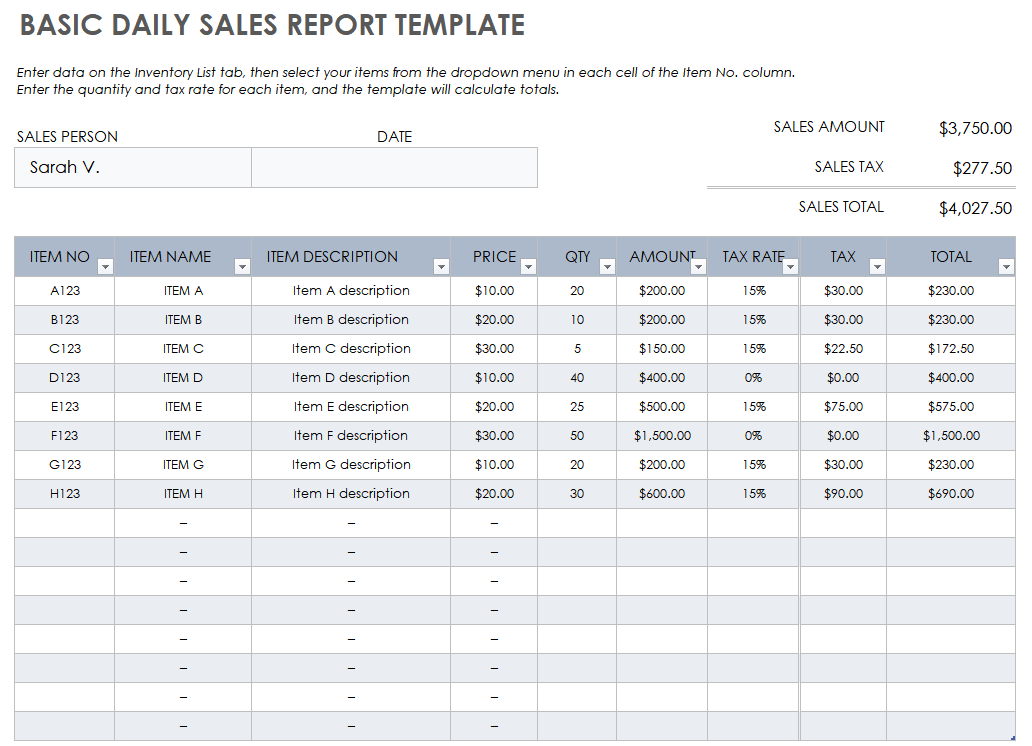
Basic Daily Sales Report Template for Excel
Download the Basic Daily Sales Report Template for Excel
Use this simple spreadsheet template for daily sales reporting. List products, prices, and item descriptions in the inventory list tab. In the main template tab, use the dropdown menu in each row of the first column (labeled Item No.) to select a product. Enter the quantity sold and tax rate for each item. The template calculates the total sales amount including tax. You’ll be able to see the daily sales total at the top of the template for easy reference.
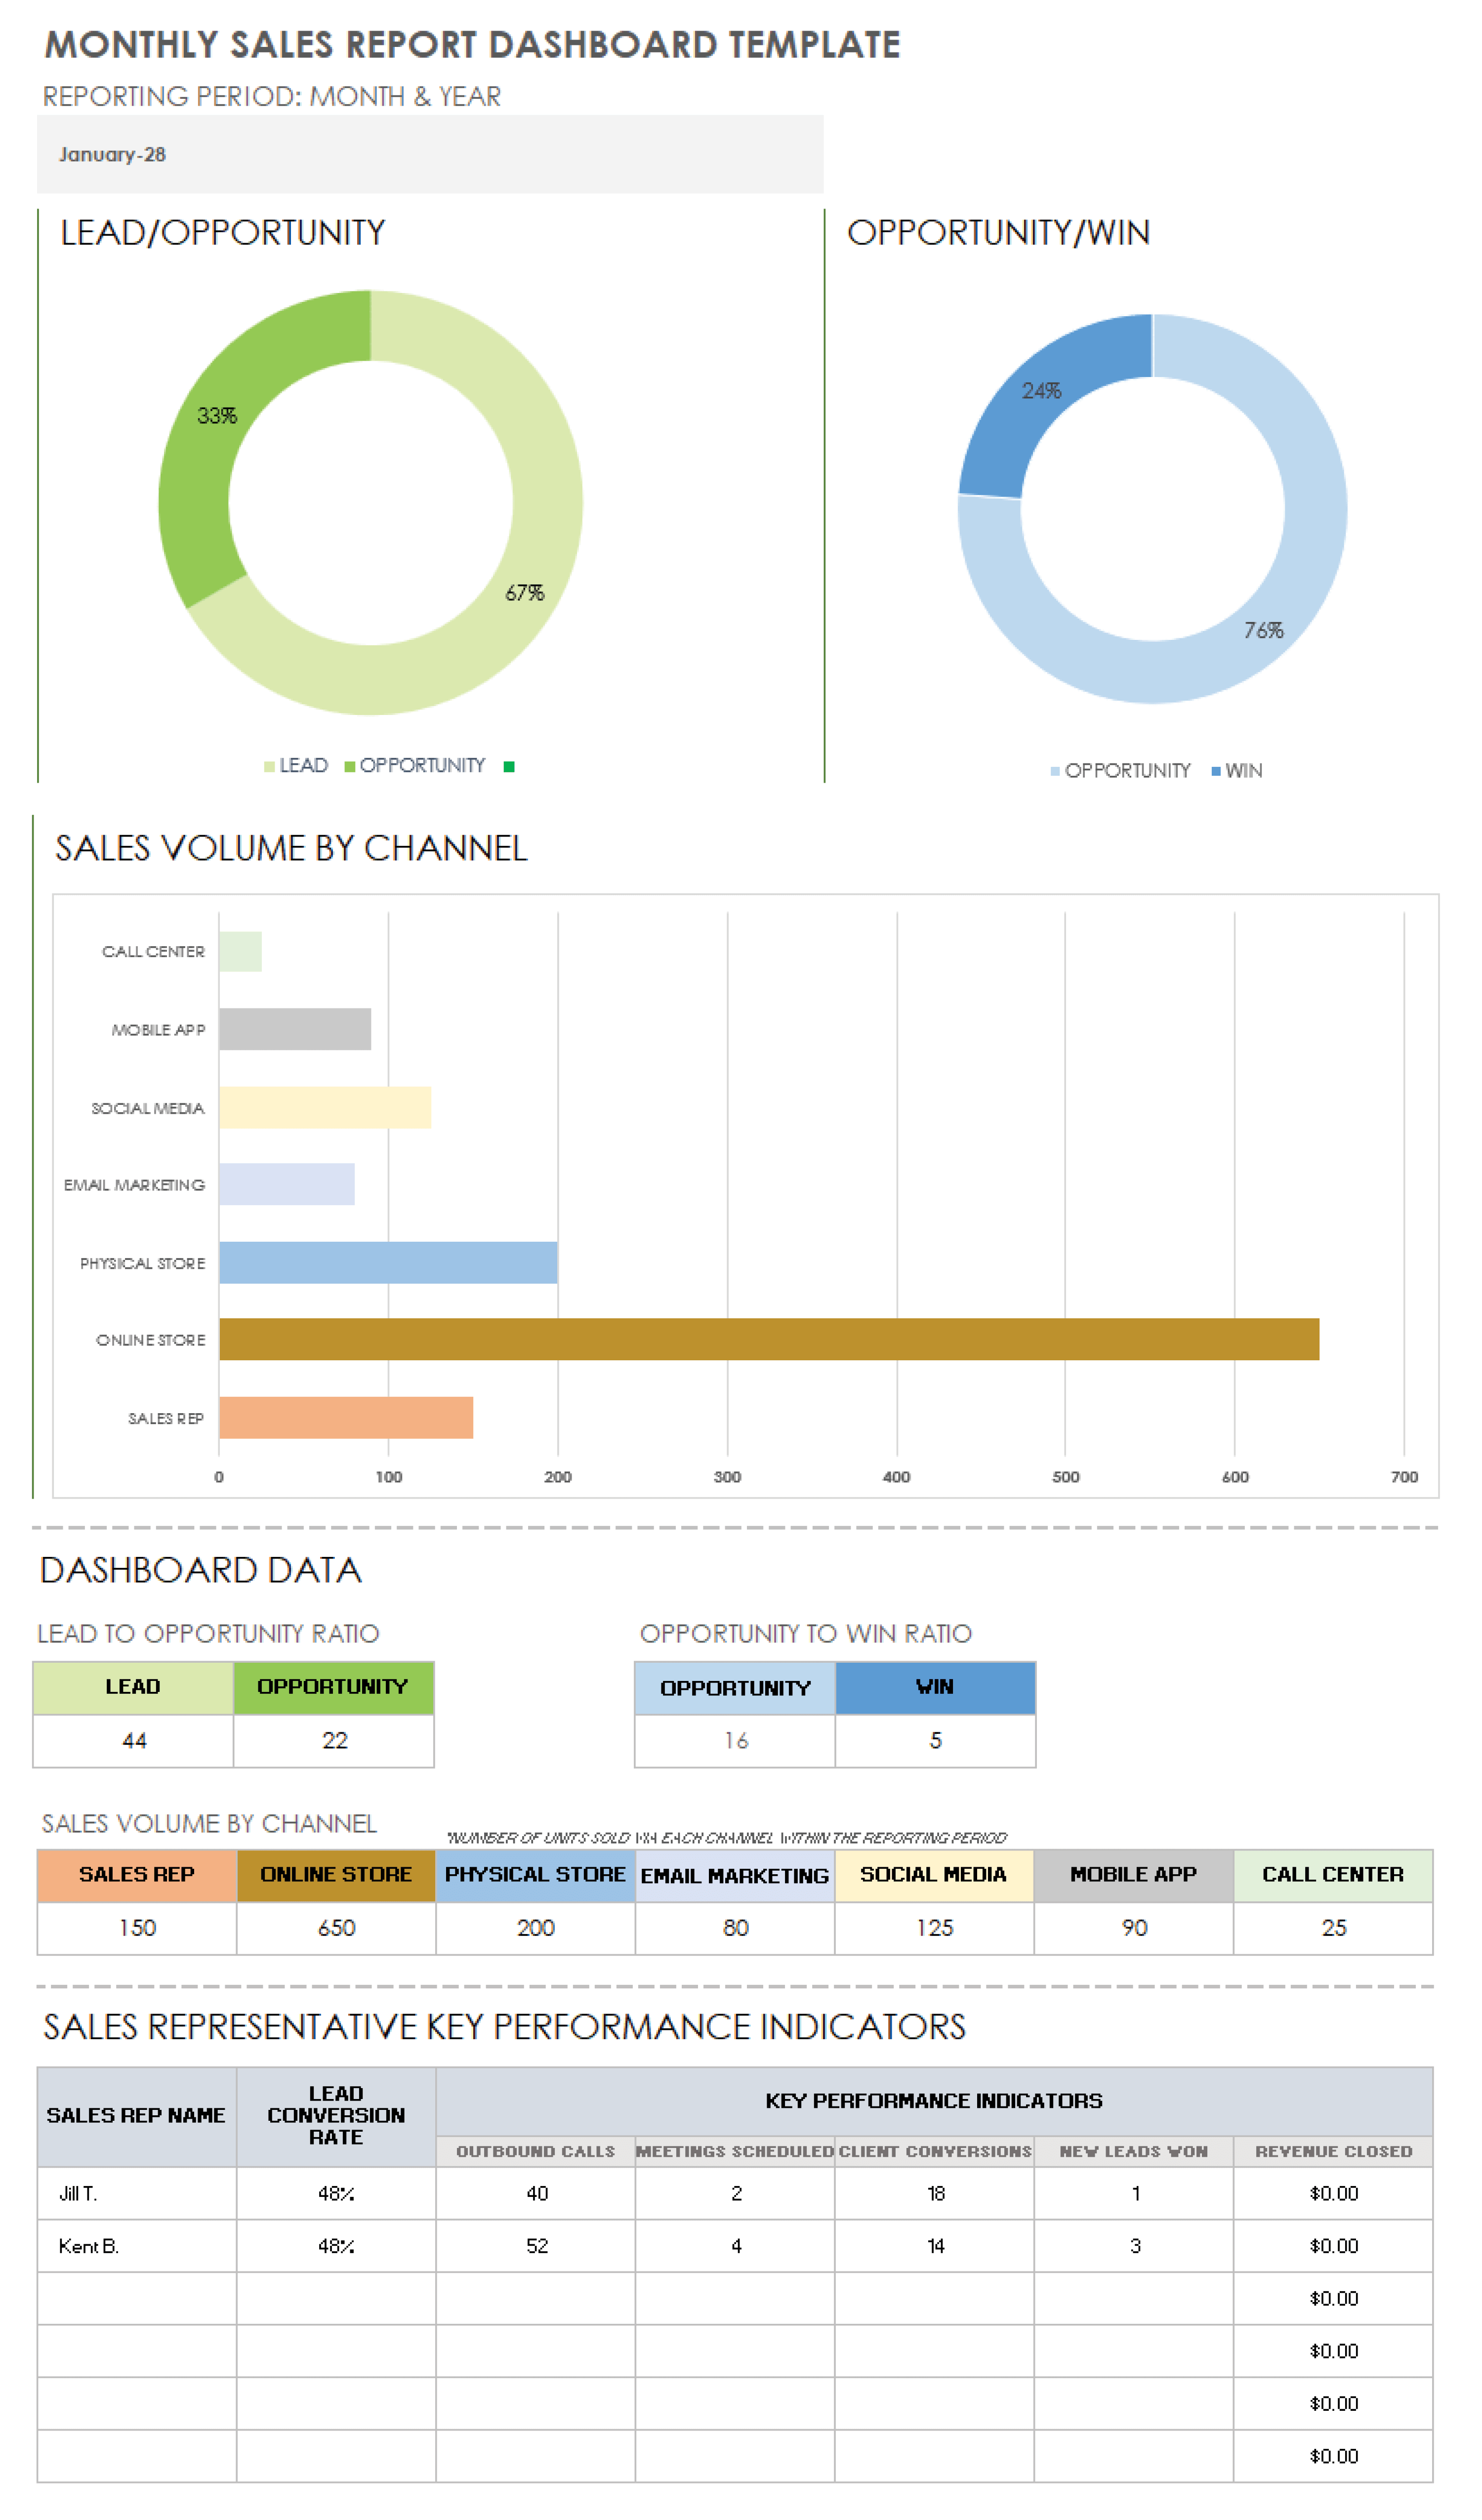
Monthly Sales Report Dashboard Template for Excel
Download the Monthly Sales Report Dashboard Template for Excel
Create a monthly sales report showing team performance, including the lead conversion rate, outbound calls, and revenue closed for each sales rep. The dashboard provides charts to quickly view your lead-to-opportunity ratio, opportunity-to-win ratio, and sales volume by channel. You’ll find example sales channels for a call center, mobile app, social media, email marketing, and online store. Edit the categories and add your data to see which channels are the top performers for your business.
Annual Sales Performance Report Template for Excel
Download the Annual Sales Performance Report Template for Excel
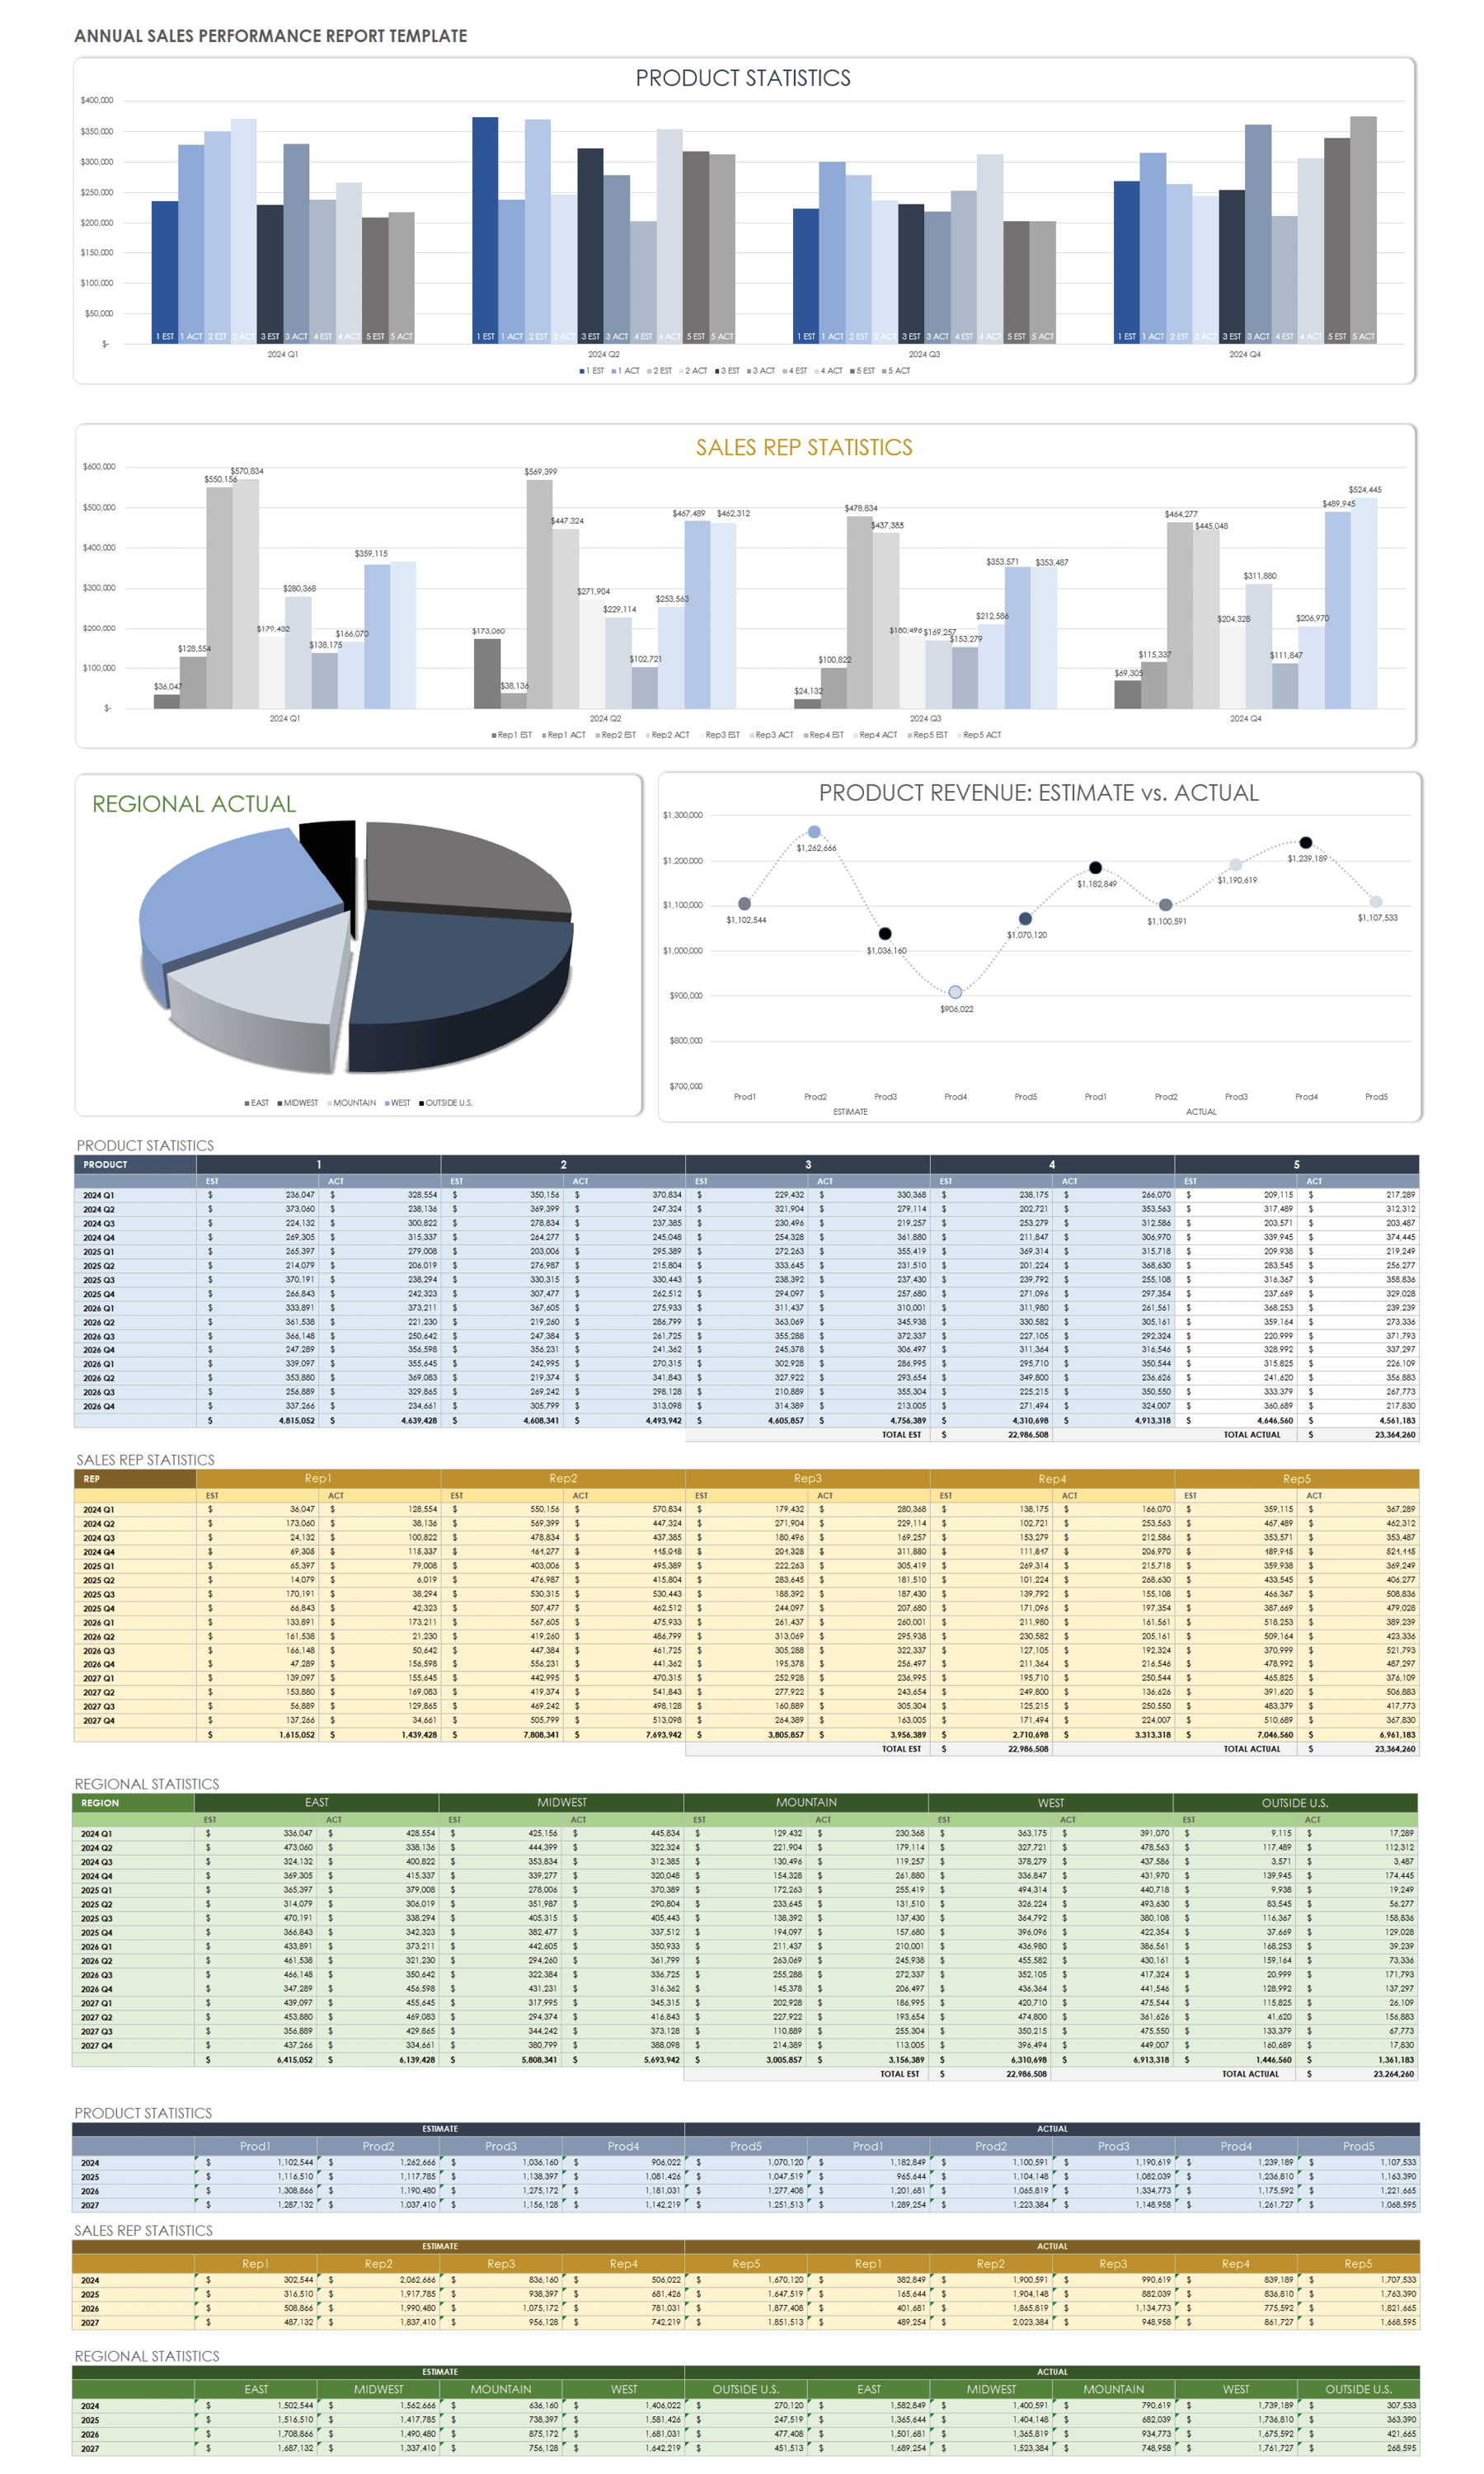
Use this sales analysis report template to track quarterly sales growth for multiple products, regions, and salespeople. The template shows side-by-side estimated versus actual sales for each quarter. Enter your product names and sales amounts to populate the color-coded bar charts. The report also includes a graph comparing product revenue over four years.
Weekly Sales Call Report Template
Download a Weekly Sales Call Report Template for
Excel
|
Microsoft Word
|
Adobe PDF
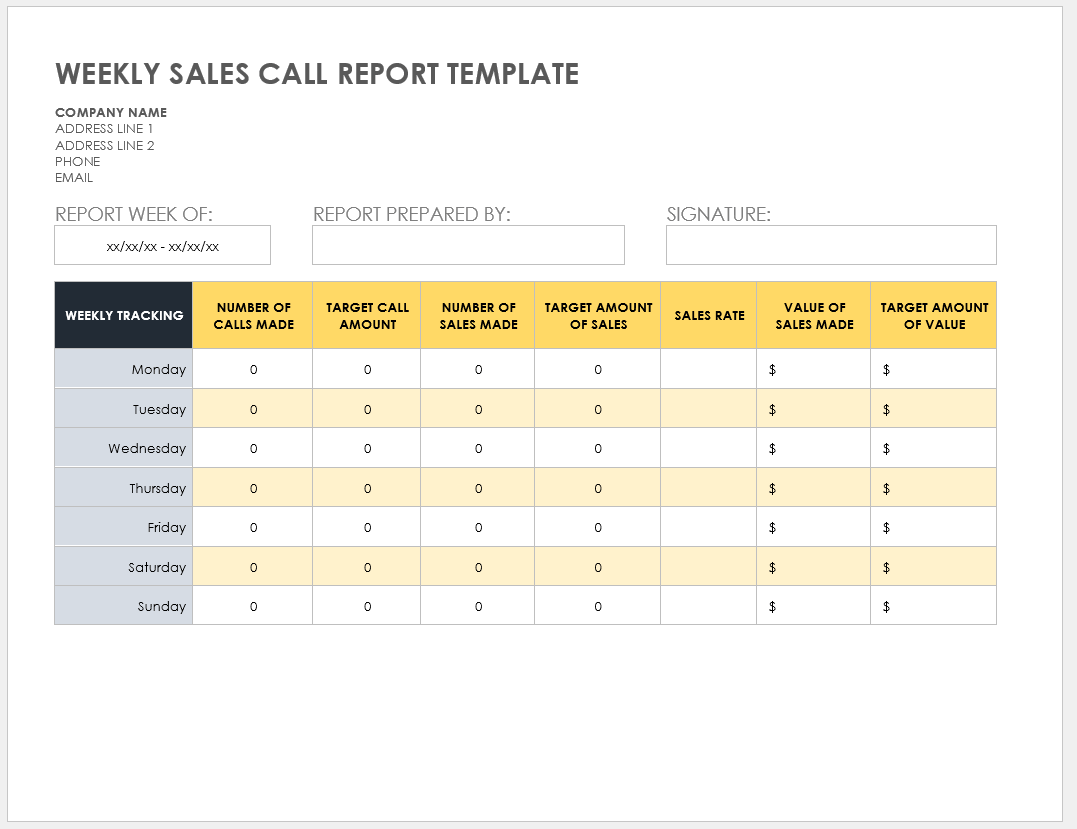
Record sales call activity to create a simple weekly report. Use this template to track data from one sales rep or a team. Enter the daily number of calls and sales made, along with target amounts. The Microsoft Excel version of this template calculates the sales rate for each day of the week. Enter your sales values to see how daily and weekly revenue compare to sales goals.
Daily Sales KPI Report Template for Excel
Download the Daily Sales KPI Report Template for Excel
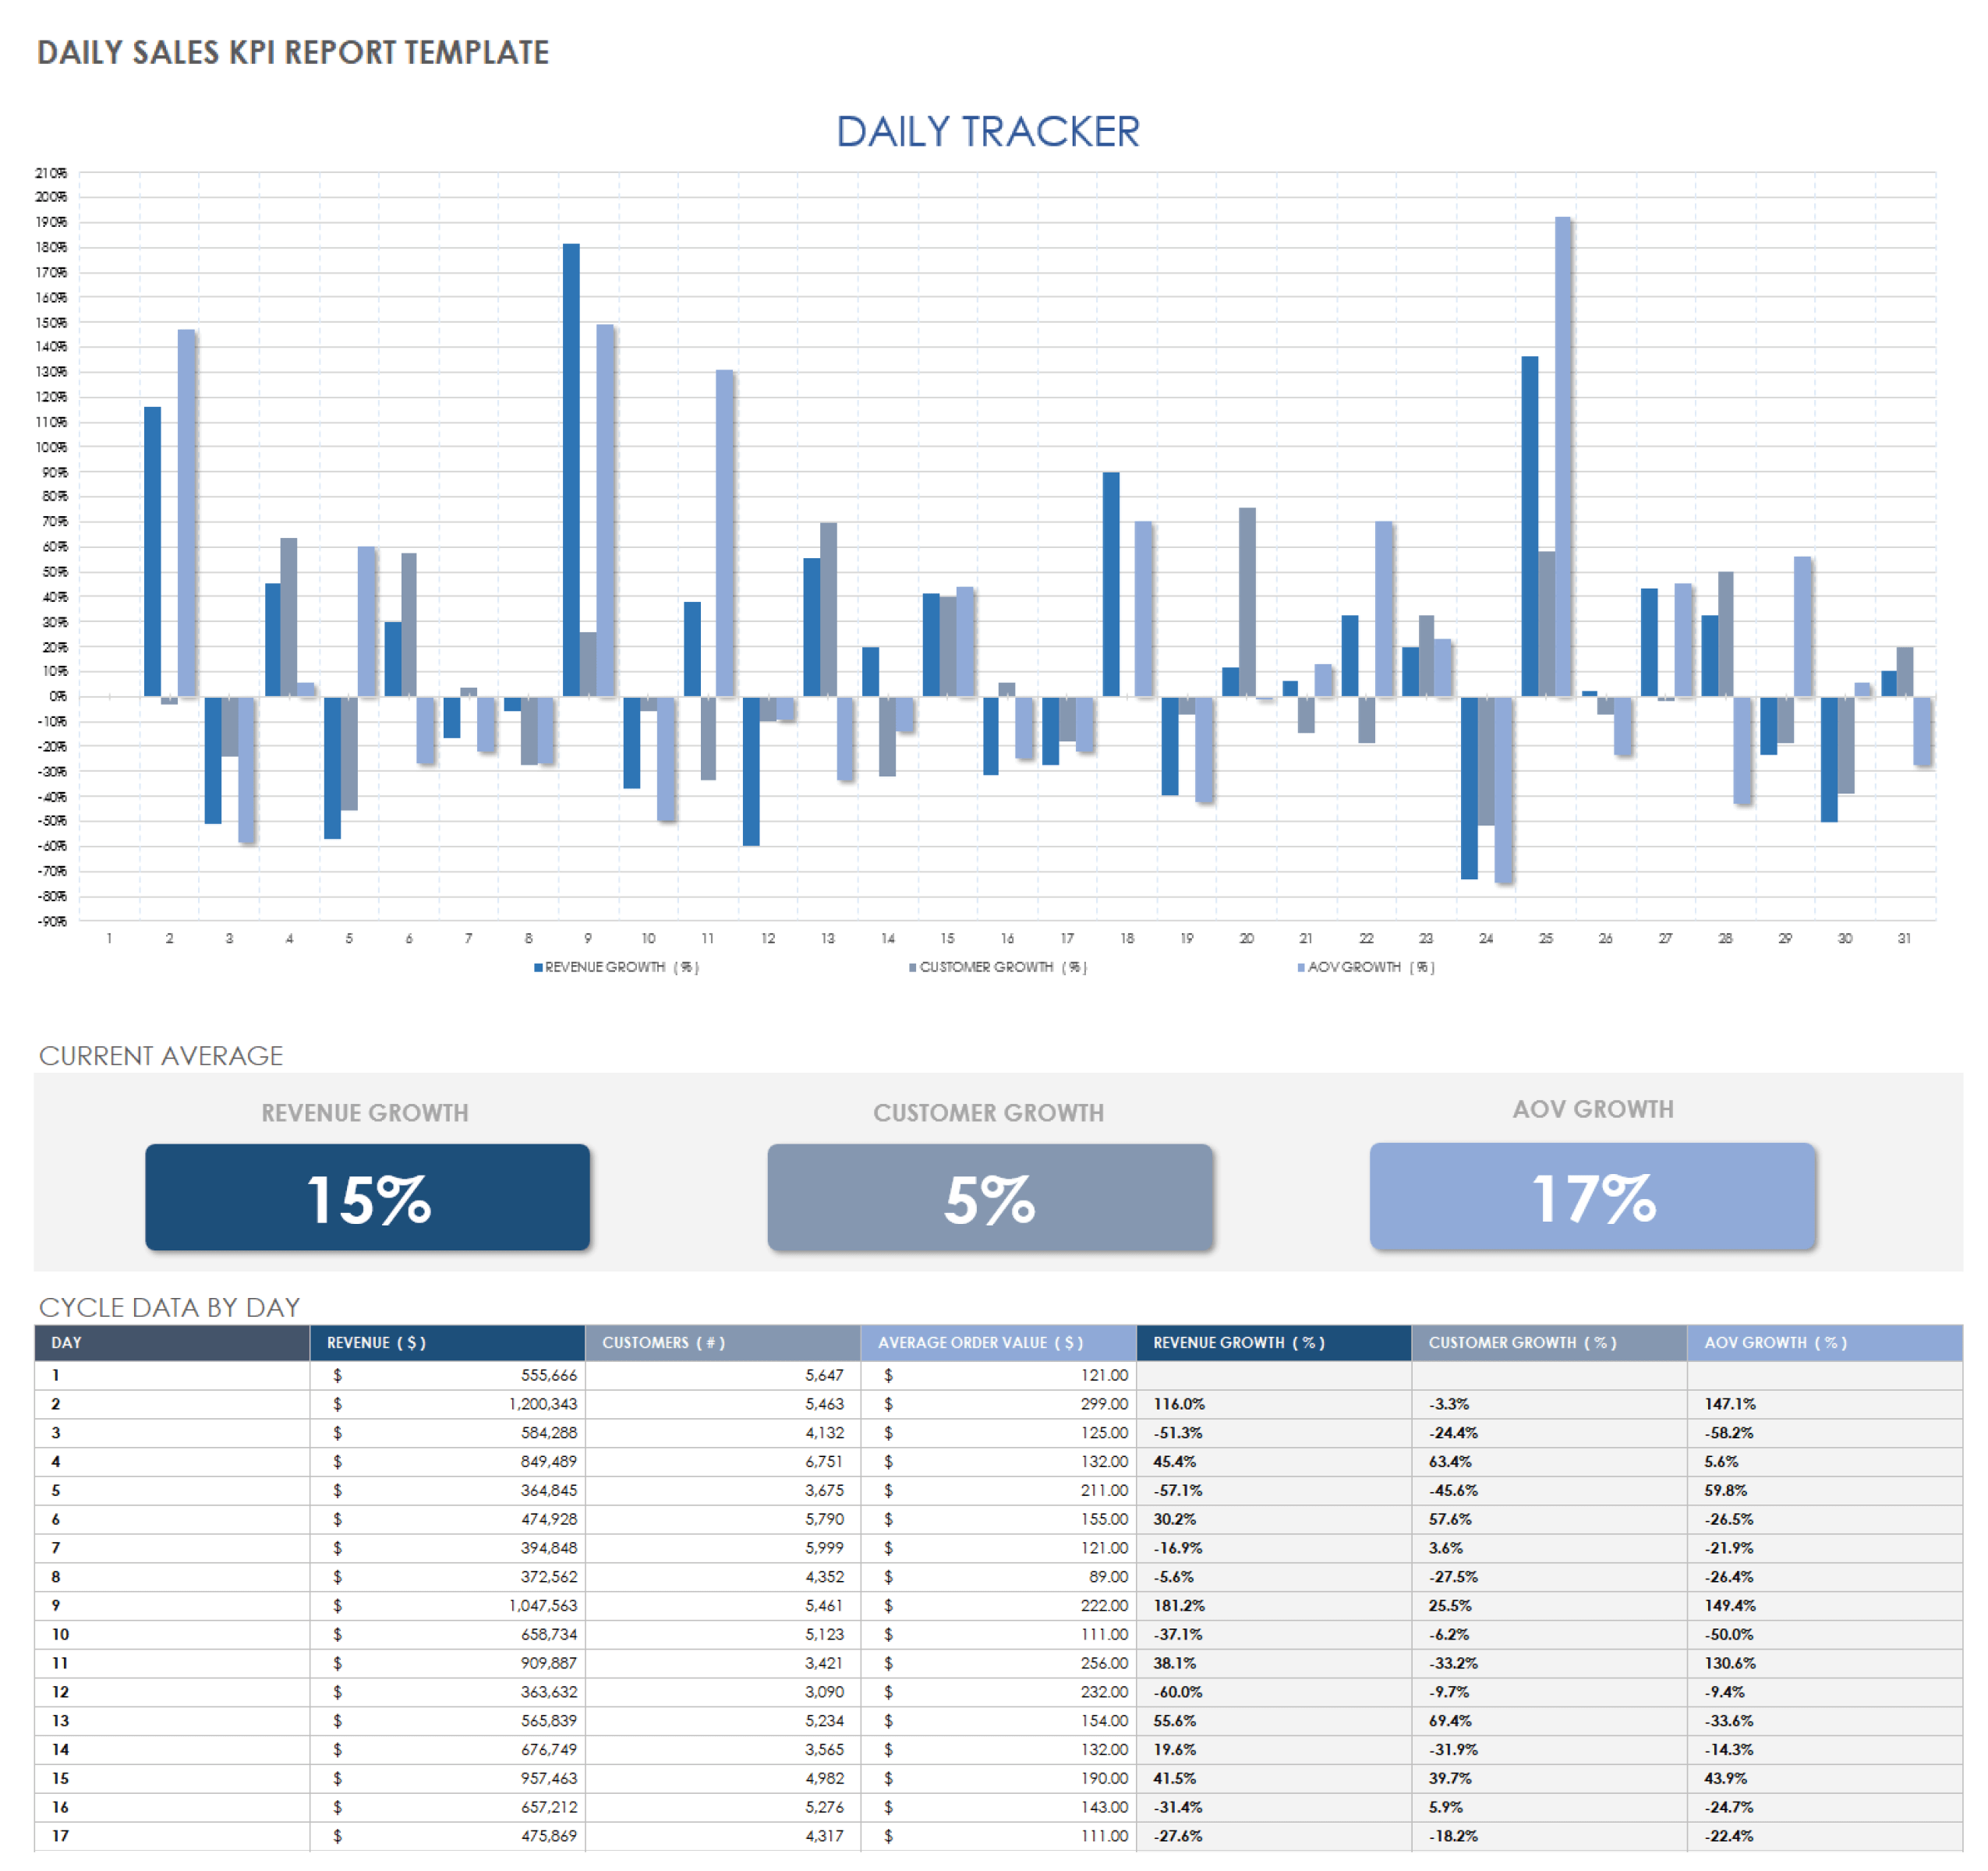
This sales report template displays daily key performance indicators (KPIs) for one month. View revenue, customer, and average order value growth in a bar chart, so you can track performance. KPIs are shown together on each day, allowing you to evaluate changes on a daily and monthly basis. Enter your data in the unshaded portions of the spreadsheet to generate the dashboard chart, as well as monthly average values for each KPI.
Deal Loss Reasons Report Template for Excel
Download the Deal Loss Reasons Report Template for Excel
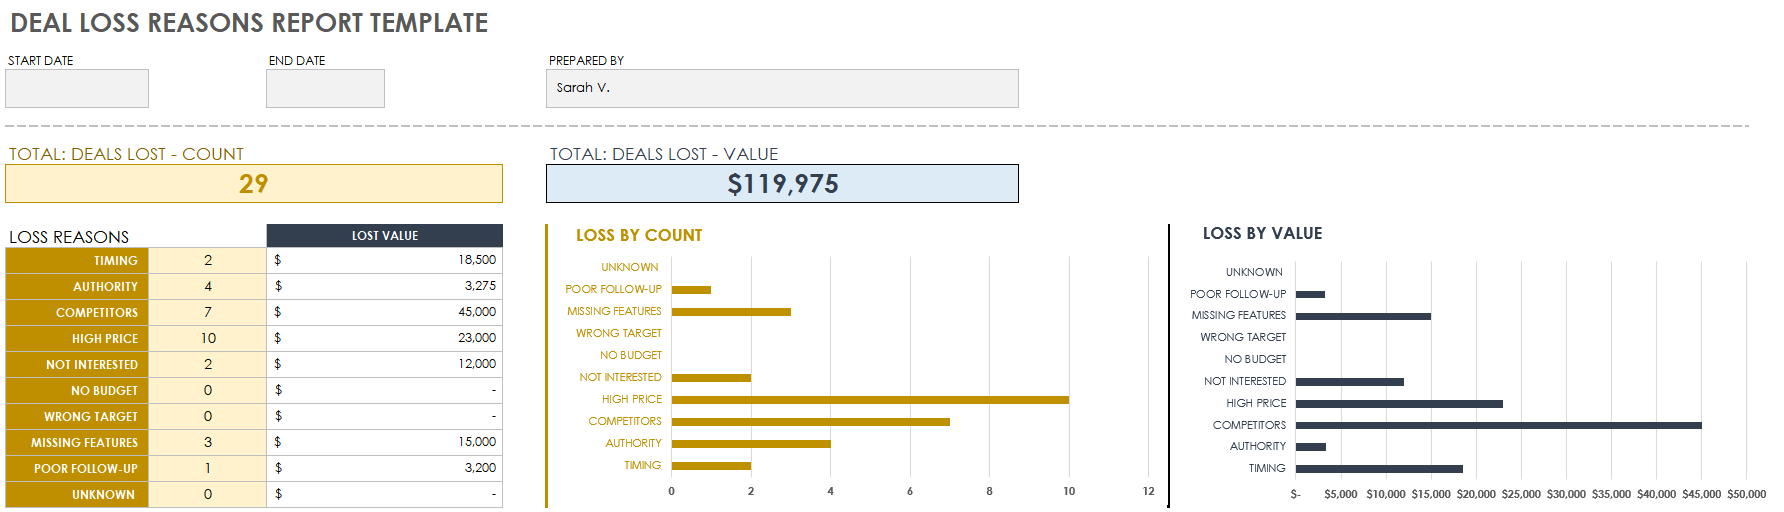
Identifying the reasons you are losing deals will help you find trends and make informed changes to a sales strategy. This template includes two charts: one showing loss reasons by value and the other by count. The total number of lost deals and total lost earnings are shown at the top of the report. Enter the starting and ending dates for the reporting period, edit the loss reasons, and add sales data to reveal a snapshot of deals lost.
Sales Tracking Report Template for Excel
Download the Sales Tracking Report Template for Excel
This sales tracking report provides a detailed breakdown, as well as a broad overview of financial data. Use the spreadsheet portion of the template to list the cost per item, markup percentage, quantities sold, shipping costs, and returns. The dashboard displays the profit per single item, total income for all items sold, and a percentage breakdown showing what portion of revenue is attributed to each product.
Hourly Sales Report Template
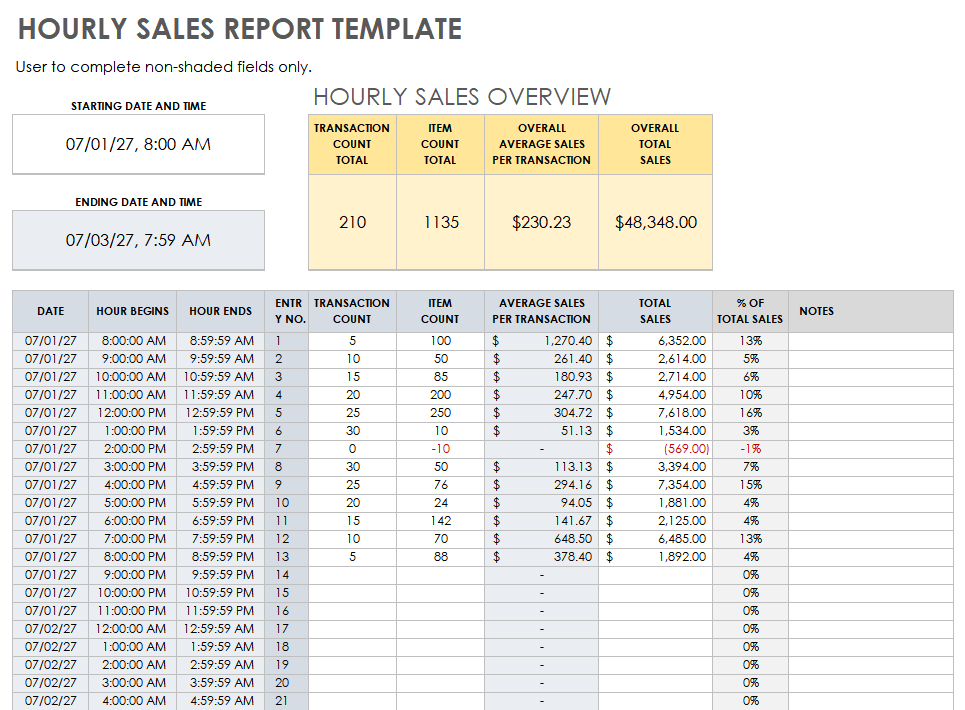
Download an Hourly Sales Report Template for
Excel
| Google Sheets
Make a comprehensive, hourly sales report for any time frame. Select the starting and ending dates and times for your report. Enter hourly sales data, including the number of items sold and sales amount. The template calculates the average and percent of sales made for each time slot. Sum totals appear at the top of the template and update each time you add new data to the report.
Sales Rep Daily Report Template for Excel
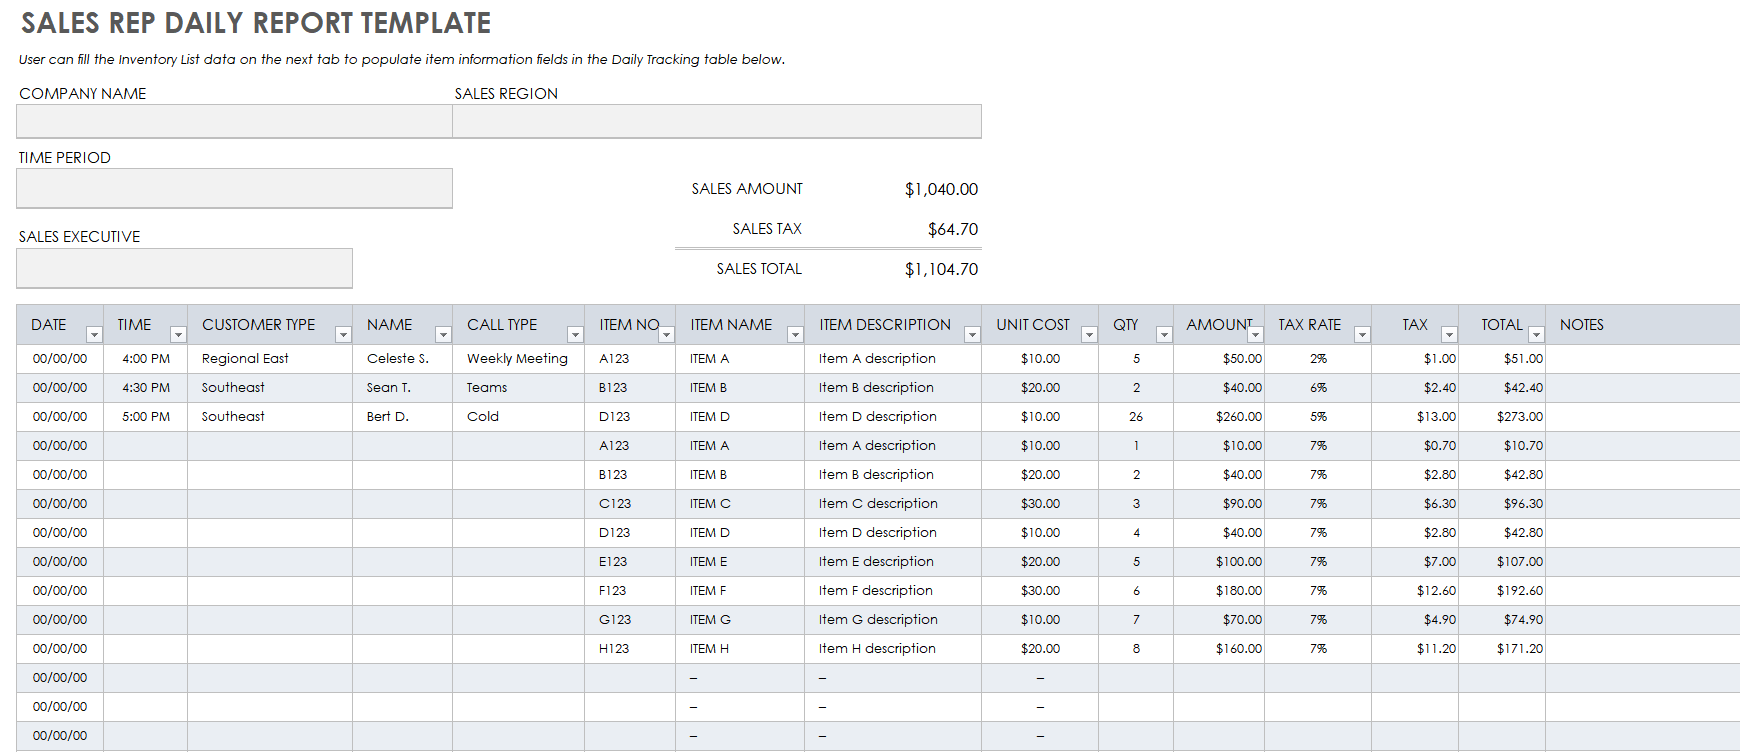
Download the Sales Rep Daily Report Template for Excel
Suited for an individual sales representative, this template can be used to record activities for a single day or over multiple dates. Use the Inventory tab to create a list of products with unit costs. On the main Sales Report tab, select your products from the dropdown menu in the item number column. Enter the number of units sold and tax rate, and the template computes the total sales amount. For each item sold, record the date, time, type of call, and customer information.
Monthly Retail Sales Summary Report Template
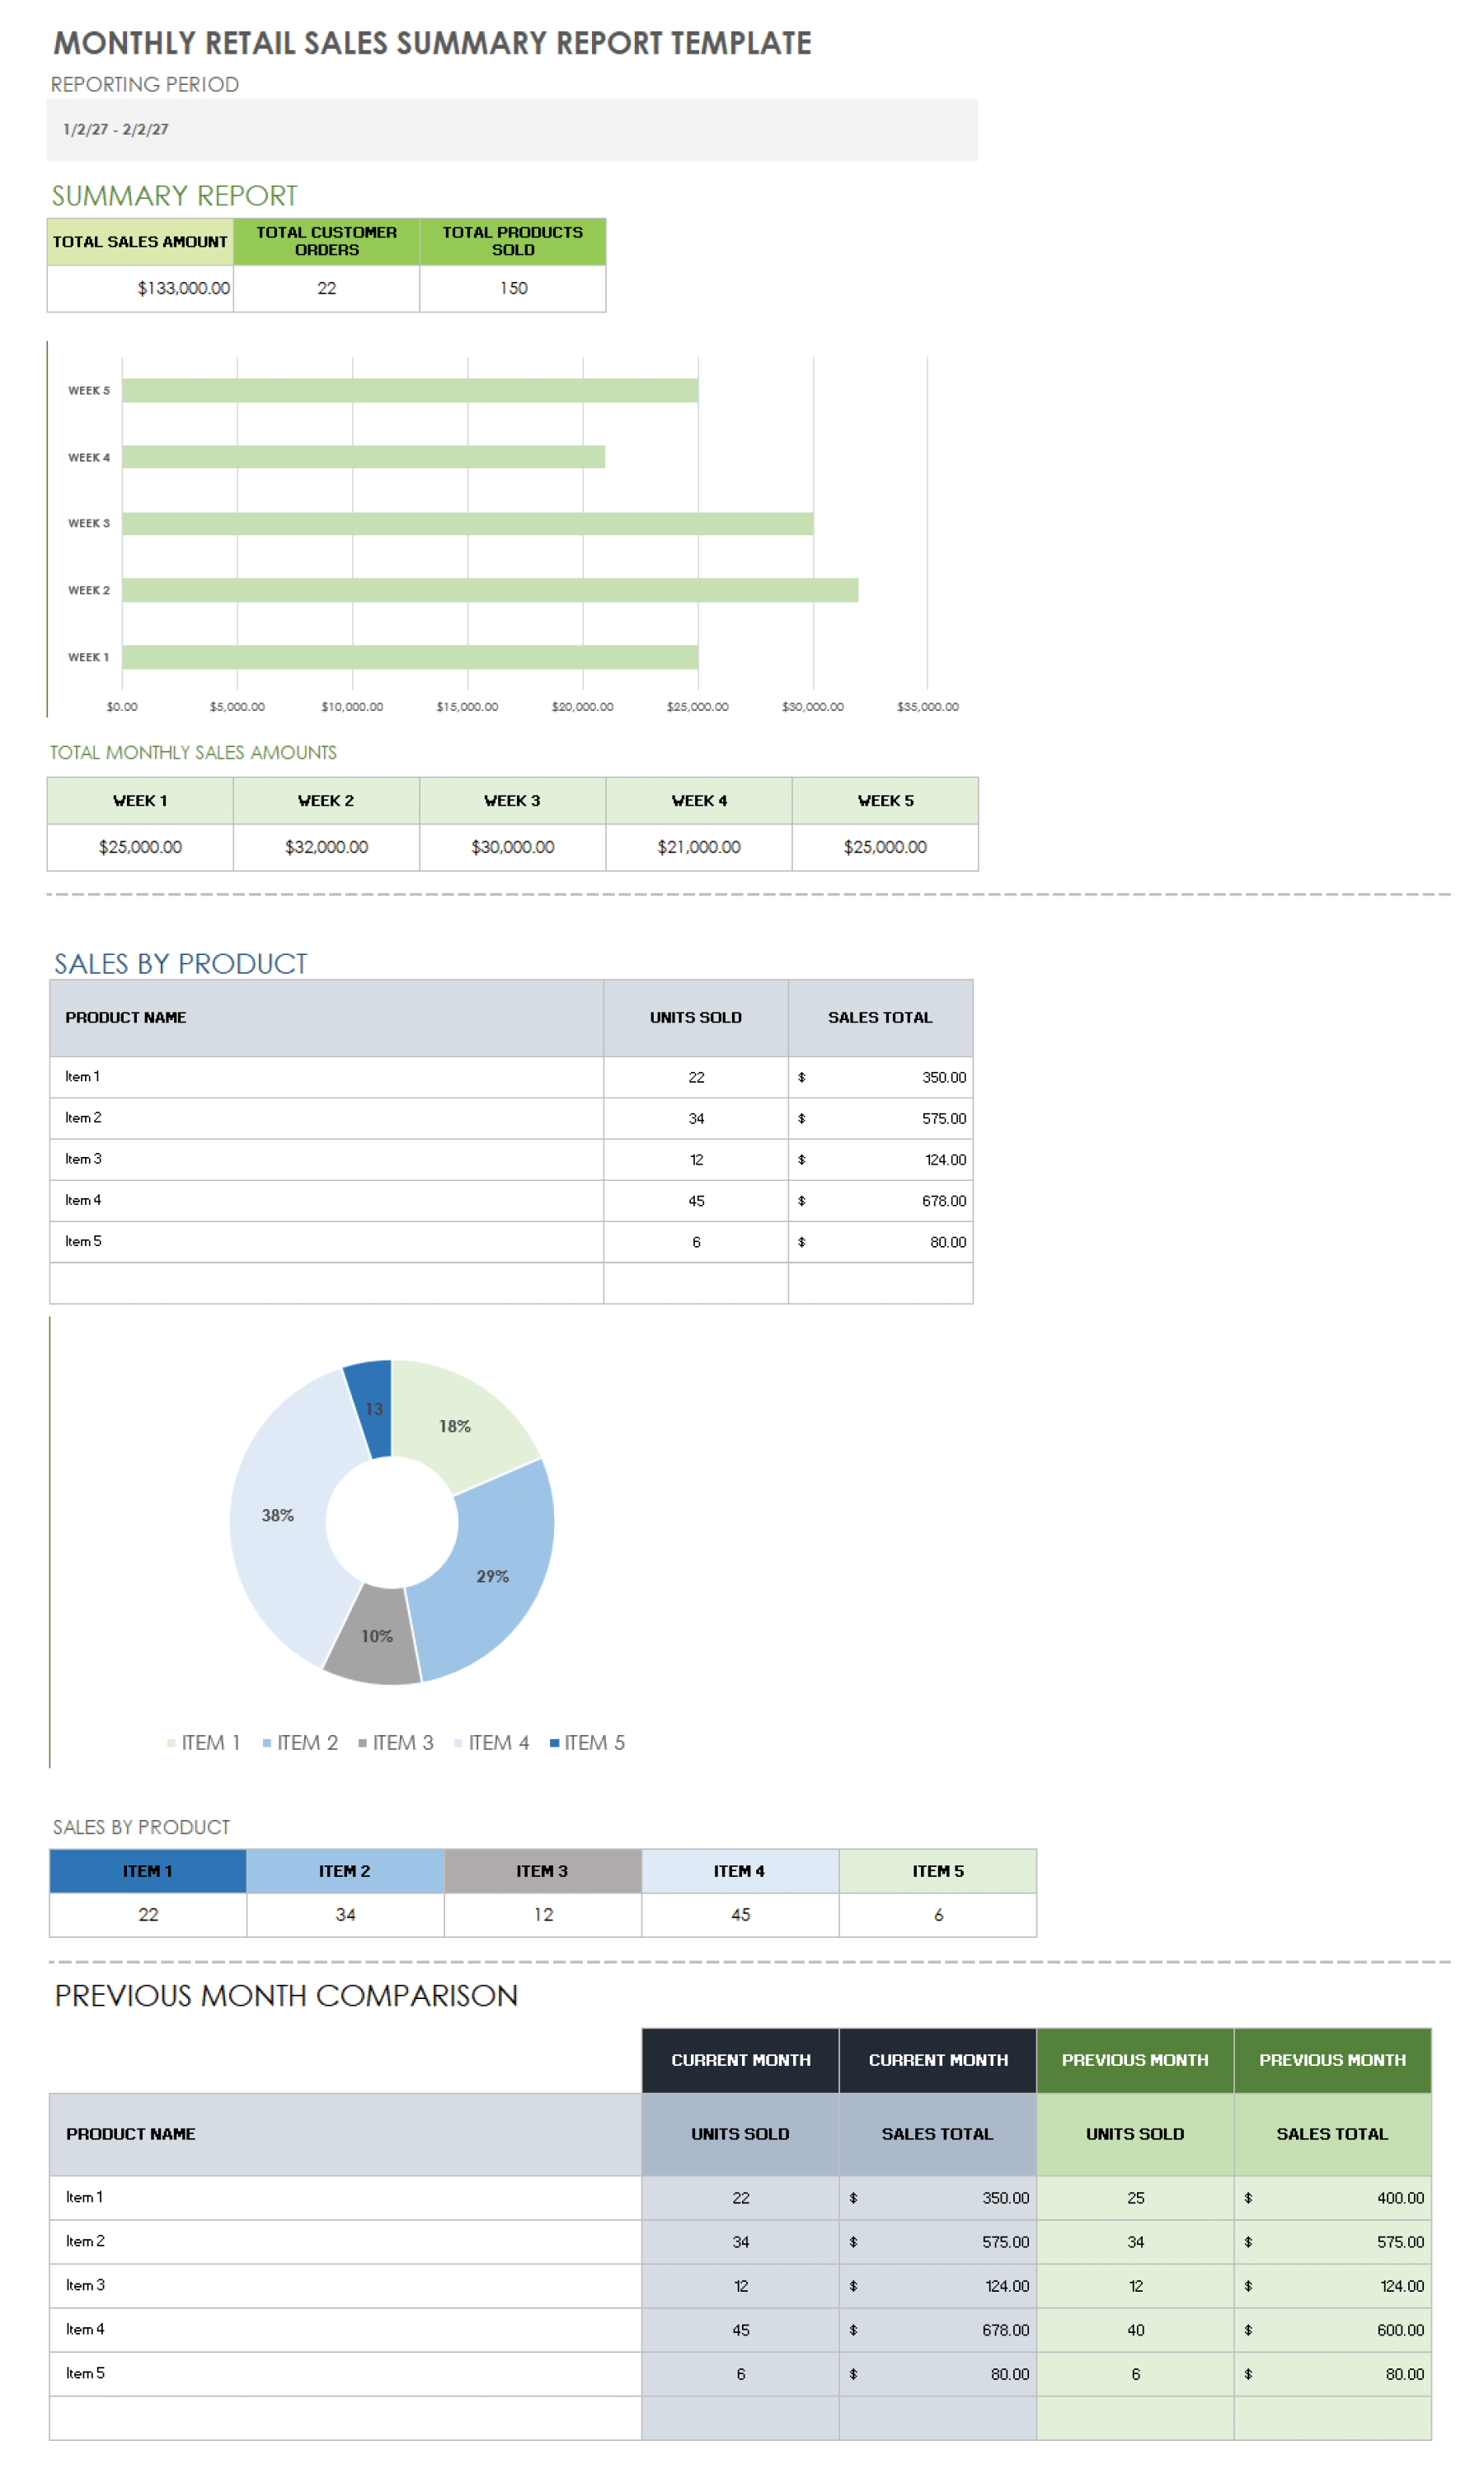
Download a Monthly Retail Sales Summary Report Template for
Excel
|
Microsoft PowerPoint
Monitor your monthly retail sales performance with this summary report. The template shows totals for customer orders, products sold, and sales amount during your chosen time period. A horizontal bar chart provides a breakdown of weekly sales revenue. Evaluate product performance with an itemized list of units sold, plus a pie chart showing the percentage of sales for each item. Compare current and previous month sales to set future goals for your retail business.
You can create a slide deck of your report by downloading the Microsoft Excel version to populate the charts with your sales data, then copy and paste screenshots into the PowerPoint template.
Restaurant Weekly Sales Report Template for Excel
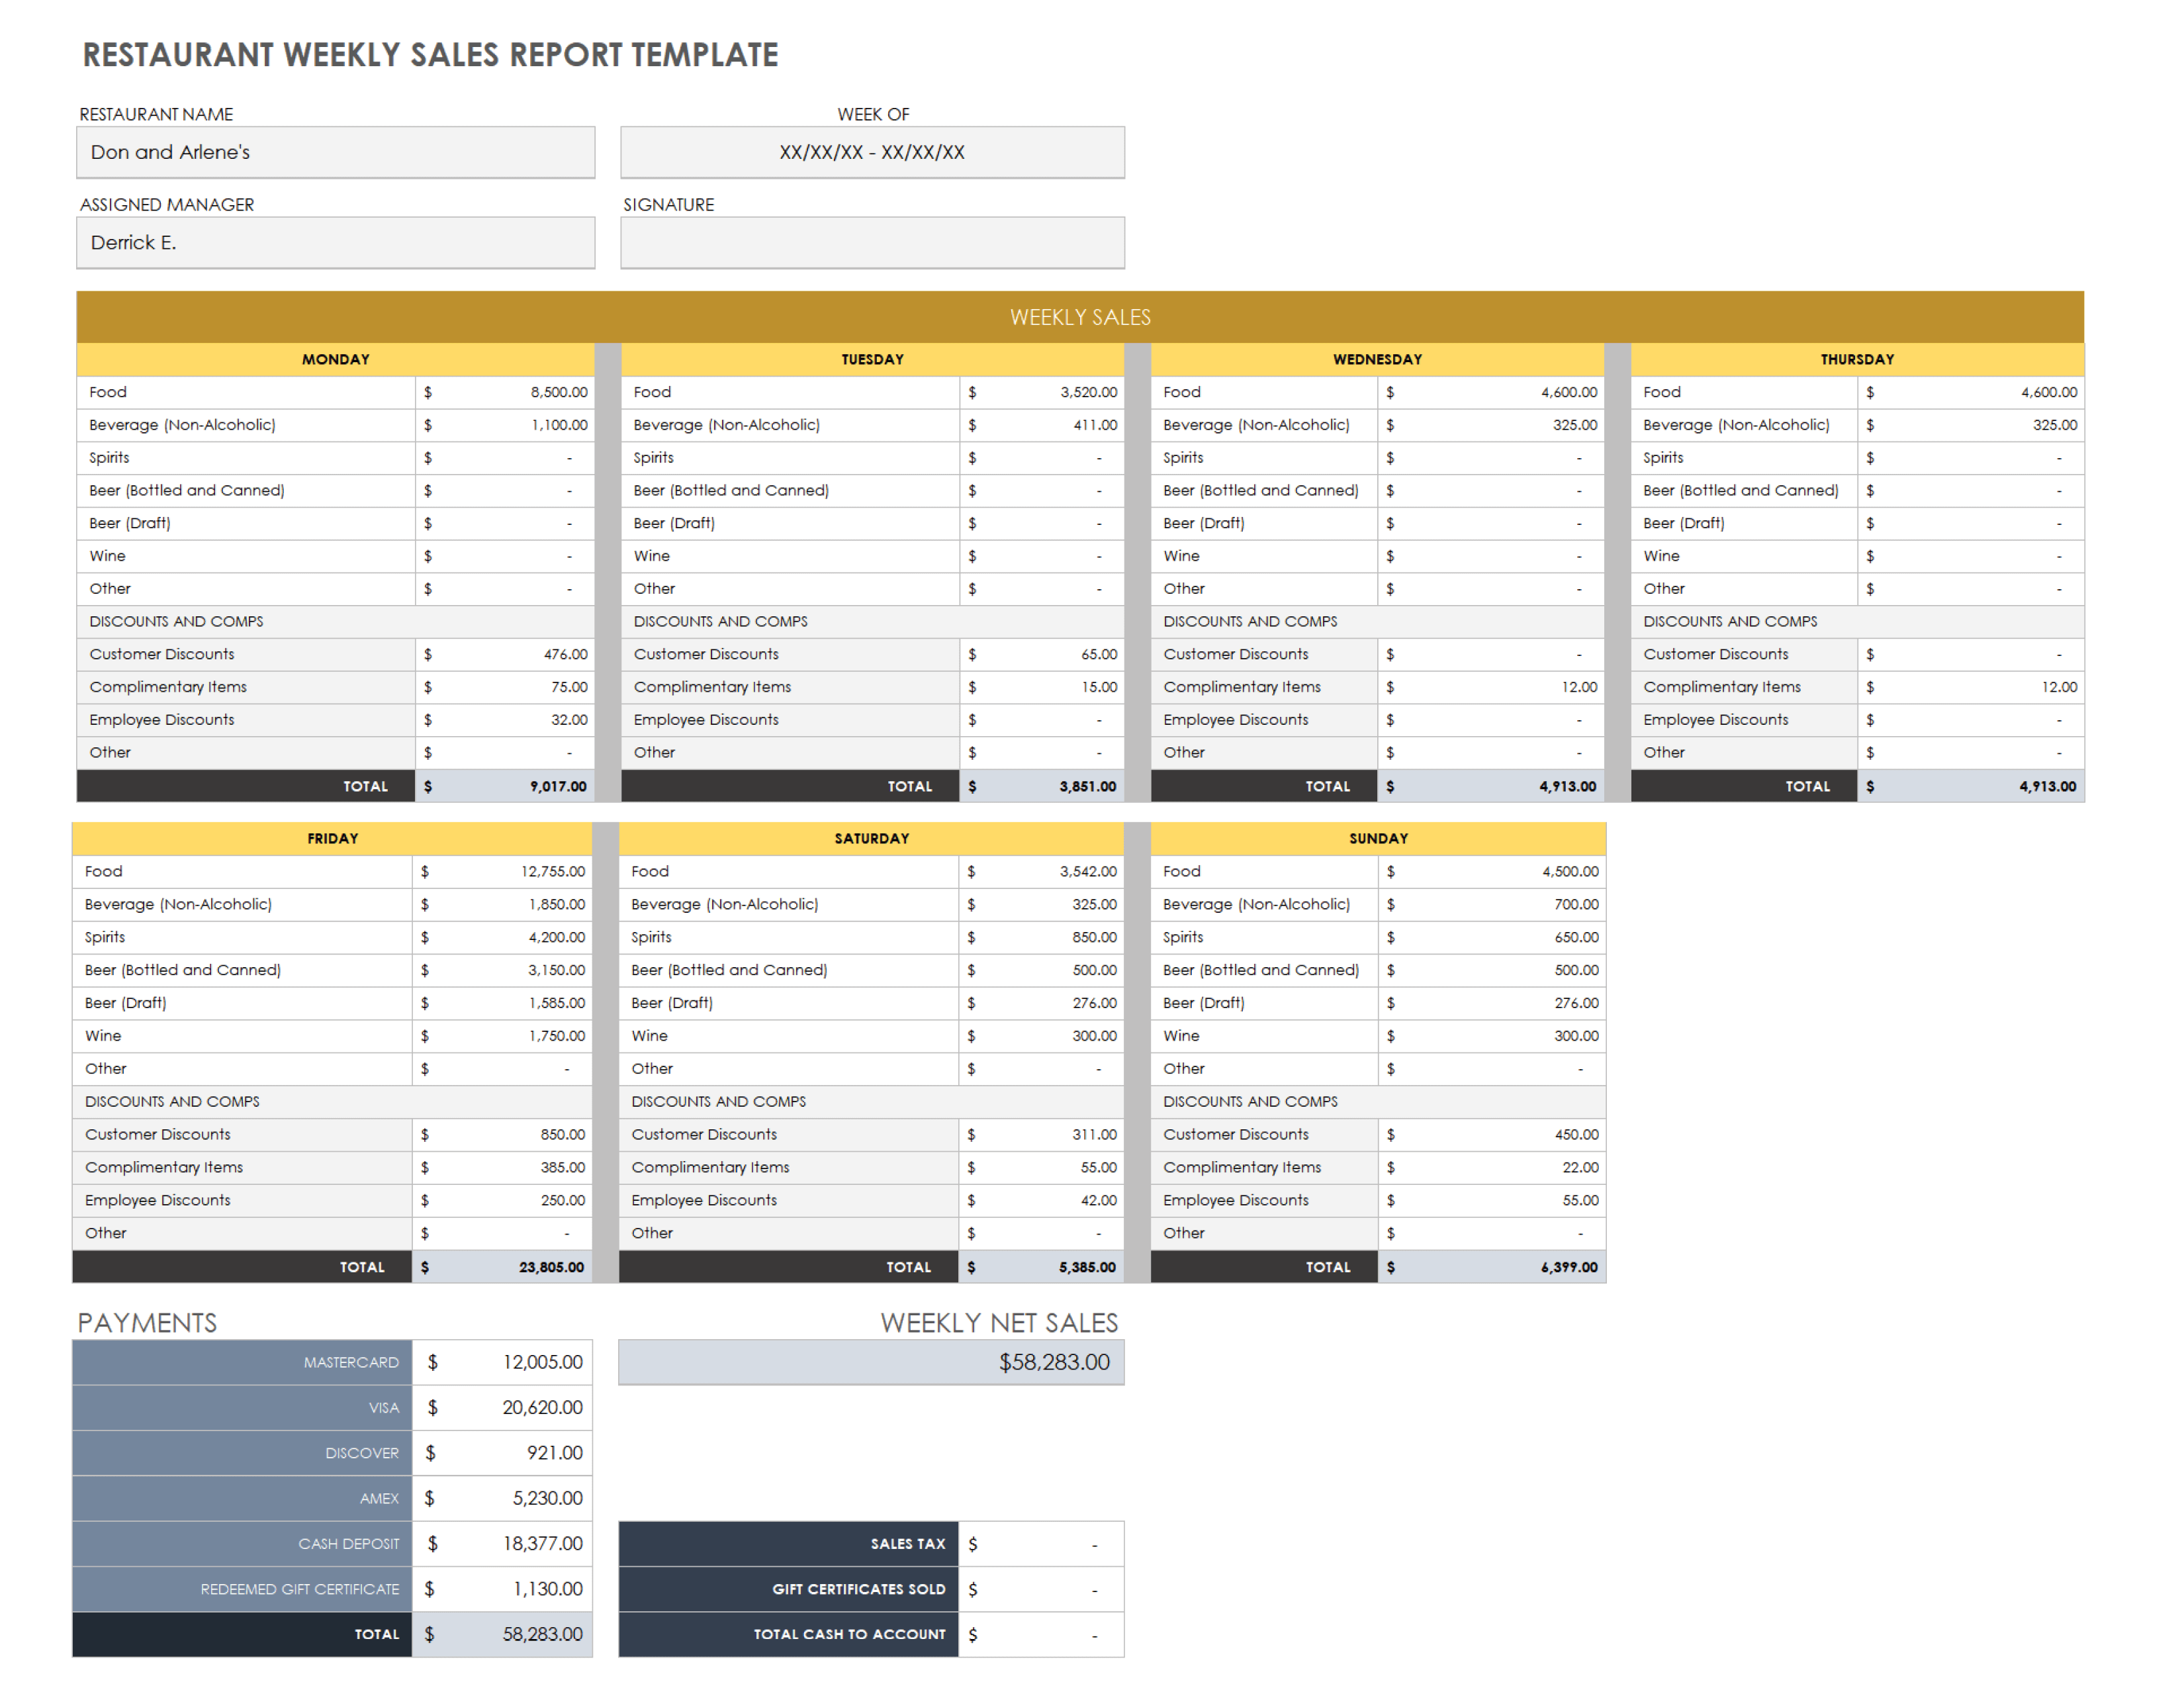
Download the Restaurant Weekly Sales Report Template for Excel
Compile daily and weekly restaurant sales information into a single report. The template provides example food and beverage categories, plus discounts and complementary items. Add or remove categories to create a customized template for your restaurant. Enter your itemized sales for each day, and the template tallies the daily subtotals and total weekly sales. Keep track of payment types with a separate section where you can input credit card, cash, and other transactions.
Real Estate Sales Report Template for Excel
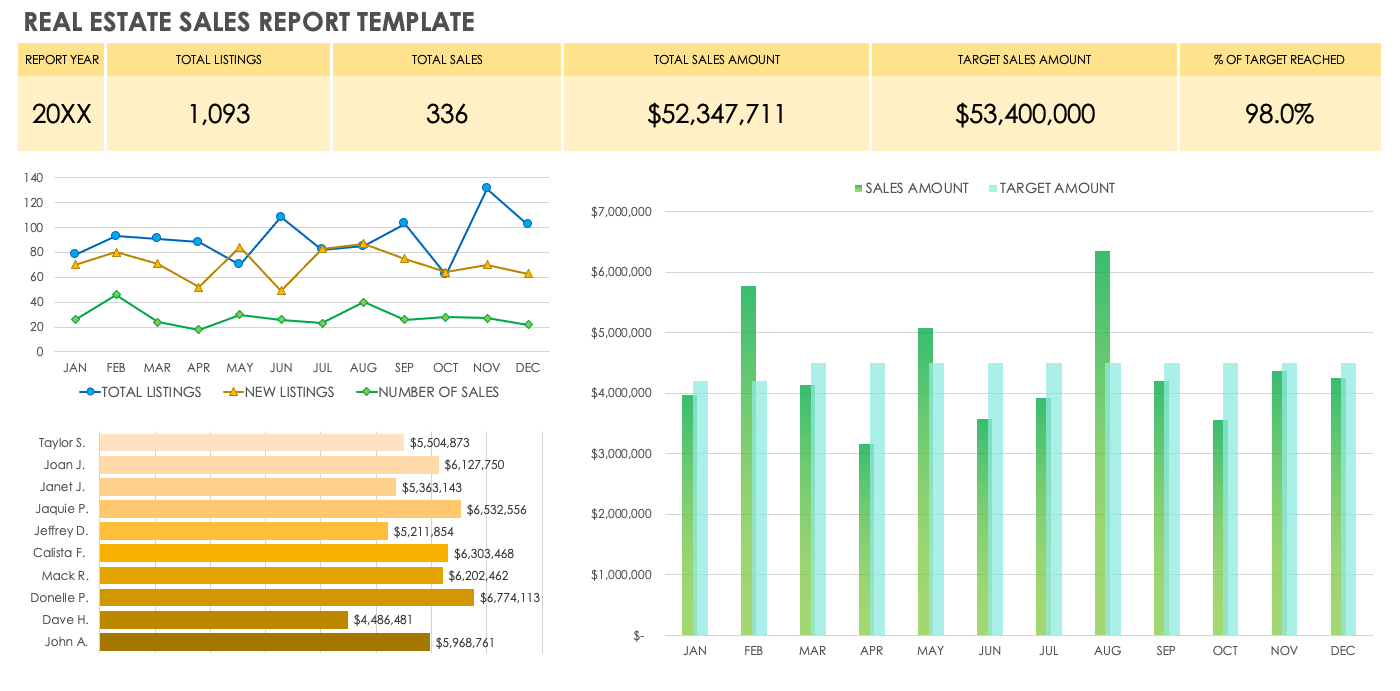
Download the Real Estate Sales Report Template for Excel
Real estate agencies can use this sales report template to assess team performance on a monthly and annual basis. See how agents performed with total listings, new listings, number of sales, and sales values. View actual versus target amounts to monitor sales objectives. The template includes a dashboard with charts and graphs for a visual summation of your sales data.
Quarterly Sales Report Template
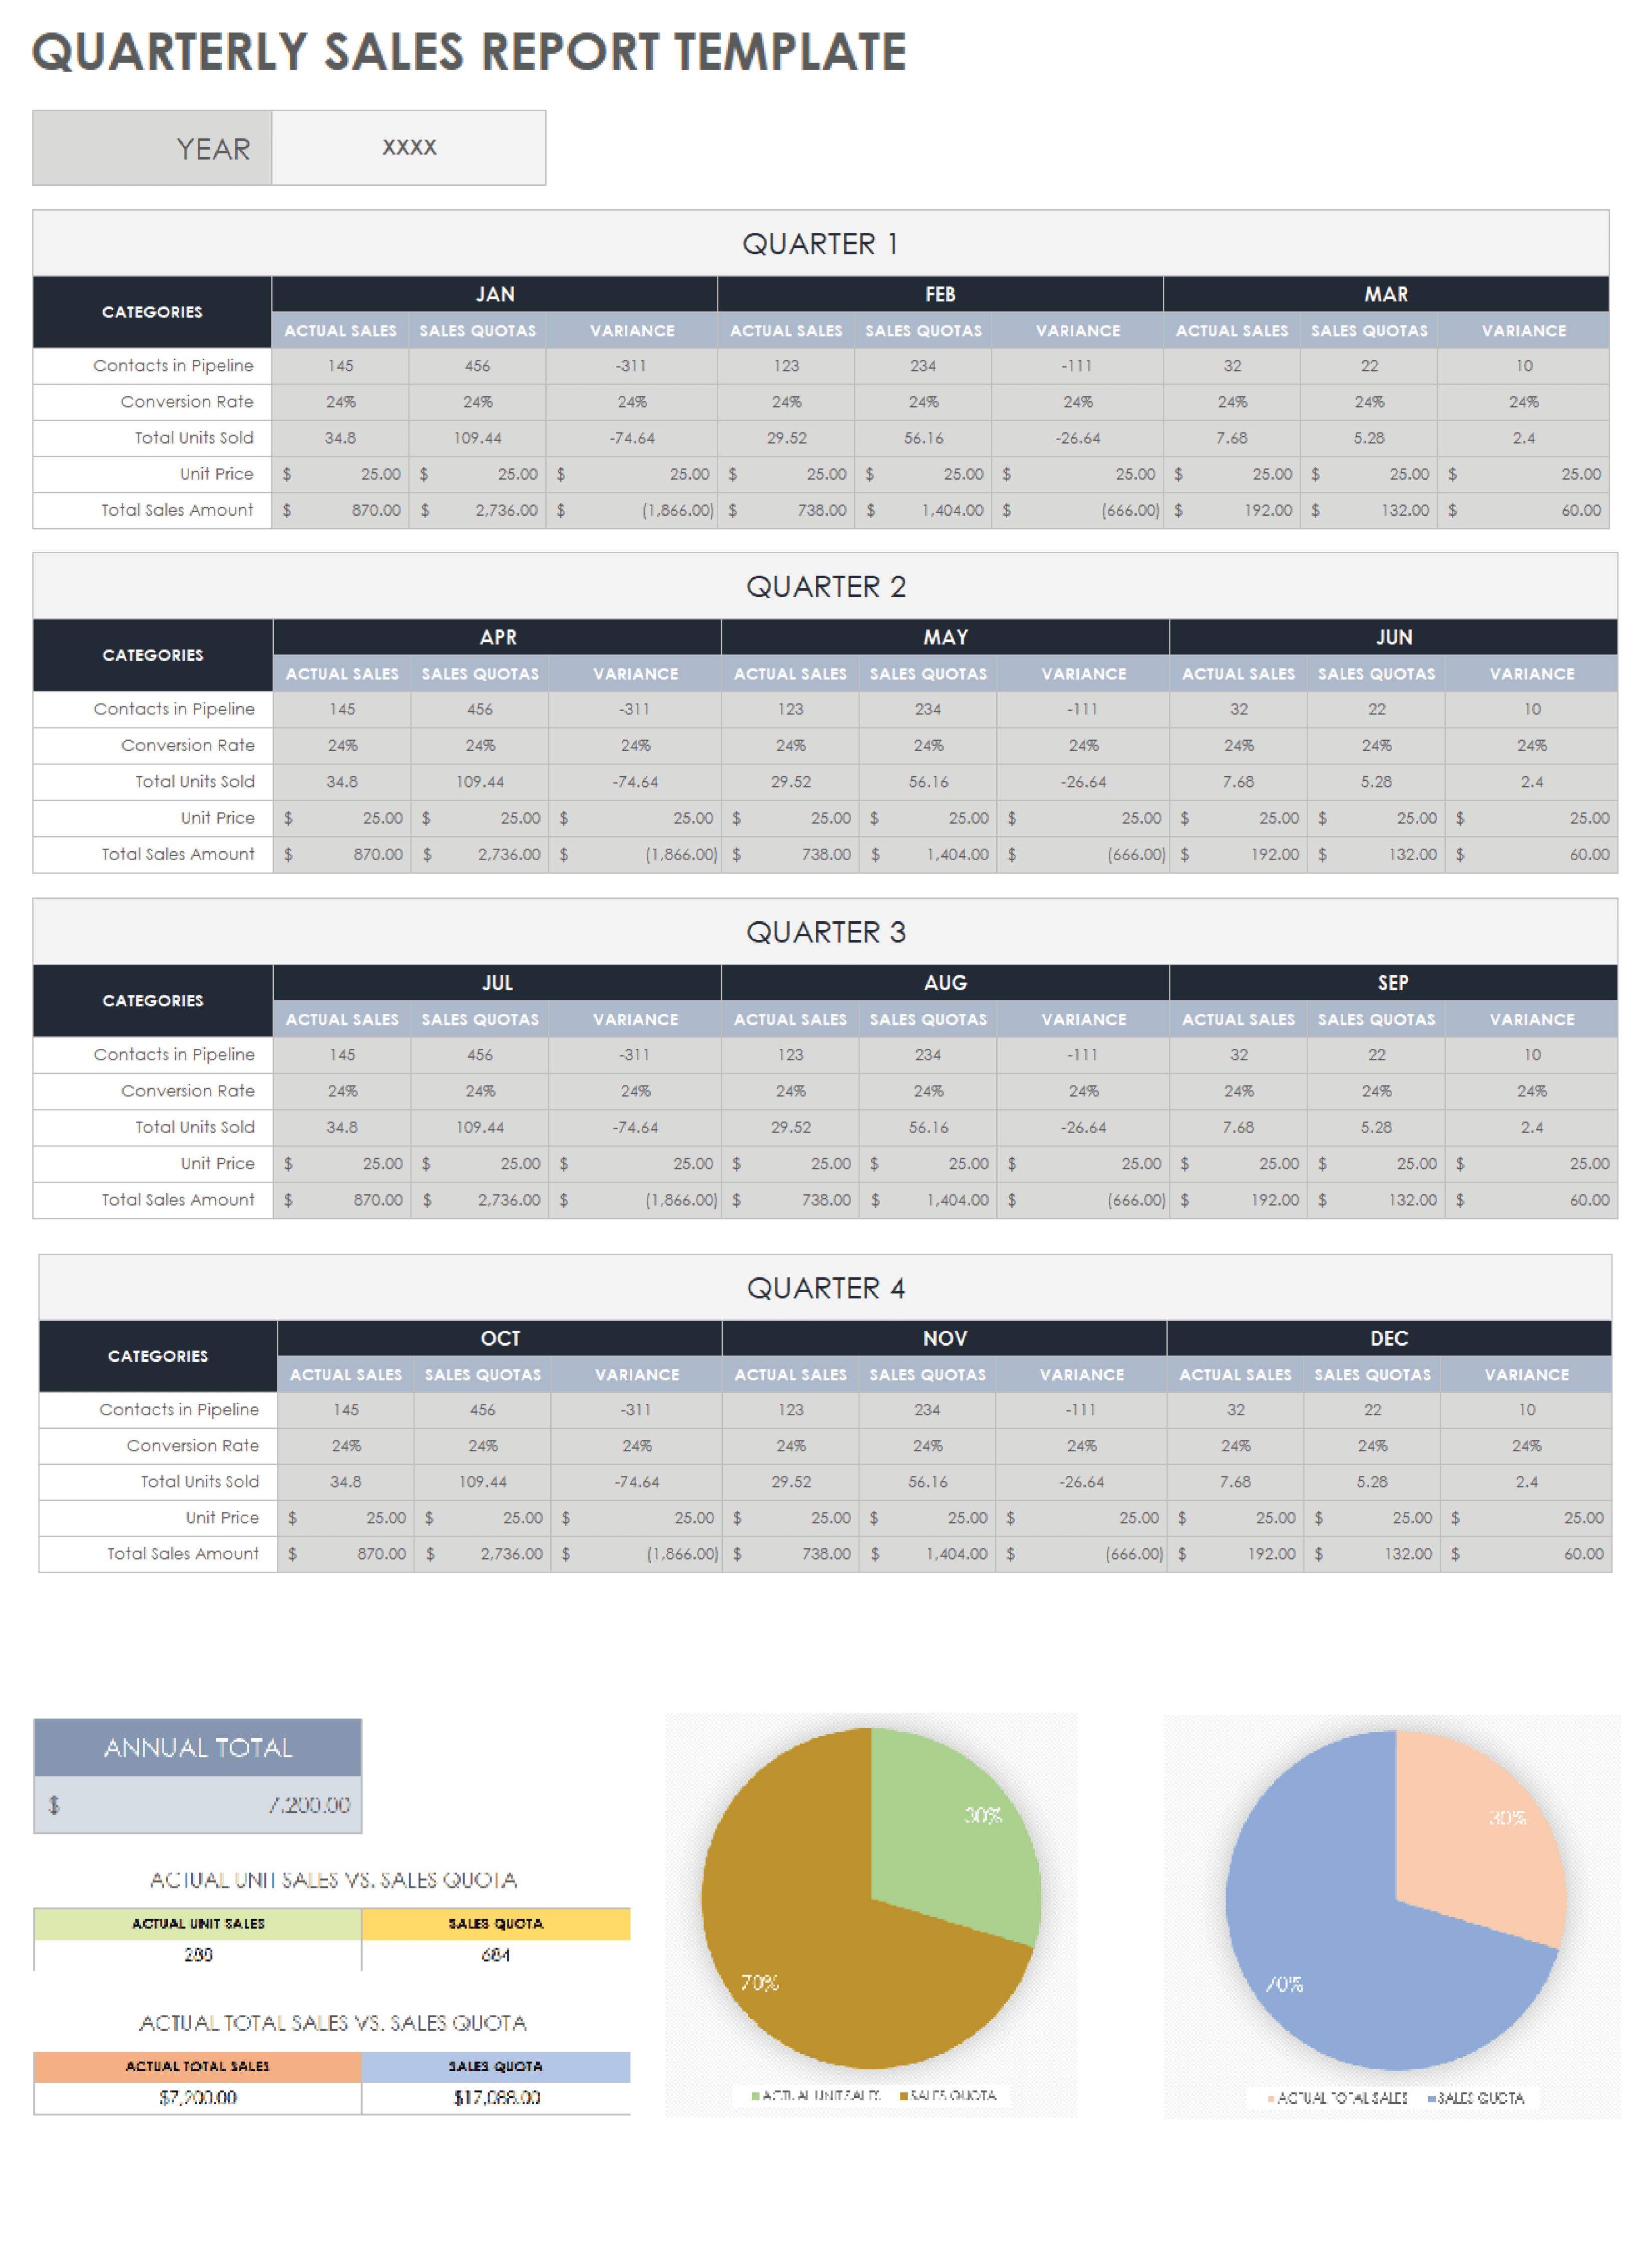
Download a Quarterly Sales Report Template for
Excel
| Google Sheets
This sales report template provides a monthly and quarterly breakdown of sales figures for one year. Collect data on the number of contacts in your sales pipeline, conversion rate, units sold, and total sales value for each business quarter. Graphs illustrate your actual unit sales and total sales amounts over time and compares it to your sales quotas.
Year-End Sales Report Template
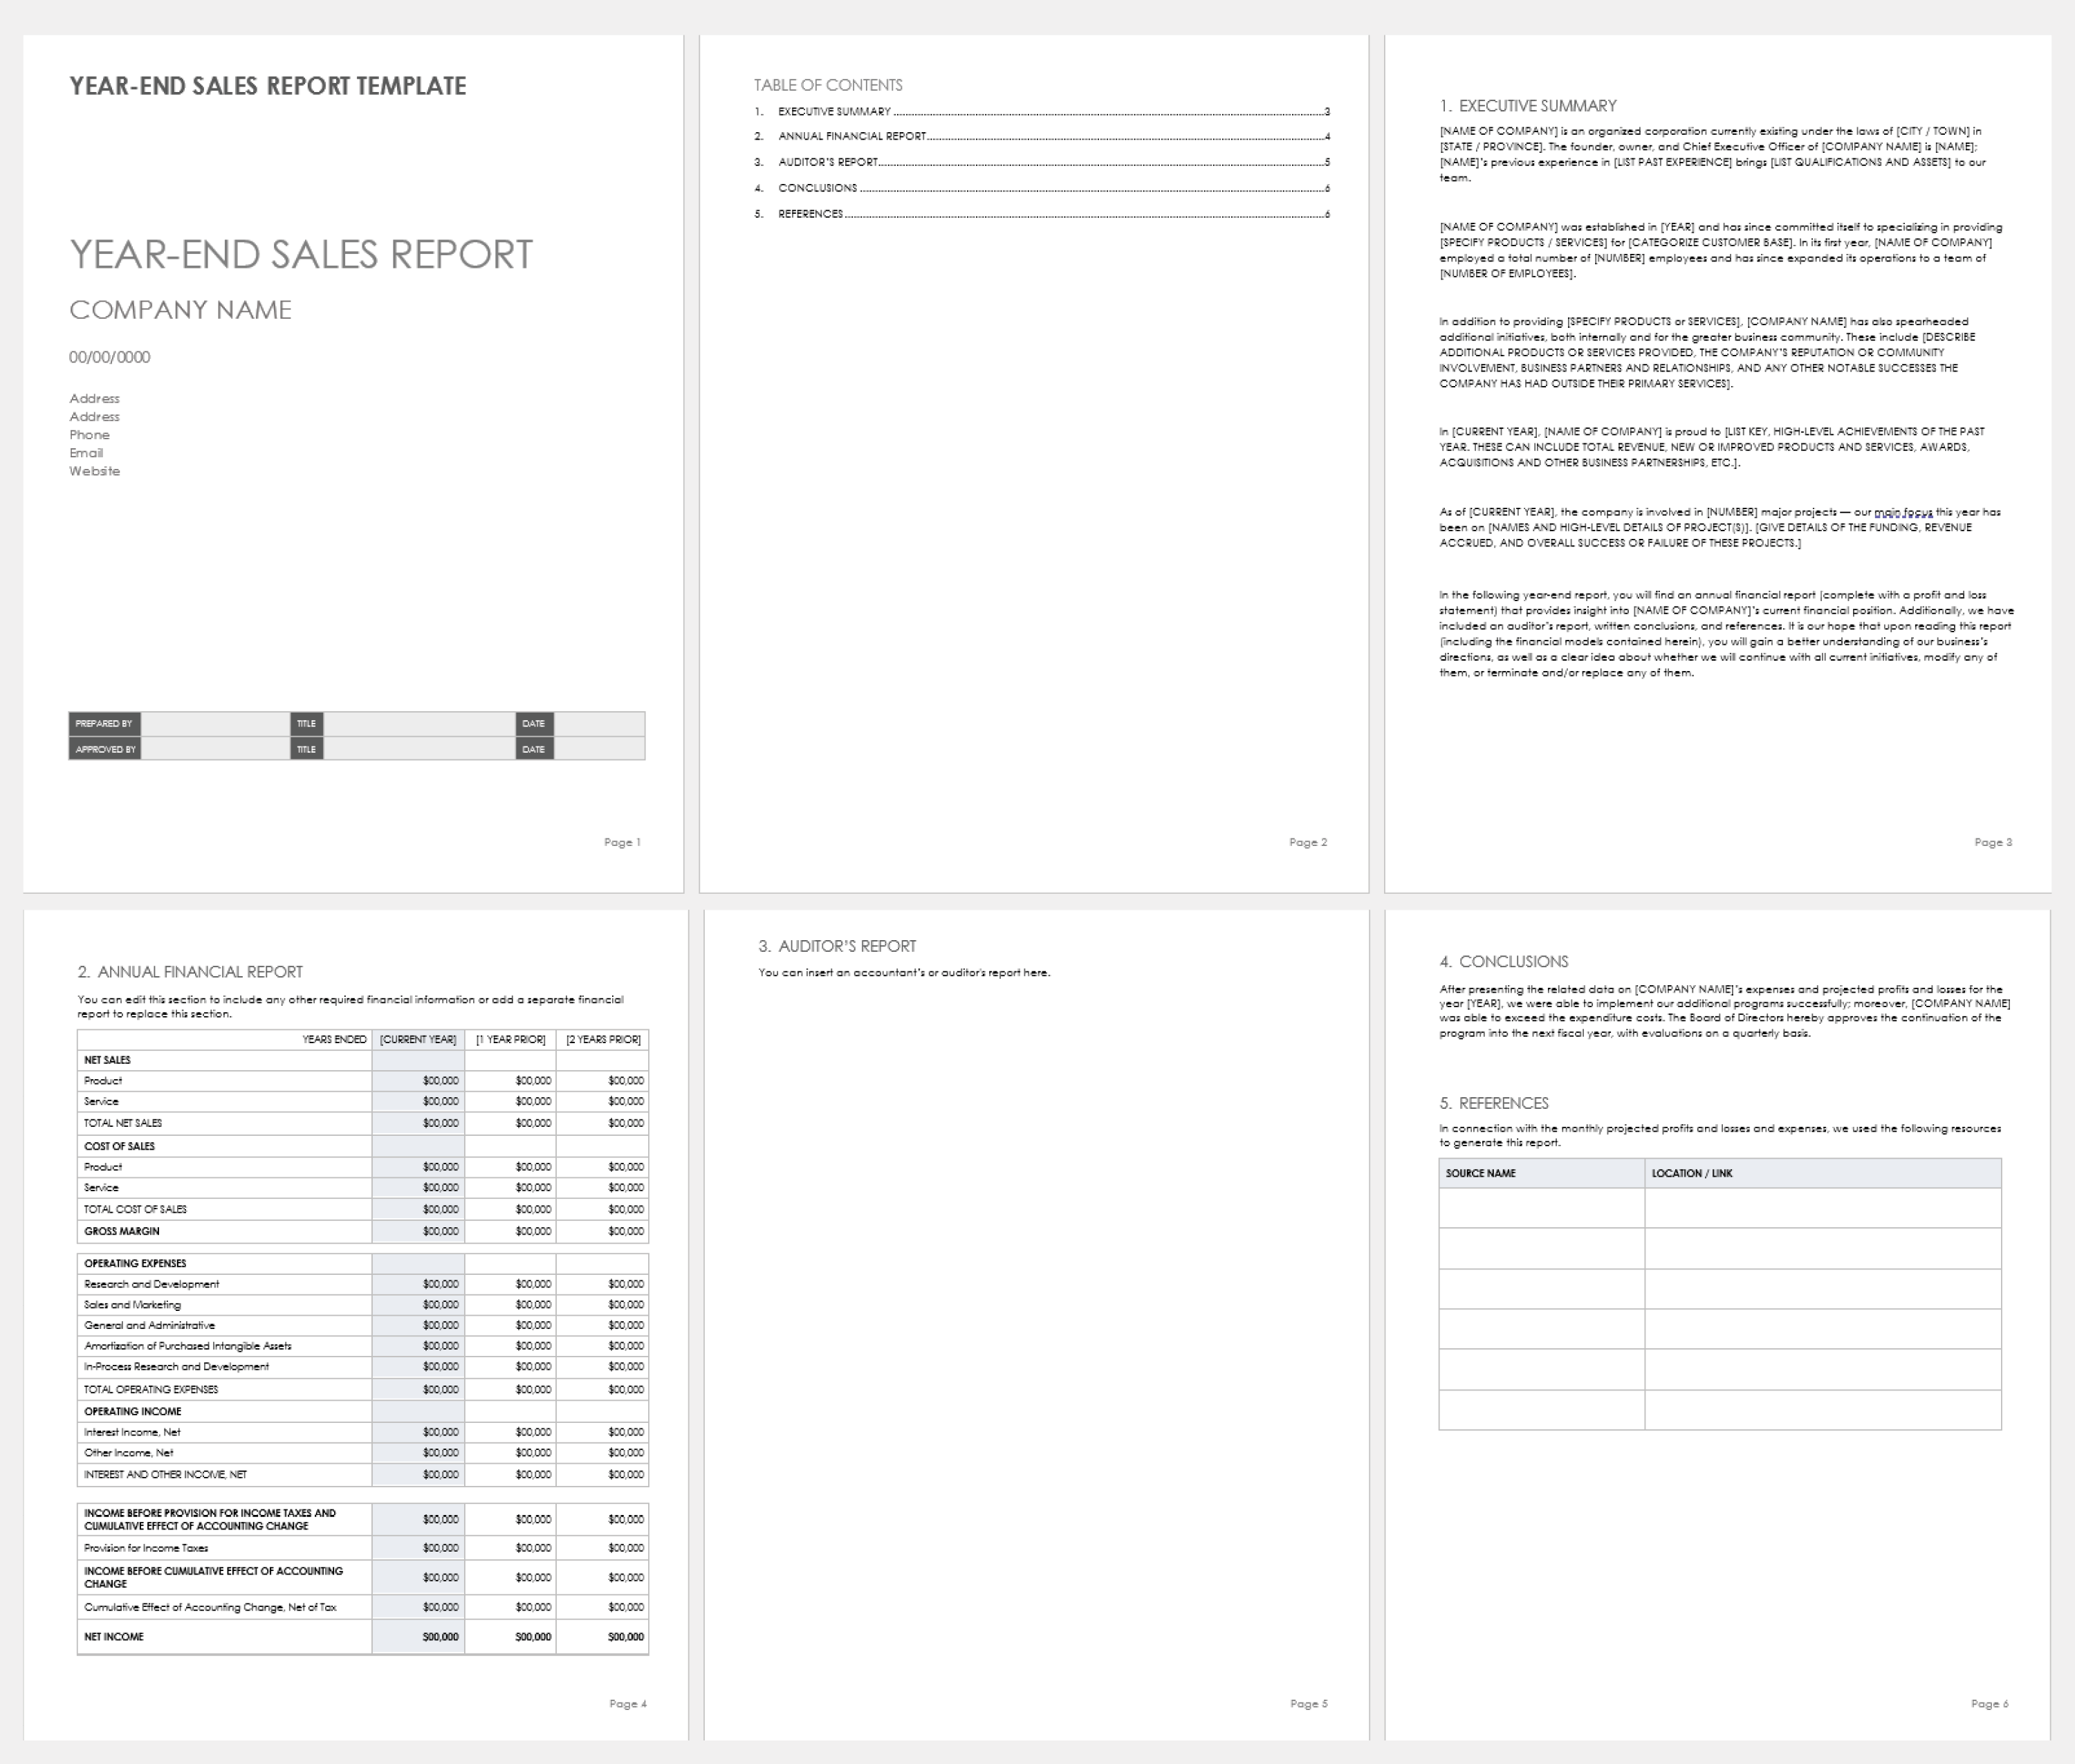
Download a Year-End Sales Report Template for
Microsoft Word
|
Adobe PDF
|
PowerPoint
This annual sales report includes a table of contents, an executive summary with sample text, a section for listing financial data, and space for inserting an auditor report. Attach any other documentation needed to create a thorough report for stakeholders. Enter your sales data for current and previous years in the preformatted table to see performance changes over time. This template is also useful for creating an outline for developing a customized yearly report for your business.
What Is a Sales Report Template?
A sales report template provides a pre-built form for compiling sales data. The report gives sales managers and stakeholders insight into daily, weekly, monthly, quarterly, or yearly sales performance, and might focus on one salesperson or a sales team.
Find additional templates and learn more about the sales process, effective sales management, and sales forecasting in our comprehensive guides.
Streamline Your Sales Reporting with Smartsheet
Empower your people to go above and beyond with a flexible platform designed to match the needs of your team — and adapt as those needs change.
The Smartsheet platform makes it easy to plan, capture, manage, and report on work from anywhere, helping your team be more effective and get more done. Report on key metrics and get real-time visibility into work as it happens with roll-up reports, dashboards, and automated workflows built to keep your team connected and informed.
When teams have clarity into the work getting done, there’s no telling how much more they can accomplish in the same amount of time. Try Smartsheet for free, today.