Why Is a Gantt Chart Important?
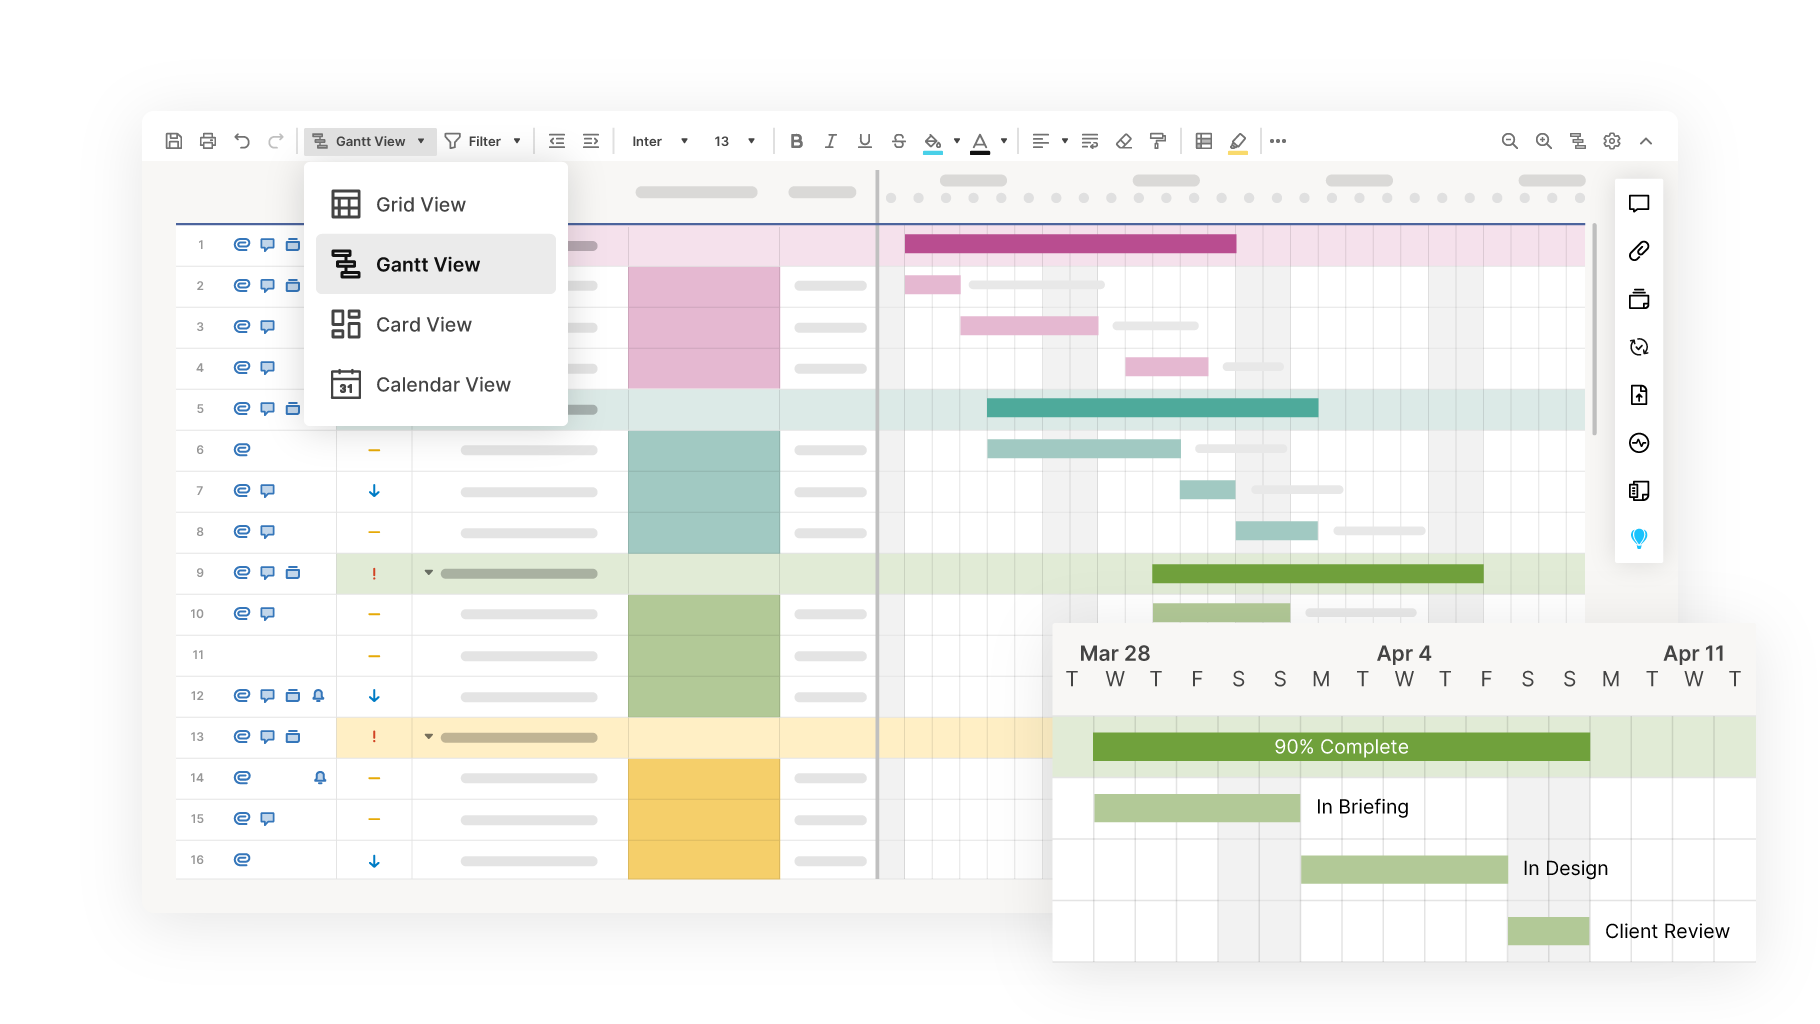
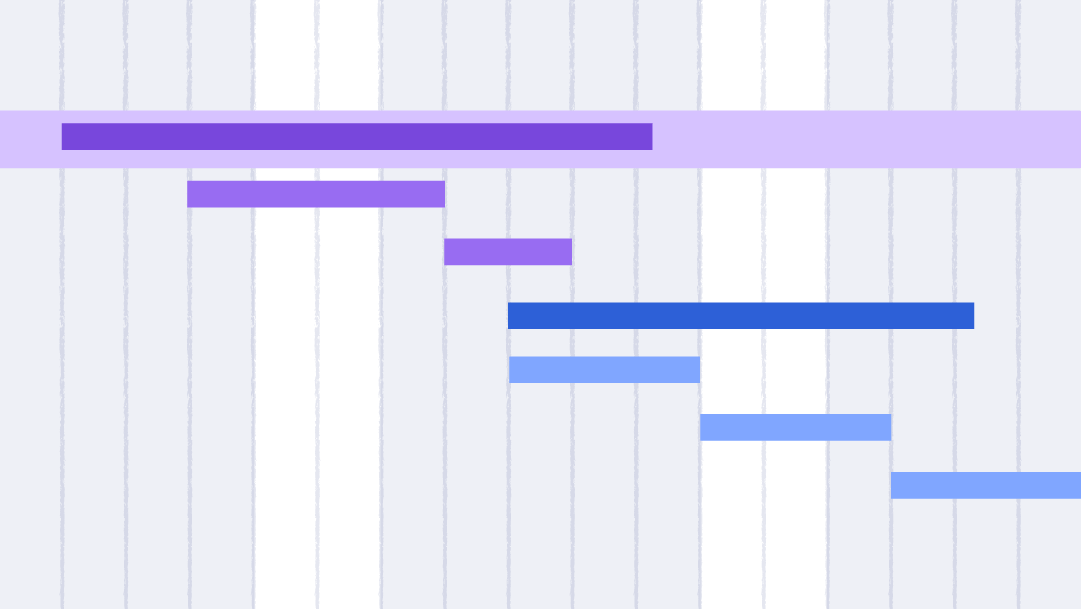
A Gantt chart uses timelines to represent the completion of each task in a project. These timelines show how the tasks relate to one other. Gantt charts are useful because they provide an overview of a project’s activities and progress.
Gantt charts indicate how work on a task can begin only after the completion of a related task. Such information helps managers understand project hurdles and make critical decisions about the best way to move a project forward.
The Disadvantages of Gantt Charts
Gantt charts aren’t perfect. Setup can be time consuming. With large projects, the number of tasks and their details can complicate the chart and make it difficult to understand.
The Main Challenges of Gantt Charts
One of the primary challenges when using Gantt charts is their complexity in large projects. The charts can also fail to represent the complexities of certain tasks and the time your team requires to complete them.
Here are some of the main challenges of Gantt charts:
- Setup Can Be Time Consuming: Setting up a Gantt chart for a complex project can be convoluted and time consuming. Software can help.
- They Can Become Complex and Confusing: A Gantt chart for a large project with many tasks and subtasks can become complicated. Adding even more tasks or making changes to the schedule affects the entire chart. When your organization doesn’t use software to help, repeatedly reworking the Gantt chart can become difficult.
The chart loses some of its value when it becomes too complicated. One of the advantages of a Gantt chart is its ability to depict a project and its tasks at a glance. When the project description expands to cover hundreds of tasks over multiple pages, you lose such an advantage. - They Don’t Designate Priorities: Gantt charts focus on presenting the tasks in a project, the order of those tasks, and the approximate time it takes to complete them. The charts don’t show the priority of the particular tasks you need to complete for the project to be a success. With such an omission, team members might not understand those priorities the way they should.
- They Don’t Offer Much Detail Regarding Task Dependencies: Gantt charts can show how you must complete one task before starting another one. But they don’t provide much detail concerning all of the dependencies within a particular task for a project.
For this reason, a project team might want to use a program evaluation review technique (PERT) chart in conjunction with a Gantt chart. A PERT chart or graphic uses arrows to indicate the sequence in which project team members must complete certain tasks in order to begin work on another task. (To learn more about PERT and PERT charts, visit “PERT 101: Charts, Analysis, and Templates for More Accurate Project Time Estimates.”) - Task Bars Do Not Show the Amount of Work That Each Task Requires: The length of a Gantt chart task bar shows the amount of time it might take to finish a task. But that length doesn’t indicate the specific resources that such a task requires.
Some tasks with short bars (representing short deadlines) might require significant resources. Some tasks with long bars might require minimal resources. The Gantt chart can be misleading when it comes to representing the amount of work and resources you require. Thus, in order to correctly allocate and monitor resources, you might need to use other tools in addition to the Gantt chart.
When Should You Use a Gantt Chart?
You should use a Gantt chart when your team is embarking on a project that includes a variety of tasks that several people must perform. A Gantt chart can help you move a large project forward more efficiently.
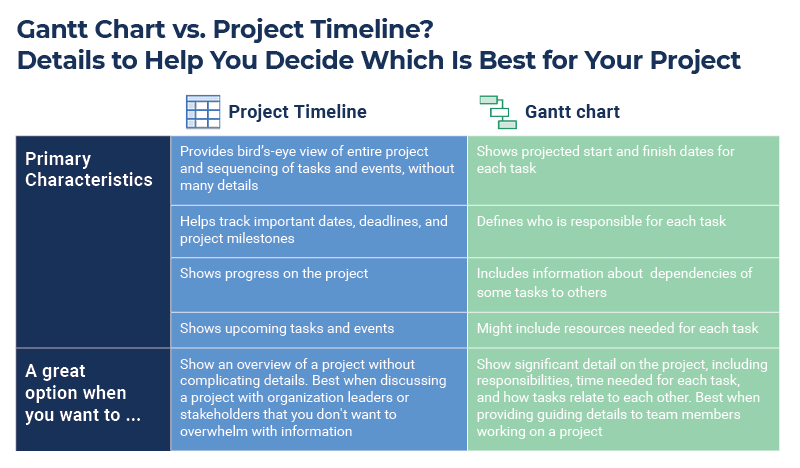
However, there are times when you may want to use a simpler tool in order to show a project overview. These tools include a project timeline and a project calendar.
Download Table Showing Differences Between Project Timeline and Gantt Chart - PDF
You can also use the decision tree below to help you decide whether to use a project timeline, project calendar, or Gantt chart for your next project.
To learn more about creating a Gantt chart and get downloadable templates that can help you plan your projects, visit “Free Yearly Gantt Charts: 1-Year, 3-Year, and 5-Year.” To learn more about creating a Gantt chart in Microsoft Word, visit “How to Make a Gantt Chart in Microsoft Word.” You can also check out the following: “How to Make a Gantt Chart in PowerPoint”; “How to Make a Gantt Chart in Google Sheets”; “How to Create a Gantt Chart in Excel with a Template”; and “How to Create a Gantt Chart in Numbers: A Basic Mac Tutorial.”
To get templates that help you create Gantt charts for a number of projects, visit “Free Gantt Chart Templates for Multiple Projects.”
For templates to help you create a Gantt chart with dependencies among tasks, visit “Free Gantt Chart with Dependencies Templates.” You can also check out the following links for templates in specific formats: “Free MS PowerPoint Gantt Chart Templates” and “Download Free Gantt Chart Templates in Microsoft Word.”
How Is a Gantt Chart Useful?
Gantt charts help you organize projects, improve overall project visibility, and keep everyone on track. Gantt charts also help managers provide resources when and where they need them. And they encourage collaboration among project team members.
Gantt charts can help project managers do the following:
- Determine all necessary tasks, think through a project plan, and better define the scope of a project to increase clarity.
- Identify when tasks need to be completed, and determine predecessors and dependencies.
- Discover a project’s critical path to identify the most important tasks that you must deliver on time.
- Keep your team informed about progress or changes, and eliminate the need for constant status updates and meetings.
- Simplify complex tasks by organizing projects into smaller, digestible segments along a visual timeline.
- Allocate resources across the multiple simultaneous tasks in a project, and assign the right people to the right tasks. (To learn more about resource management, visit “Resource Management Is People Management: Principles, Systems, and Plans.”
- Plan project iterations or sprints, especially in software development.
- Track and compare planned versus actual timelines, and ensure that those planned timelines are reasonable and achievable.
- Facilitate collaboration among stakeholders and team members.
- Identify overdue tasks and take proactive measures to mitigate issues.
- Shorten the setup, maintenance, and communication involved in projects, both large and small.
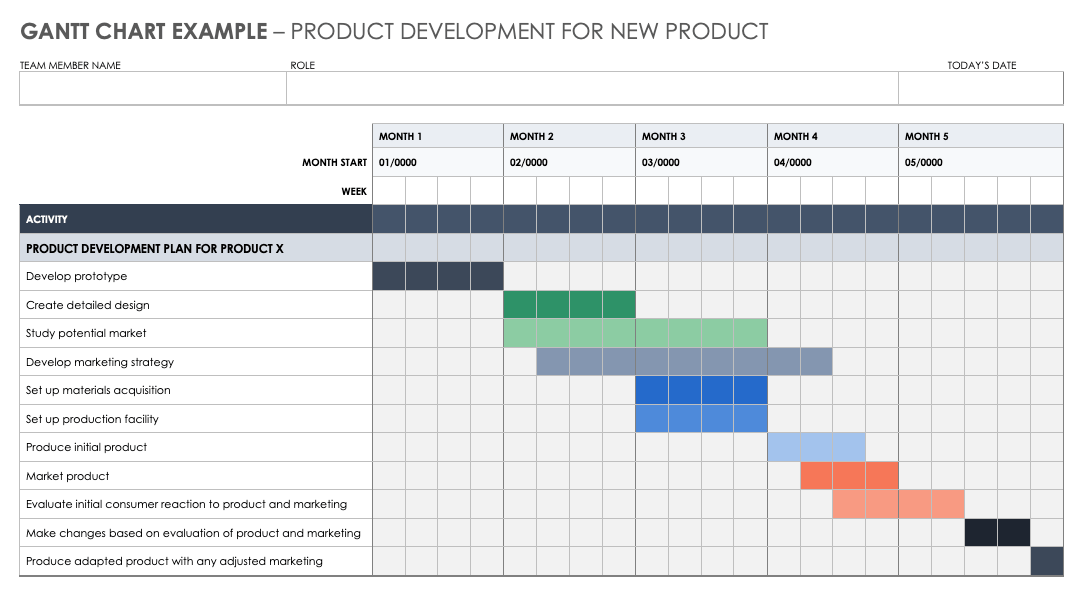
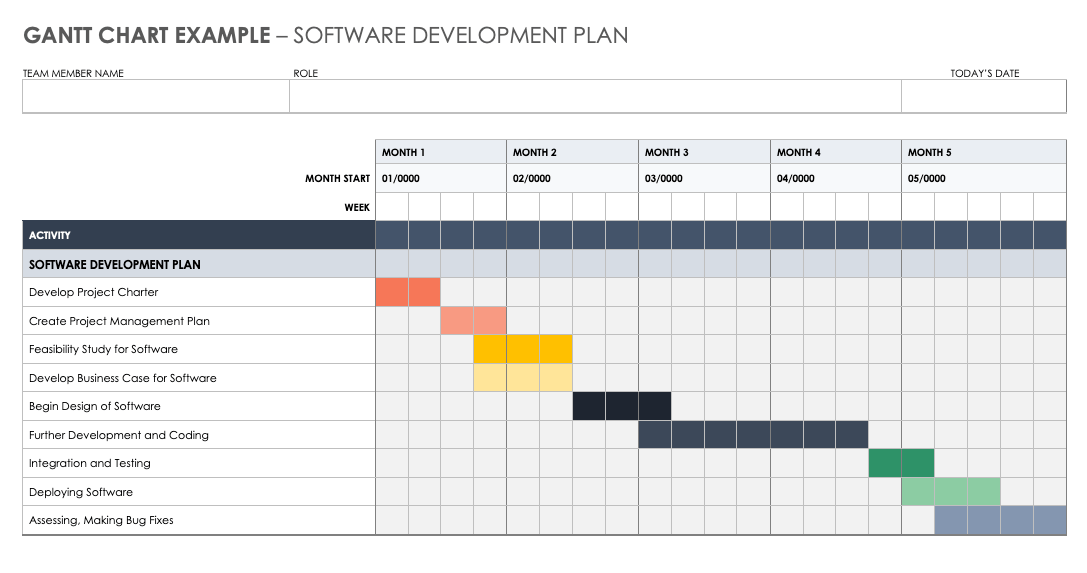
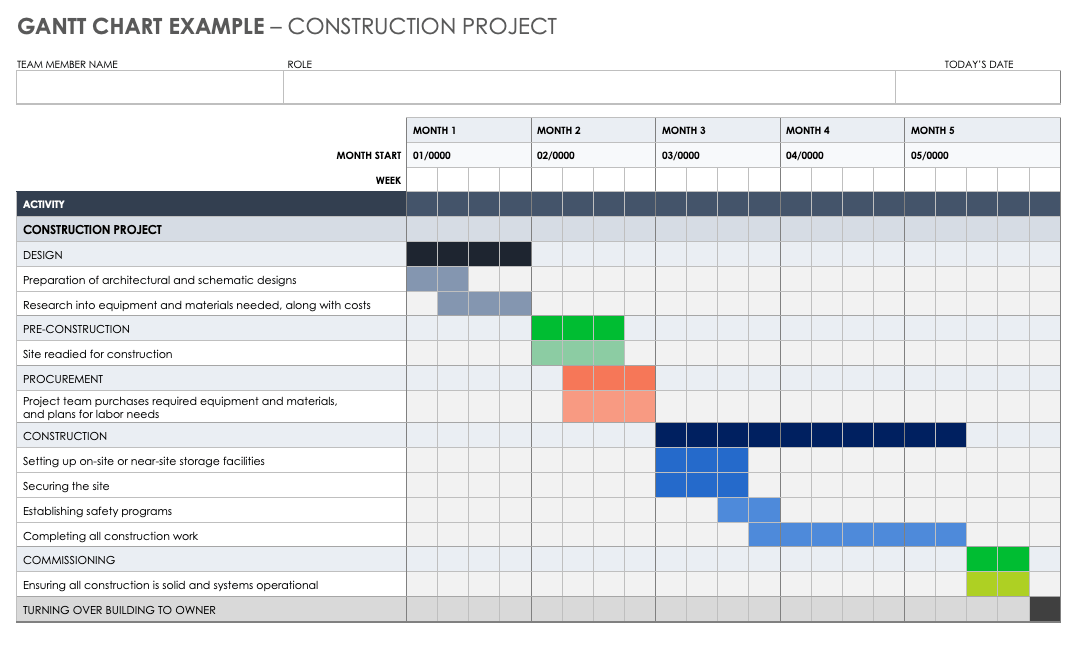
Here are three examples of simple Gantt charts that can help you plan and drive forward specific projects in construction, software development, and product development.
Download Gantt Chart Example for Product Development - Word
Download Gantt Chart Example for Software Development Plan - Word
Download Gantt Chart Example for Construction Project - Word
For more information on Gantt charts, including their history and how to use them, visit “Guide to Gantt Charts.”
Learn the Pros and Cons of Gantt Charts for Project Management with Smartsheet
From simple task management and project planning to complex resource and portfolio management, Smartsheet helps you improve collaboration and increase work velocity -- empowering you to get more done.
The Smartsheet platform makes it easy to plan, capture, manage, and report on work from anywhere, helping your team be more effective and get more done. Report on key metrics and get real-time visibility into work as it happens with roll-up reports, dashboards, and automated workflows built to keep your team connected and informed.
When teams have clarity into the work getting done, there’s no telling how much more they can accomplish in the same amount of time. Try Smartsheet for free, today.
